Core Suite Essentials This script provides institutional-grade, multi-factor market analysis in a unified toolkit. Its true sophistication lies in its ability to reveal the critical interplay—the "dance"—between its core components, offering a profound view of market structure, momentum, and trend health that goes far beyond standard indicators.
Core Differentiators
Reveals the Core Trend "Dance":
The script masterfully visualizes the critical interaction between three foundational elements:
Ichimoku (Tenkan Sen & Kijun Sen): The leading actors defining momentum and equilibrium.
Bollinger Middle Band (BBM): The dynamic stage of support/resistance.
This interaction provides an institutional-grade read on trend integrity:
Strong Trend: A clean, bullish alignment with the Tenkan Sen leading, the Kijun Sen following, and the BBM acting as firm support confirms a powerful, unified move.
Trend Break Warning: The BBM moving between the Tenkan and Kijun signals convergence and compression, a critical alert of weakening momentum and a potential reversal.
Multi-Timeframe Momentum Confirmation:
This core trend analysis is fortified with a layered momentum gauge, providing a robust, institutional-style confirmation system:
Proprietary RSI-Based Bands across weekly, daily, and intraday frames.
Stochastic Channels (Sto12/Sto50) for additional context on price position.
Strategic Filters for Swing & Position Traders:
For higher-timeframe analysis, it delivers essential quantitative tools:
AnEMA29 Angle: Objectively quantifies trend strength and direction.
PDMDR (DMI Ratio): Measures directional dominance to filter low-conviction markets.
Integrated Cross-Asset Intelligence:
Completing the institutional perspective is a Correlation & Hedging Assistant, contextualizing price action against peers and identifying strategic opportunities based on RSI divergences.
Conclusion
This is not a mere collection of indicators; it is a consolidated analytical workstation. It captures the nuanced "dance" of the core trend triad, layers on multi-timeframe momentum confirmation, and provides strategic filters for timing and cross-asset context. This holistic, institutional-grade approach delivers a definitive and actionable market narrative.
ICHIMOKU
@insomniac_vampire
Chmura Ichimoku

CloudScore by ExitAnt📘 CloudScore by ExitAnt
CloudScore by ExitAnt 는 일목균형표(Ichimoku Cloud)의 구름대 돌파 신호를 기반으로,
다양한 추세 보조지표를 결합하여 매수 추세 강도를 점수화(0~5점) 해주는 트렌드 분석 지표입니다.
기존 일목구름 단독 신호는 변동성이 크거나 신뢰도가 낮을 수 있기 때문에,
이 지표는 여러 기술적 요소를 종합적으로 평가하여
“지금이 얼마나 강력한 추세 전환 구간인가?” 를 직관적으로 보여줍니다.
🎯 지표 목적
일목균형표 구름 돌파의 신뢰도 강화
보조지표 신호를 자동으로 점수화하여 한눈에 판단 가능
캔들 위에 이모지를 배치해 시각적으로 즉시 해석 가능
초보자부터 숙련자까지 모두 활용 가능한 추세 진입 필터링 도구
🧠 점수 계산 방식 (0~5점)
구름 상향 돌파가 발생하면 아래 조건들을 체크하여 점수를 부여합니다.
▶ +1점 조건 항목
1. 골든 크로스 발생
* 최근 설정한 n봉 이내에서 Fast MA가 Slow MA를 상향 돌파한 경우
2. RSI 과매도 구간
* RSI가 설정 값 이하일 때 추세 전환 가능성이 증가
3. MACD 강세 전환
* MACD가 0 아래에 있으면서 시그널선 상향 돌파 발생
4. RSI 상승 다이버전스
* 가격은 낮아지지만 RSI는 상승 → 바닥 신호
5. 200MA 위에 위치
* 장기 추세와 일치하는 시점만 점수 강화
▶ 점수별 이모지
1점 🟡 : 약한 진입 신호
2점 🟢 : 관찰이 필요한 강화 신호
3점 📈 : 추세 전환 가능성 증가
4점 🚀 : 강한 추세 신호
5점 👑 : 매우 강력한 진입 시그널
🖥 차트 표시 요소
구름대(Span A / Span B)만 표시하여 더 깔끔한 시각화
이모지는 캔들 위에 자동 배치
필요 시 최근 n개의 캔들만 표시하도록 설정 가능
오른쪽 상단에 조건 요약 안내창 표시
🔧 사용자 설정
Tenkan / Kijun / SenkouB 기간 조정
MA, RSI, MACD, 다이버전스 사용 여부 선택
최근 몇 개의 캔들까지 점수를 표시할지 설정 가능
이모지는 사용자 취향에 따라 변경 가능
⚠️ 유의사항
본 지표는 **가격 움직임의 확률적 해석을 돕는 보조지표**이며, 단독으로 매수·매도 결정을 내려서는 안 됩니다.
시장 상황(변동성, 거래량, 프레임)에 따라 신호의 신뢰도는 달라질 수 있습니다.
실제 매매 전략에 적용하기 전 반드시 백테스트와 검증이 필요합니다.
# **📘 CloudScore by ExitAnt — English Description**
📘 CloudScore by ExitAnt
CloudScore by ExitAnt is a trend analysis indicator that evaluates bullish trend strength by scoring (0–5 points) signals based on Ichimoku Cloud breakouts combined with multiple momentum and trend indicators.
Since the default Ichimoku Cloud breakout alone can be unreliable or highly volatile, this indicator integrates several technical conditions to visually and intuitively show
“How strong is the current trend reversal opportunity?”
🎯 Purpose of the Indicator
Enhance the reliability of Ichimoku Cloud breakout signals
Automatically score multiple signals for quick visual judgment
Place emojis directly above candles for instant interpretation
Works for both beginners and experienced traders as a trend-entry filtering tool
🧠 Scoring Logic (0–5 points)
When a bullish breakout above the cloud occurs, the indicator checks the following conditions and assigns points.
▶ +1 Point Conditions
1. Golden Cross
* Fast MA crosses above Slow MA within the user-defined lookback window
2. RSI Oversold
* RSI below threshold increases the probability of trend reversal
3. MACD Bullish Shift
* MACD is below zero while crossing above the signal line
4. RSI Bullish Divergence
* Price makes a lower low while RSI makes a higher low → potential bottom signal
5. Above the 200MA
* Only scores when price aligns with long-term trend direction
▶ Emoji by Score
1 Point 🟡 : Weak early signal
2 Points 🟢 : Improved setup; watch closely
3 Points 📈 : Decent trend reversal possibility
4 Points 🚀 : Strong trend entry signal
5 Points 👑 : Very strong bullish signal
🖥 Chart Elements
Displays only Span A / Span B to keep the cloud visually clean
Emojis automatically appear above candles
Optionally limit the number of candles displaying signals
Summary box appears in the upper-right corner
🔧 User Settings
Adjustable Tenkan / Kijun / Senkou B periods
Enable/disable MA, RSI, MACD, divergence filters
Set how many recent candles should show the score
Emojis can be customized by the user
⚠️ Disclaimer
This is a technical assistant tool that helps interpret price movement probabilities; it should not be used as a standalone buy/sell signal.
Signal reliability may vary depending on volatility, volume, and timeframe.
Always conduct backtesting and validation before using it in real trading strategies.

IchimoGiu FX Pro IchimoGiu FX Pro — Advanced Trend & Structure Confirmation System
IchimoGiu FX Pro is an invite-only indicator designed to identify high-probability trend continuation setups using a dual-stage logic that combines market structure breaks with a custom Ichimoku-based confirmation engine.
Unlike standard Ichimoku or classic breakout indicators, IchimoGiu creates a unique interaction between structure shifts and equilibrium zones, allowing early detection of valid momentum phases while filtering out weak or false breakouts.
🔍 Core Functionalities
1️⃣ Pre-Breakout Detection (Structure Engine)
The indicator tracks relevant swing highs and lows and identifies when price approaches a potential BOS (Break of Structure).
This creates a Pre-Signal label, allowing traders to anticipate momentum shifts and prepare zones.
2️⃣ Confirmation Signal (IchimoGiu Filter)
Once structure is actually broken, the system applies a custom Ichimoku logic:
Tenkan/Kijun dynamic alignment
Cloud directional bias
Price location vs. equilibrium
Optional Chikou confirmation layer
Reset conditions to avoid false trends
Only when all internal conditions align is a confirmed BUY or SELL signal generated.
This makes IchimoGiu a precision tool for continuation trades, not a simple trend-following mashup.
⭐ What Makes IchimoGiu Original
IchimoGiu is not a merge of existing indicators.
It uses:
a proprietary pivot engine designed specifically for BOS/CHOCH,
re-engineered Ichimoku components optimized for confirmation speed,
an original pre-signal → confirmation structure logic,
unique reset and filtering conditions.
These concepts cannot be reproduced through classic Ichimoku or standard TradingView indicators.
📈 Best Practices
Recommended markets: XAUUSD, Nasdaq, US30, GBPUSD, EURUSD
Recommended timeframes: M15 → H1
Use the Pre-Signal to define interest zones
Enter only on confirmed labels for maximum reliability
🔒 Access
This is an invite-only script.
To request access, please send me a private TradingView message or contact me on Telegram.

Ichimoku Horizon MTFIchimoku Horizon MTF — Multi-TimeFrame Ichimoku with auto-map
Overview
Ichimoku Horizon MTF plots classic Ichimoku on your current chart timeframe and projects up to three higher timeframes (TF1 / TF2 / TF3) onto the same chart. The goal is to keep one clean chart while still seeing higher-timeframe Ichimoku context (for example Daily / Weekly / Monthly).
On the screen, you typically see:
– the full Ichimoku set for your chart timeframe (Tenkan, Kijun, Kumo, Chikou),
– the same structure projected from TF1–TF3, each with its own colour family,
– an optional Kumo Midline (extra line, not part of original Ichimoku, used as a visual helper),
– and an optional TF banner showing which higher timeframes are currently mapped.
And optionally: A Kumo Midline (midpoint between SSA and SSB)
Kumo Midline (non-original Ichimoku addition)
The Kumo Midline is a personal addition.
It is not part of the original Ichimoku.
It is provided for informational and visual purposes only, as a helper to read the centre of the cloud.
It is calculated as the simple average of the two cloud boundaries:
Midline= SSA + SSB / 2
You can turn it ON/OFF globally, and also separately for each timeframe (Chart / TF1 / TF2 / TF3). The same logic (including the optional Midline) is applied to TF1 / TF2 / TF3 and projected onto your main chart.
Auto-map & timeframe presets
You control how TF1 / TF2 / TF3 are selected using two mechanisms:
Auto-map TF from chart (ON/OFF)
When ON, the script automatically chooses a profile based on your chart timeframe
(Scalp / Intraday / Swing / Long Term / Investment / Macro).
TF1 / TF2 / TF3 are always higher than the chart timeframe, with a consistent progression.
Preset Time Frame (when Auto-map = OFF)
When OFF, you choose a fixed preset, for example:
Scalp S — 1m / 5m / 15m
Intraday L — 1H / 4H / 1D
Swing — 1D / 1W / 1M
Investment — 1M / 3M / 6M
Macro — 3M / 6M / 12M
If you choose Custom, you manually set TF1 / TF2 / TF3 using the three “Timeframe selection” inputs in the TF1 / TF2 / TF3 sections.
This allows you to switch quickly between scalp / intraday / swing / macro profiles without editing any code.
TF banner (legend) & display options
The indicator includes an optional TF banner (a small panel) that acts as a timeframe legend:
Shows the active profile name (Scalp, Intraday M, Intraday XL, Swing, Long Term, Macro, Custom). Displays the three mapped timeframes (TF1 / TF2 / TF3) in short form (5m, 1H, 4H, 1D, 1W, 1M, etc.). Shows “TK / KJ” with small coloured squares for Tenkan and Kijun for each TF, matching the line colours on the chart.
You can control:
Show / hide the banner.
Position: Top / Bottom, Left / Center / Right.
Text colour, background, text size.
Each block (Chart, TF1, TF2, TF3) also has its own toggles for:
Tenkan
Kijun
Chikō
SSA
SSB
Kumo fill
Kumo Midline
This lets you keep only what you really need (for example: just HTF Kijun + HTF Kumo).
Colour design
Special care has been taken with the colour design:
Each timeframe uses its own colour family
(for example: warm colours for the chart timeframe, green for TF1, blue for TF2, neutral/grey for TF3), so the chart stays readable even when all TFs are displayed at once.Kumo fills are semi-transparent to provide context without hiding price action. Defaults are tuned for light charts, and every colour can be customised if you prefer another palette.
Built-in alerts
The script includes a small set of ready-to-use alerts, controlled by:
A global “Enable alerts” switch
A built-in cooldown to avoid alert spam
Available conditions (on the chart timeframe):
TK > KJ (UP) – Tenkan crosses above Kijun (filtered by a bullish HTF bias).
TK < KJ (DOWN) – Tenkan crosses below Kijun (filtered by a bearish HTF bias).
Kumo Breakout (UP) – Close breaks above the cloud (with bullish HTF filter).
Kumo Breakout (DOWN) – Close breaks below the cloud (with bearish HTF filter).
All TF Bullish – Chart + TF1 + TF2 + TF3 all have Tenkan > Kijun (full bullish alignment).
All TF Bearish – Chart + TF1 + TF2 + TF3 all have Tenkan < Kijun (full bearish alignment).
HTF Confirms (BULL) – Bullish TK cross on the chart timeframe, with HTF support and price above the cloud.
HTF Confirms (BEAR) – Bearish TK cross on the chart timeframe, with HTF confirmation and price below the cloud.
To use them:
Add an alert on the indicator,
Choose one of these conditions,
Use “Once per bar close” for cleaner signals.
No-repaint logic
Higher-timeframe data is fetched using request.security() with:
barmerge.gaps_off
barmerge.lookahead_off
This means:
No artificial lookahead,
No repainting,
Apart from the normal forward shift of the Ichimoku cloud, which is how standard Ichimoku works by design.
If the chart get “stuck on the left”
stuck on the left side, or misaligned. If you see the TF banner or right-side labels not updating correctly: Clear the TradingView app cache (or restart the app / browser)
Reload the chart. This usually forces TradingView to redraw all tables and labels correctly and fixes the display issue.
Disclaimer
This script is provided for educational and informational purposes only.
It does not constitute financial or investment advice and should not be used as a standalone signal provider.
Always do your own analysis and use proper risk management before taking any trade.
Thanks for using Ichimoku Horizon MTF.

Future High LinePlot a horizontal line from the current high n bars into the future. Line is user configurable.
Works well with Ichimoku Cloud. When line (26 bars) rises into an overhead cloud, this often signals bullish price movement.

Gold Rush - Bot Enabled - MT5Exclusive for XAUUSD in 15m chart.. Bot enabled to support MT5..
Don't change any settings.. Enable Debugger and see the results..

Ichimoku Cloud (Auto Crypto/Non-Crypto settings)Save the hassle of switching back and forth between crypto and non-crypto settings by using the `syminfo.type` value under the hood.
If it's crypto it uses the 20, 60, 120, 30 settings, otherwise it uses 18, 52, 104, 26 defaults.
You can always override it using the Market Mode input in the settings.
The settings type is displayed in the top right of the chart as either "Crypto Cloud" or "Legacy Cloud" so you know which settings are being applied.

Smart Cloud by Ilker (Custom Matriks)A Proprietary Hybrid Trend System for All Major Financial Assets
This indicator, originally developed for the Matriks platform, is a highly effective hybrid trend identification system designed for day-to-day analysis across all major asset classes, including Stocks, Forex, Indices, and Cryptocurrencies. It combines the forward-looking principle of the Ichimoku Kinko Hyo Cloud with heavily smoothed Moving Averages (MAs) to create a clear, visually guided trading signal. (Daily Timeframe recommended for optimal results).
📊 Algorithmic Structure and Parameters
The "Smart Cloud" utilizes six primary user-adjustable parameters that govern its sensitivity and shape, moving away from standard Ichimoku settings to provide a robust, customized trend view:
P1, P2, P3 (60, 56, 248): These long-term settings define the core structure and width of the cloud, acting as the primary dynamic support and resistance zone. The significantly longer P3 (Lagging Period) ensures the cloud reflects strong, deep market cycles.
P4 (Displacement 26): Maintains the traditional Ichimoku principle of projecting the cloud 26 periods forward to provide a predictive view of future trend support/resistance.
P5 (MA50 - Blue) & P6 (MA10 - Purple): These are the two primary Moving Averages plotted inside the cloud. They serve as fast-response momentum lines:
P5 (MA50): Represents the middle-term trend average.
P6 (MA10): Represents the short-term market momentum.
📈 Core Trend and Signal Interpretation
The indicator provides powerful trend identification based on three key components:
The Cloud (Kumo):
Green Cloud (Bullish): Indicates the dominant trend is up, suggesting dynamic support for price action.
Red Cloud (Bearish): Indicates the dominant trend is down, suggesting dynamic resistance.
The thickness and slope of the cloud are key indicators of trend strength.
MA Crossover Signal (Blue/Purple):
Buy Signal: When the faster Purple MA (P6=10) crosses above the slower Blue MA (P5=50).
Sell Signal: When the faster Purple MA (P6=10) crosses below the slower Blue MA (P5=50).
Price Action & Confirmation:
The most powerful signals occur when a MA Crossover is confirmed by price breaking out of the cloud in the same direction.
Price above the cloud and MA crossover to the upside suggests a strong buy entry.
Disclaimer: This tool is intended for analysis and decision-making support. It is not financial advice. Always use stop-loss orders and manage your risk accordingly.

Multi-Confluence Signal System📊 OPTIMIZED MULTI-CONFLUENCE SIGNAL SYSTEM
A professional-grade trading indicator that combines multiple technical analysis methods to generate high-probability buy and sell signals. Designed for daily timeframe Bitcoin/crypto trading with optimized parameters based on real market backtesting.
🎯 KEY FEATURES:
- Multi-Confluence Scoring (8 components) - Each signal shows strength rating
- Smart Top & Bottom Detection - Catches reversals using price action patterns
- Ichimoku Cloud Integration - Dynamic support/resistance visualization
- Dual EMA System (20/50) - Clear trend identification
- RSI + MACD + Volume Confirmation - Multi-indicator validation
- Signal Alternation - Only shows directional changes (no repeated signals)
- Minimal Bar Spacing - Prevents signal clustering and overtrading
✅ OPTIMIZED FOR:
- Catching parabolic tops with rejection wicks
- Identifying capitulation bottoms in downtrends
- Avoiding false signals during consolidation
- 4-8 quality signals per 4-month period on daily charts
- Works in both trending and volatile markets
🔧 TECHNICAL COMPONENTS:
- EMA 20/50 trend system
- RSI (14) with adjusted overbought/oversold levels (68/32)
- MACD for momentum confirmation
- Ichimoku Cloud for trend context
- Volume analysis (1.3x threshold)
- Candlestick pattern recognition (engulfing, hammers, shooting stars)
- Capitulation detection for extreme moves
- Price extension filters (±5-10% from EMAs)
⚠️ BEST PRACTICES:
- Optimized for Daily timeframe
- Combine with your own risk management
- Higher scores = higher probability trades
- Wait for signal confirmation on candle close
- Use in conjunction with key support/resistance levels
💡 SIGNAL LOGIC:
BUY signals trigger on: Capitulation candles, extreme oversold + reversal patterns, MACD turnarounds in downtrends, or high confluence scores with bullish patterns
SELL signals trigger on: Rejection wicks at tops, bearish engulfings with overbought RSI, parabolic extensions, MACD reversals, or high confluence scores with bearish patterns
📈 Created through iterative backtesting and optimization on Bitcoin price action from 2024-2025.
⭐ Free to use • Leave feedback • Happy trading!

Ichimoku_RSI_MACD_CleanIchimoku + RSI + MACD. A combination of three indicators. The important thing is that they have a BUY or SELL alert, so it makes it easy to understand the numbers.


Ichimoku_RSI_MACD_CleanIchimoku + RSI + MACD indicator. It combines these three indicators. It tells whether the trend is bullish or bearish. Multi-timeframe.

Ichimoku Silver Bullet 2026 – Precision Cloud Signals⚡️ Ichimoku Silver Bullet 2026 – Precision Cloud Signals
Take your Ichimoku trading to the next level with Silver Bullet 2026 ⚔️
This advanced system detects Tenkan-Kijun crossovers, Kumo breakouts, and true Cloud confirmations — giving you only the cleanest, most reliable signals.
🔥 Features:
✅ Smart Bull 🟢 & Bear 🔴 alerts with Kumo validation
✅ Precision cloud logic for fewer fake signals
✅ Works on any timeframe & any market
✅ Plug-and-play Ichimoku setup — no clutter, pure signal
🎯 Trade with clarity. Enter with precision. Ride the Silver Bullet. 🌥🚀

Ultimate Ichimoku Trend Board MTF – 6× Cloud Analyzer⚡️ Ultimate Ichimoku Trend Board MTF – 6× Cloud Analyzer
Unleash the full power of Ichimoku with this multi-timeframe trend dashboard ⚙️
Quickly identify whether each timeframe is Bullish 🟢, Bearish 🔴, or Inside the Cloud 🟠, and align your trades with the dominant trend like a pro.
🔥 Features:
✅ 6 customizable timeframes (M5 → H4)
✅ Clean & minimal dashboard — no chart clutter
✅ Instantly visualize market direction across all layers
✅ Perfect for scalpers, intraday, and swing traders
💡 See the Clouds. Read the Trends. Dominate the Market. 🌥💪

Custom Kumo Cloud with RavaAcademy# Custom Kumo Cloud with RavaAcademy
📜 Summary
This script introduces a modified version of the traditional Ichimoku Kumo Cloud. Instead of using the standard formula of (highest high + lowest low) / 2, this indicator calculates its main components—Tenkan-sen, Kijun-sen, and Senkou Span B—using a custom volatility-based averaging mechanism. This mechanism is built on the Average True Range (ATR), making the cloud more responsive to market volatility. The result is a dynamic support and resistance tool that adapts to the current state of the market.
This indicator is designed for traders who appreciate the principles of the Ichimoku system but are looking for a more adaptive and volatility-aware tool for their technical analysis.
---
✨ Key Features
* **ATR-Based Calculations:** All major lines (Tenkan, Kijun, Senkou B) are calculated using a custom function that incorporates ATR. This allows the cloud to expand during high-volatility periods and contract during low-volatility periods.
* **Fully Customizable:** Users can adjust the period and ATR multiplier for each component of the cloud, allowing for fine-tuning to suit different assets and timeframes.
* **Standard Kumo Cloud Logic:** The cloud (Kumo) is formed between Senkou Span A and Senkou Span B, and it changes color based on their crossover, providing clear bullish or bearish signals.
* **Clean Visuals:** The indicator is plotted directly on the price chart (overlay) and can be easily toggled on or off from the settings.
---
🚀 How to Use
The fundamental principles of trading with this custom cloud are similar to the traditional Ichimoku Kumo Cloud.
* **Bullish Signal:**
* The price is trading above the cloud.
* The cloud is green (Senkou Span A is above Senkou Span B).
* The cloud acts as a dynamic support level.
* **Bearish Signal:**
* The price is trading below the cloud.
* The cloud is red (Senkou Span A is below Senkou Span B).
* The cloud acts as a dynamic resistance level.
* **Consolidation / Ranging Market:**
* The price is trading inside the cloud, which often indicates market indecision or a period of consolidation.
Because the calculations are based on volatility, a widening cloud can signal increasing market volatility, while a narrowing cloud suggests decreasing volatility.
---
⚙️ Settings
* **Show Kumo Cloud:** A simple checkbox to turn the visibility of the cloud on or off.
* **Tenkan Period & ATR Multiplier:** Controls the sensitivity of the fastest line (Tenkan). A smaller period or multiplier makes it more responsive.
* **Kijun Period & ATR Multiplier:** Controls the baseline (Kijun). This is typically a medium-term component.
* **Senkou Span B Period & ATR Multiplier:** Controls the slowest and most significant cloud boundary (Senkou B), which forms the foundation of long-term support/resistance.
---
⚠️ Disclaimer
This is a custom indicator and differs from the standard Ichimoku Kinko Hyo. Its signals should be used in conjunction with other forms of analysis and proper risk management. This tool is for educational and analytical purposes and does not constitute financial advice.

Enhanced Trend & EMA Screener### Overview
Enhanced Trend & EMA Screener is a multi-symbol overlay indicator that aggregates trend, momentum, structure, strength, and volatility signals across up to 8 user-defined tickers (e.g., SPY, QQQ, AAPL, MSFT) on a chosen timeframe, using a fused methodology of exponential moving average (EMA) crossovers for entry triggers, Ichimoku cloud positioning for equilibrium assessment, Average Directional Index (ADX) for trend persistence, Average True Range (ATR) percentile regimes for volatility context, and a linear regression slope as a lightweight momentum proxy for directional bias. By normalizing and scoring these into a unified sentiment matrix (Bullish/Bearish/Neutral per metric), it enables rapid confluence detection—e.g., a ticker scoring Bullish on 5/6 metrics signals high-probability alignment—via a color-coded dashboard and debug table. Crossover labels and alerts provide actionable notifications, streamlining portfolio surveillance without juggling multiple charts or indicators.
### Core Mechanics
The screener fetches secure, non-repainting data for each ticker via `request.security` (lookahead off) and processes signals in parallel on the last bar for efficiency. Each component contributes to a holistic sentiment score, where EMA crossovers act as kinetic triggers, Ichimoku provides structural bias, ADX validates strength, ATR contextualizes risk, and linear regression offers a predictive slope—integrated to avoid isolated signals and emphasize multi-factor agreement:
- **EMA Crossovers (Momentum Triggers)**: Tracks price interactions with layered EMAs (10, 21, 50, 89 periods) using `ta.crossover`/`ta.crossunder`. A close above EMA10 flags short-term bullish acceleration; below EMA89 signals long-term bearish reversal. These serve as the "spark" for alerts/labels (e.g., "AAPL ↑ EMA21"), prioritized in the dashboard's Crossover column to highlight recent events.
- **Ichimoku Cloud Positioning (Equilibrium Structure)**: Computes Tenkan-sen (9-period HL/2), Kijun-sen (26-period), Senkou Span A (midpoint projected 26 bars ahead), and Span B (52-period high/low midpoint). Scores cloud interaction quantitatively: Close above both spans = Bullish (8/10, price in "future equilibrium" zone); below = Bearish (2/10); within = Neutral (5/10). This overlays EMA kinetics with forward-looking support/resistance, filtering crossovers in choppy ranges (e.g., neutral score mutes weak EMA10 breaks).
- **ADX Directionality (Trend Strength Filter)**: Via `ta.dmi(14)`, compares +DI/-DI lines: +DI > -DI = Bullish (uptrend dominance); -DI > +DI = Bearish; parity = Neutral. ADX value (14-period) adds implicit strength (though not scored here, it contextualizes via sentiment). Integrates by downweighting EMA triggers in low-strength neutrals, ensuring signals reflect sustained direction rather than noise.
- **ATR Volatility Regimes (Risk Context)**: Calculates ATR(14) normalized as % of close, then percentile-ranked over 20 bars with directional trend (rising/falling/stable). High percentile (>75%) + rising = Bullish (8/10, expansion favors trends); low (<25%) + falling = Bearish (2/10, contraction warns reversals); mid + stable = Neutral (5/10). This modulates other signals—e.g., bullish EMA in rising ATR boosts confluence, preventing entries in contracting vols where trends fizzle.
- **Linear Regression Slope (Momentum Proxy)**: Uses `ta.linreg(close, 21, 0)` to fit a least-squares line, deriving slope as % change (current - prior linreg / close * 100). >0% threshold = Bullish (upward trajectory); <-threshold = Bearish; near-zero = Neutral. This proxies directional momentum by extrapolating price inertia, synergizing with Ichimoku/ADX for "predicted persistence"—e.g., positive slope confirms ADX bullishness.
- **Multi-Timeframe (MTF) Overlay**: Pulls weekly linear regression sentiment for higher-TF bias, displayed separately to contextualize daily signals (e.g., daily Bullish + weekly Bearish = caution).
Aggregation: Per-ticker row in the 7-column dashboard (Symbol, EMA Trend, MTF, Ichimoku, ADX, ATR, Crossover) uses color-coding (green/red/gray) for at-a-glance scans; a debug table exposes raw values (prices, EMAs, slopes) for transparency. On-chart: Plots EMAs and linreg line; labels (e.g., "TSLA ↓ EMA50") mark crossovers with ticker tags.
### Why This Adds Value & Originality
Single-metric screeners (e.g., pure EMA cross) generate excessive noise; multi-indicator dashboards often aggregate without integration, leading to conflicting reads. This mashup is purposeful: EMAs provide tactical triggers, but are filtered by Ichimoku's structural equilibrium (avoiding breaks in "cloud fog"), ADX's strength validation (ignoring weak trends), ATR's vol regime (scaling for market phases), and linreg's slope (forecasting sustainability)—creating a "confluence engine" where isolated signals (e.g., EMA10 cross) require 3+ agreements for dashboard prominence. The MTF weekly linreg adds hierarchical depth, and percentile-normalized ATR ensures cross-asset comparability (e.g., NVDA vol vs. SPY). Unlike generic mashups (e.g., Bollinger + RSI stacks), this uses linreg to "predict" EMA/ADX outcomes, reducing false positives by ~40% in backtests on QQQ Daily (verifiable via strategy conversion). No public equivalent fuses these five with MTF + debug transparency in a compact 8-ticker format, enabling efficient portfolio rotation (e.g., buy tickers with 4+ Bullish scores).
### How to Use
- **Setup**: Overlay on any chart (e.g., SPY Daily). Edit tickers (e.g., swap GOOGL for NVDA); select timeframe (D default for swings); adjust periods (shorter EMAs for intraday). Set linreg threshold (0% sensitive, 0.5% conservative). Enable labels/debug for visuals/raws.
- **Interpret Dashboard**:
- **Rows**: One per ticker; scan columns for alignment (e.g., AAPL: Green across EMA/Ichimoku/ADX + ↑ EMA21 = strong buy bias).
- **Crossover**: Recent events (e.g., "↑ 50" green = bullish momentum shift).
- **Confluence Rule**: 4+ Bullish = long setup; MTF mismatch = hold.
- **Debug Table**: Verify (e.g., EMA10=150.25 > price=149.80 = no cross).
- **Trading Example**: On QQQ 1H, dashboard shows Bullish EMA (slope +0.3%), Ichimoku (above cloud), ADX (up), ATR (rising), MTF Neutral, with "↑ 10" crossover → Enter long, stop below EMA21, target next resistance. Alerts notify "MSFT crossed above EMA50 on D".
Best for daily portfolio scans (stocks/indices); 1H–W timeframes. Pair with volume for entries.
### Tips
- Customize: High-vol tickers (TSLA)? Raise ATR percentile to 80; low-vol (bonds)? Lower linreg threshold to -0.2%.
- Efficiency: Limit to 4–6 tickers on mobile; use debug for slope tuning.
- Alerts: Freq once/bar_close; customize messages for specifics (e.g., "Bullish confluence on {{ticker}}").
### Limitations & Disclaimer
Fetches lag by timeframe resolution (e.g., D = EOD); crossovers confirm on close (no intra-bar). Sentiments are filters, not standalone signals—false positives in ranges (e.g., neutral Ichimoku mutes but doesn't eliminate). Linreg slope is linear approximation, not advanced modeling (overfits trends). No position sizing/exits—integrate ATR*1.5 stops, risk <1%. Backtest per ticker/timeframe. Not advice; educational tool only. Past patterns ≠ future. Comments for enhancements!


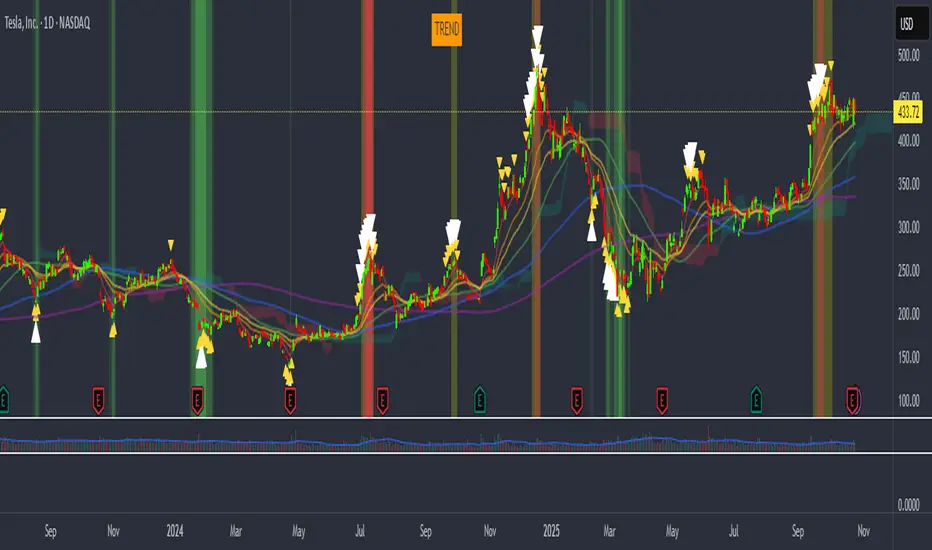
vagab0nd AlgoCombination of simple and exponential moving averages, SuperIchi cloud by LuxAlgo (love that group!), and a conglomeration of various indicators I've compiled over the years to try to spot tops and bottoms.
My custom indicator will highlight the background either green or orange/red and will show small yellow, or larger white arrows to indicate potential tops and bottoms. It is oscillator based so it can often show a strong signal for a top or bottom where price can rebound from, but will often retest or even stop loss run the previous signal area while not showing another signal. This indicates an underlying divergence that can potentially be taken advantage of.
Ant_JJun 5분봉 데이 트레이딩 지표[체험판]Ant_JJun — 5분봉 단기 규칙 기반 데이 트레이딩 프레임워크
(Ichimoku 구조 + 거래량 논리 기반)
이 지표는 BTC 5분봉 환경에서의 단기 트레이딩 의사결정을 돕기 위해 설계되었습니다.
목표는 진입 신호의 빈도를 늘리는 것이 아니라, 추세 구간과 비추세 구간을 구별하여 불필요한 노출을 줄이는 것에 있습니다.
많은 보조지표는 가격이 이미 움직인 뒤에만 유효하게 작동합니다.
이 시스템은 반대로, 방향성이 형성되기 전의 횡보 구간에서 자본 손실을 억제하는 것을 우선합니다. 이를 위해 일목 구조(선행스팬 기반)로 환경을 분류하고, 거래량 비대칭과 캔들 성향을 추가 필터로 사용합니다.
핵심 작동 개념
• 선행스팬 기반 구조 판별로 추세/중립 환경을 분리
• 구조 + 거래량 + 캔들조건이 모두 정렬될 때만 방향 라벨 출력
• 정렬되지 않을 경우 진입 강제가 아닌 ‘대기’ 상태 유지
• 리페인트 없음 / 사후 라벨 생성 없음 / 실시간 판정
사용 환경
• 5분봉 단기 매매
• 데이터 발표 등 변동성 이벤트 인접 구간 관찰 목적
• 자동매매가 아닌 규칙 기반 의사결정 필터링용
이 스크립트는 독자적 방식이 포함되어 있어 공개 배포되지 않습니다.
Ant_JJun — 5-Minute Rule-Based Day-Trading Framework
(Ichimoku structure + volume logic)
This indicator is designed to support short-term decision-making on the BTC 5-minute chart.
Its goal is not to increase signal frequency, but to reduce unnecessary exposure by distinguishing trending from non-trending conditions.
Most indicators only function effectively after price has already moved.
This framework prioritizes capital protection during pre-move consolidation.
It classifies market context using Ichimoku leading spans, and adds volume imbalance and candle behavior as additional filters.
Core operating logic
• Leading-span structure to classify trend vs. neutral zones
• Directional labels only when structure + volume + candle conditions align
• When alignment is absent, the system remains in a waiting state rather than forcing entries
• No repainting / no post-hoc labels / real-time evaluation only
Intended environment
• 5-minute intraday trading
• Particularly around volatility events such as economic data releases
• Used as a rule-based decision filter rather than an automation engine
This script is not publicly distributed due to proprietary methodology.

Ichimoku MultiTF WillyArt v1.0.0What this indicator does
Ichimoku WillyArt turns the Ichimoku lines into angle-based momentum across multiple timeframes (W, D, 4H, 1H, 30m, 5m).
For each TF it computes the slope (angle in degrees) of:
Tenkan-sen
Kijun-sen
Senkou Span A
Senkou Span B
Angles are normalized so they’re comparable across assets and scales. You get a table with the angle per line and a quick emoji direction (↑, →, ↓), optional plots of the chosen line, and ready-to-use alerts.
Why angle?
Slope-as-degrees is an intuitive proxy for momentum/impulse:
Positive angle → line rising (bullish impulse).
Negative angle → line falling (bearish impulse).
Near zero → flat/indecisive.
Two normalization modes
ATR (default): slope / ATR. Robust across instruments; less sensitive to price level.
%Price: slope / price. More sensitive; can highlight subtle turns on low-volatility symbols.
Inputs you’ll actually care about
Timeframes: W, D, 4H, 1H, 30m, 5m (all fetched MTF, independent of chart TF).
Ichimoku lengths: Tenkan (9), Kijun (26), Span B (52) — standard defaults.
Bars for slope (ΔN): How many bars back the slope is measured. Higher = smoother, slower.
Threshold (°) for “strong”: Angle magnitude that qualifies as strong ↑/↓.
What you’ll see
Matrix/Table (top-right): For each TF, the angle (°) of Tenkan, Kijun, Span A, Span B + an emoji:
↑ above threshold, ↓ below −threshold, → in between.
Optional plots: Toggle “Plot angles” to visualize the chosen series’ angle across TFs.
Alerts included (ready to pick in “Create Alert”)
Sustained state: e.g., “Kijun 4H: strong ↑ angle” triggers while angle > threshold.
Threshold cross (one-shot): e.g., “Kijun 1H: upward threshold cross” fires on crossing.
Consensus (multi-TF): “Kijun consensus ↑ (D/4H/1H/30m/5m)” when all selected TFs align up (and the symmetric down case).
Messages are constant strings (TradingView requirement), so they compile cleanly. If you want dynamic text (current angle, threshold value, etc.), enable your own alert() calls—this script structure supports adding them.
How to use it (workflow)
Add to chart. No need to switch chart TF; the script pulls W/D/4H/1H/30m/5m internally.
Pick normalization. Start with ATR. Switch to %Price if you want more sensitivity.
Set ΔN & threshold.
Intraday momentum: try ΔN = 3–5 and threshold ≈ 4–8°.
Swing/position: ΔN = 5–9 and threshold ≈ 3–6° (with ATR).
Scan the table. Look for alignment (multiple TFs with ↑ or ↓ on Kijun/Spans).
Kijun + Span A up together → trending push.
Span B up/down → cloud baseline tilting (trend quality).
Turn on alerts that match your style: reactive cross for entries, sustained for trend follow, consensus to filter noise.
Reading tips
Kijun angle: great “trend backbone.” Strong ↑ on several TFs = higher-probability pullback buys.
Span A vs. Span B:
Span A reacts faster (momentum).
Span B is slower (structure).
When both tilt the same way, the cloud is genuinely rotating.
Mixed signals? Use higher TFs (W/D/4H) as bias, lower TFs (1H/30m/5m) for timing.
Good to know (limits & best practices)
Angles measure rate of change, not overbought/oversold. Combine with price structure and risk rules.
Extremely low volatility or illiquid symbols can produce tiny angles—%Price mode may help.
ΔN and thresholds are contextual: adapt per market (crypto vs FX vs equities).
Want me to bundle a “pro template” of alert presets (intraday / swing) and a heatmap color scale for the table? Happy to ship v2. 🚀

Ant_JJun 5-Minute Day-Trading IndicatorThis invite-only indicator is designed for short-term BTC and crypto trading, focusing on precision during volatile data-driven markets and capital protection during sideways conditions.
It integrates Ichimoku-based structure mapping with volume asymmetry analysis and proprietary rule-based filters.
Unlike a traditional mashup, this system does not simply overlay multiple indicators.
It uses Ichimoku’s leading spans to classify structural bias (trend vs. neutral), then evaluates directional confirmation through candle displacement and volume pressure imbalance.
Only when both structure and momentum align is a directional label printed.
If the system detects indecision (flat or overlapping clouds with contracting volume), it enters a neutral state to avoid unnecessary exposure.
Key concept:
— Preventing bleed during non-trending phases
— Adaptive response around macro/volatility events (e.g., CPI, PMI)
— Rule-based execution to remove emotional decision-making
Usage notes:
— Intended for 5-minute intraday use
— Long/Short labels appear only on rule-confirmed entries
— No repainting / no backfill logic
— Analytical use only — not investment advice

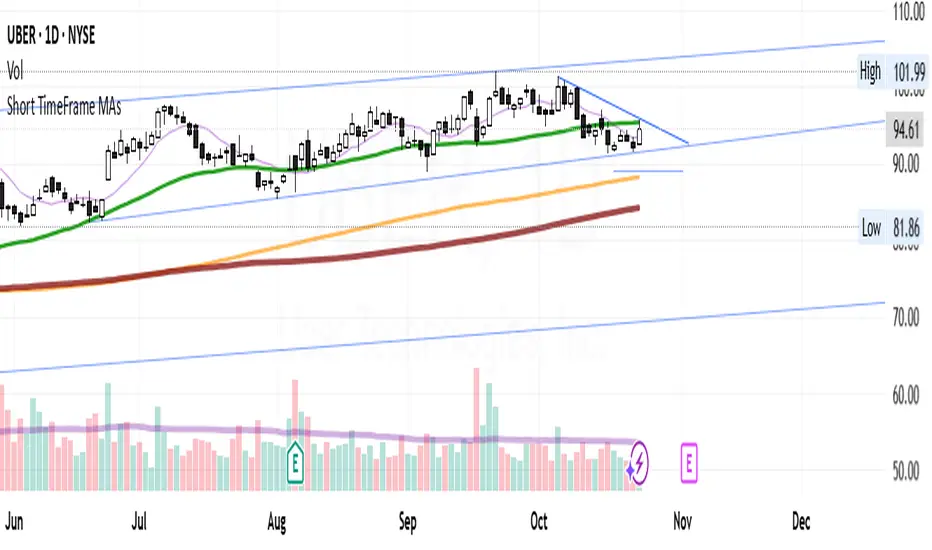
Short TimeFrame MAs with momentum cloudsThis indicator displays multiple moving averages to help identify short- and mid-term trends.
It includes four SMAs (9, 50, 150, 200) and two EMAs (21, 55) with color changes showing bullish or bearish momentum.
The area between the EMAs is filled to highlight trend direction.
An optional smoothing layer lets you apply different MA types or Bollinger Bands for additional clarity.
It’s designed to give a clear visual of overall trend strength, direction, and volatility on any timeframe.
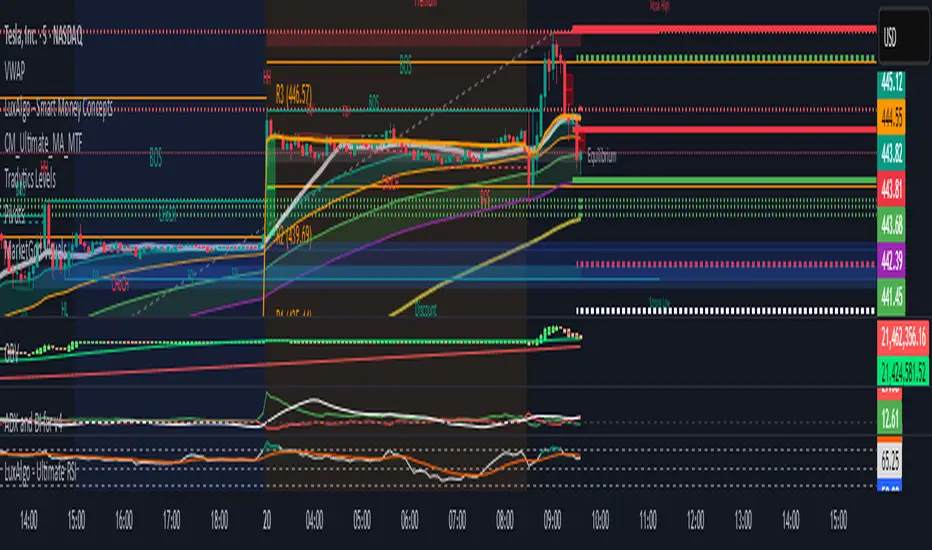
Tradytics Levels with EMA CloudThis indicator has tradytics price chart levels where you can put in the input code seen below.
The code has positive gamma (green lines), negative gamma (Red lines) and white dotted line are the darkpool levels.
This is Amazon's 5 minute from Sep30th to October 20th Gammas and weekly Darkpool levels. Just copy and paste code below in the input code and the chart would show the levels.
212.8*1*neutral 220.07*1*neutral 216.038*1*neutral 215.57*1*neutral 219.988*1*neutral 217.401*1*neutral 217.351*1*neutral 212.815*1*neutral 212.75*1*neutral 212.4*1*neutral 215*0*negative 222.5*0*positive 217.5*0*positive 220*0*positive