IBOV ShadowEnglish
IBOV Shadow
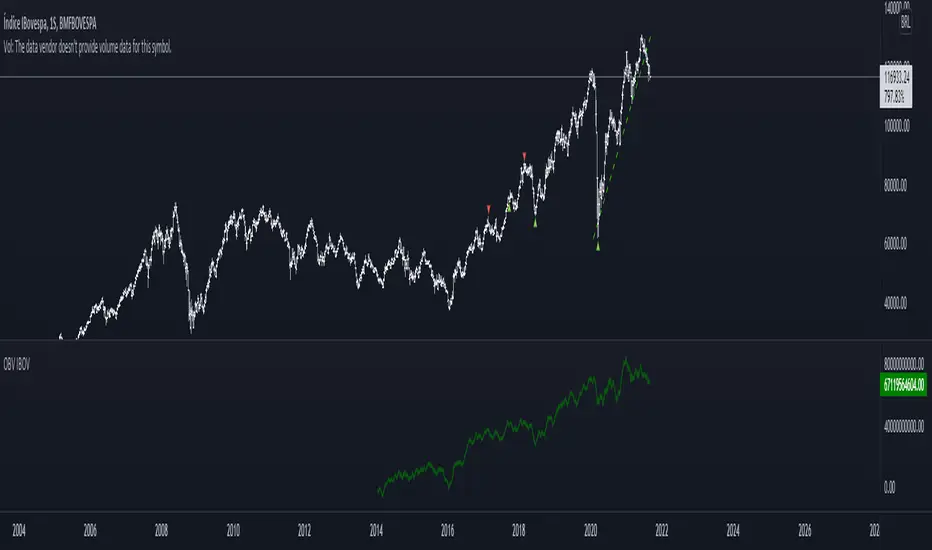
This indicator is designed to provide a complementary analysis of the Brazilian market, offering an alternative perspective to the traditional IBOV index. It can be used BMFBOVESPA:IBOV , and it operates independently, seeking a correlation with the overall market by calculating based on commodities , global stocks , interest rates , the dollar , and other assets.
What the Indicator Does
The IBOV Shadow acts as a real-time fair price forecast for the Ibovespa . The line it plots represents the value the index should have at that moment, based on multiple market factors. The primary analysis comes from comparing the indicator's line with the actual Ibovespa price:
Underpricing (Upside Potential) : When the IBOV Shadow line is above the Ibovespa's price, it suggests that the market is underpricing the index. The "fair" value is higher than the current one, which may indicate potential for an upward move.
Overpricing (Downside Potential) : When the IBOV Shadow line is below the Ibovespa's price, it suggests that the market is overpricing the index. The "fair" value is lower than the current one, which may indicate that a downward correction could be on the way.
The indicator's line also changes color to signal its own trend: green when it's trending up (a strong market) and red when it's trending down (a weak market).
How to Use It
Capturing Divergences (The Main Point) : The most powerful use of the IBOV Shadow is in identifying divergences . A divergence occurs when the price movement of the Ibovespa and the movement of our indicator are out of sync.
Bullish Divergence : This happens when the Ibovespa's price makes a new low , but the Shadow indicator does not follow, instead making a higher low . This suggests that downward pressure is weakening.
Bearish Divergence : This occurs when the Ibovespa's price makes a new high , but the Shadow indicator fails to do the same, creating a lower high . This is a strong sign that the uptrend is weakening.
Trend Confirmation : Use the line's color as a confirmation tool. If you already have an uptrend in mind, a green line can reinforce your analysis. Likewise, a red line can confirm a downtrend.
Contextual Analysis : This indicator is most effective when used in conjunction with other tools and analyses. Do not use it as your sole decision-making source.
Final Considerations
Remember that this indicator is a supporting tool. The financial market is complex, and no single tool guarantees success. Practice and the use of multiple indicators and strategies are fundamental for a complete analysis.
Ibovespa

Swingtrade strategy for volatile assets on the hourly chartThe strategy of this script is based on a setup that I used in 2016 for swingtrade on PETR4 and other IBOV actions. The intention of this script was to carry out a study to validate the effectiveness of the strategy precisely.
- This strategy works only to operate bought on the 1h (one hour) chart;
- The strategy is based on the strength of the market, which is measured according to moving averages;
- The setup uses targets of 3% above the input signal price and 11.5% stoploss for all operations;
- The stoploss is bigger than the target, this causes the hit rate to be high, but when there is a loss, the damage can be large;
- The setup performed well in some shares of the Brazilian stock market and cryptocurrencies of the dollar pair;

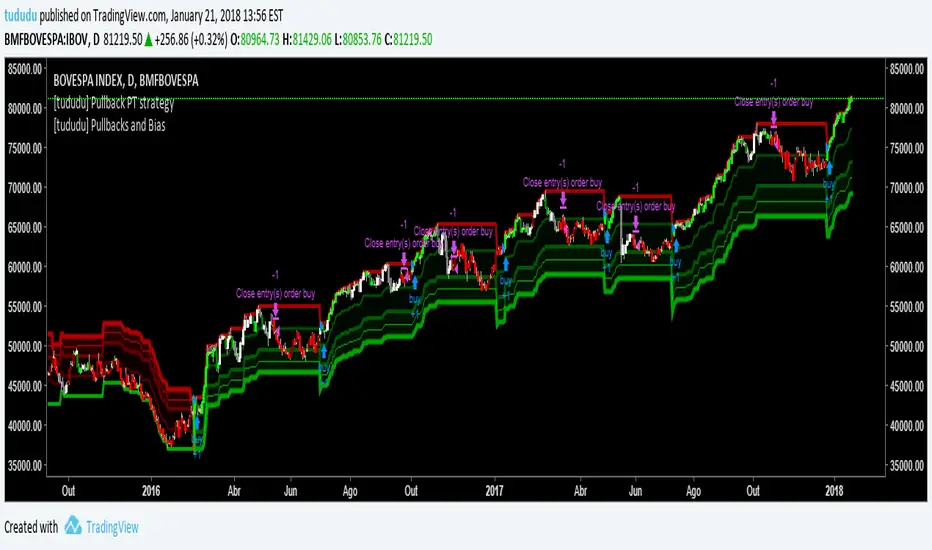
[tududu] Pullbacks and Directional BiasQuick analysis for TRENDING markets. This script tracks trend and 3 pullbacks ranges from n-bar max/lows.
Pullback values are floats so ranges can be < 1% for intraday trading. On top of it, it also provides non-lagging "directional bias" candle colors by tracking the earliest possible swing highs.
Also, thanks for the 100+ likes on my previous script ("Day Trade Suite").
---
Script para análise de mercados em tendência. O script marca 3 faixas de pullbacks a partir das máximas ou mínimas de x-barras (valores precisam ser manualmente ajustados para diferentes mercados, mas em uma próxima versão pretendo incluir algum tipo de análise automatizada de volatilidade).
Programado para timeframe diário, porém é possível configurar as faixas de pullback para menos de 1% (ex. 0.5) para daytrade. Além disso, o script também fornece barras de cores direcionais com pouco atraso, detectando swing highs em formação.
Obrigado por todas as curtidas no meu script anterior ("Day Trade Suite") !
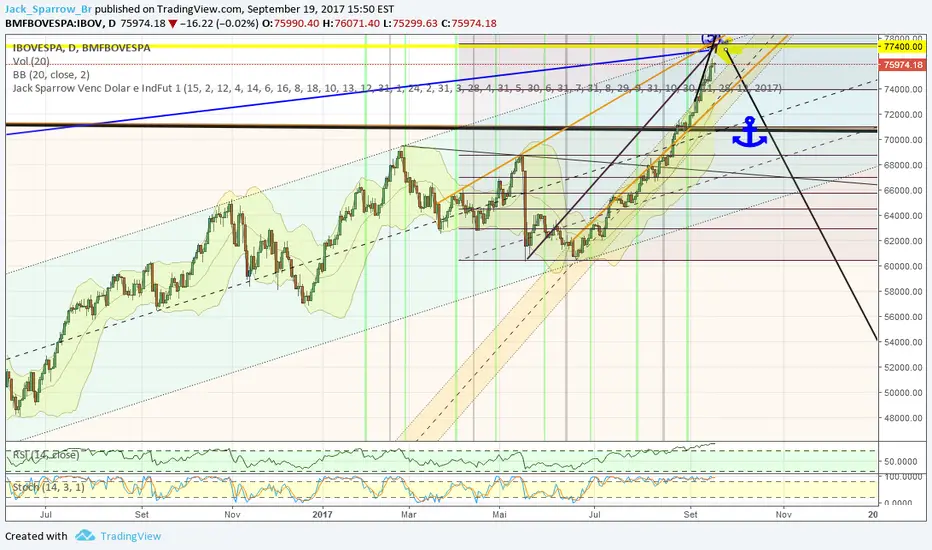
Jack Sparrow Venc Dolar e IndFut 2017Script que marca os Vencimentos de Dólar e Índice Futuro do Ibovespa.
Em Verde são os vercimentos do Dólar , uma por mês totalizando 12.
Já em Cinza os vencimentos do Índice Futuro , são 6 datas ao longo do ano.
Caso tenha algum valor incorreto, favor comunicar.
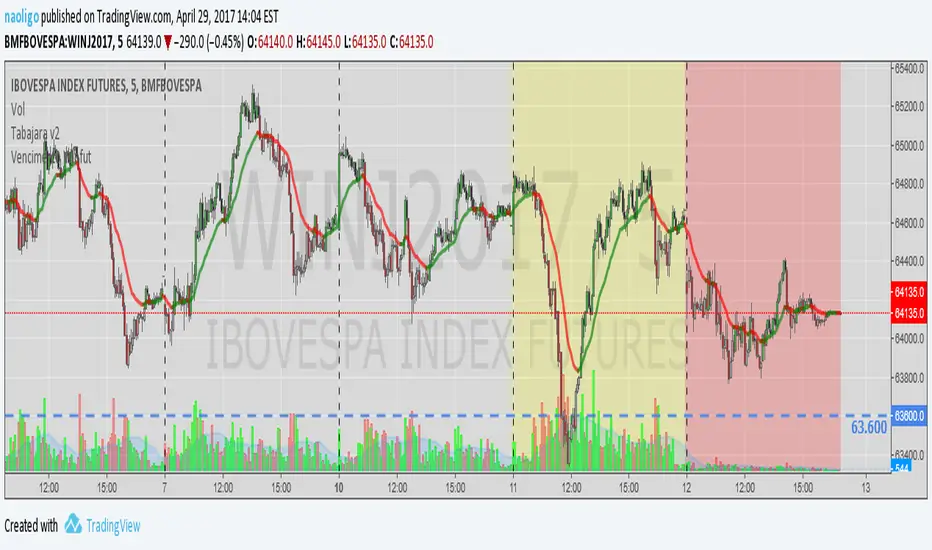
[naoligo] Vencimento MiniIndicador para marcar o background da data de vencimento da série do Bovespa Mini (winfut) e da data anterior ao vencimento. Considero importante para Swing Trade e para lembrar iniciar operações na próxima série.
Indicator to mark the background on the maturity date of the Bovespa Mini series (winfut minicontracts) and on the date before maturity. I consider it important to Swing Trade and to remember to start trading the next code.