Sessions & Key Levels {basic}Introduction
Sessions & Key Levels {basic} is a streamlined key level indicator designed to provide traders with clear visual structure around intraday trading sessions and essential higher timeframe reference levels.
The {basic} version focuses on the most commonly used session and price levels, helping traders identify important areas of interest without overwhelming the chart. It is ideal for traders who want a clean, reliable framework for session-based and timeframe-based analysis.
Description
The indicator plots the Asia, London and New York trading sessions directly on the chart, including session boxes and key session levels. Session highs and lows update dynamically while the session is active, providing real-time context as price develops.
In addition to session levels, the indicator includes current and previous period levels from a single configurable timeframe. These levels highlight important open, high, low and midpoint references that are frequently respected by price and commonly used for intraday bias, structure and trade planning.
The {basic} version is designed to remain visually minimal, with fixed styling and simplified settings, making it easy to use straight out of the box.
Features
Global session windows
Asia, London and New York sessions.
Custom session times.
Session boxes with adaptive highs and lows.
Session levels
Open, high, low and midpoint per session.
Automatically updates during active sessions.
Clean, consistent labelling.
Previous period levels
One configurable timeframe.
Open, high, low and midpoint of the prior period.
Useful for daily or intraday reference levels.
Current period levels
Tracks live open, high, low and midpoint of the selected timeframe.
Updates dynamically as the timeframe progresses.
Simplified design
Fixed line styles and colors for clarity.
Dark and light theme support.
Minimal settings for ease of use.
Terms & Conditions
This indicator is provided for educational and informational purposes only and does not constitute financial advice.
Trading involves risk and past performance is not indicative of future results.
The user assumes full responsibility for any trading decisions made using this indicator.
Hightimeframe

Custom Horizontal Lines | Trade Symmetry📊 Custom Horizontal Lines
🔍 Overview
The Custom Horizontal Lines is a precision utility designed for traders who perform manual higher-timeframe analysis and want to preserve their marked price levels directly on the chart.
It doesn’t calculate or detect anything automatically — instead, it acts as your personal level memory, preserving your analyzed zones and reference prices throughout the session.
Ideal for traders who manually mark the High, Low, Open, Close, Mean Thresholds, and Quarter Levels of Order Blocks, Fair Value Gaps, Inversion Fair Value Gaps and Wicks before the trading day begins.
⚙️ Key Features
✅ Manual Level Entry — Input your analyzed price levels (OB, FVG, WICK,etc) directly into the indicator settings.
✅ Preserved Levels — Once entered, your lines stay visible and consistent — even after switching symbols, timeframes, or reloading the chart.
✅ Supports All Level Types — Store any kind of manually defined level: OB highs/lows, FVG boundaries, Wicks, Mean Thresholds, Quarter levels, or custom reference prices.
✅ Clean Visualization — Customize line color, style, and labels for easy visual organization.
✅ Session-Ready Workflow — Built for pre-market preparation — enter your HTF levels once, and trade around them all day.
✅ No Auto Calculations — 100% manual by design — ensuring only your analyzed levels are shown, exactly as you defined them.
💡 How to Use
Open the indicator’s settings and manually enter those price values.
The indicator will plot and preserve those exact levels on your chart.
Switch to your lower timeframe and observe how price reacts around them — without ever needing to redraw.
🎯 Why It’s Useful
Keeps your HTF levels organized and persistent across sessions.
Saves time by avoiding redrawing.
Fits perfectly into ICT / Smart Money trading workflows.
Ensures full manual control and precision over what’s displayed on your chart.
🧩 Ideal For
ICT and Smart Money traders
Institutional-style manual analysts
Traders marking Mean Thresholds, or Quarter Levels of OBs, FVGs, Wicks etc
Anyone who wants a clean, reliable way to preserve their manual analysis

High Time Frame (HTF) Swing PointsIdentify and display swing highs and lows across multiple higher timeframes on a chart, overlaying horizontal lines and customizable labels at these swing points.
Timeframes
Five user-defined higher timeframes (default settings: 5-minute, 15-minute, 1-hour, 4-hour, and daily)
Manually show/hide individual timeframes
When chart’s timeframe is set higher than one of the five configured, the indicator will automatically hide it. This helps to prevent clutter when navigating between timeframes on the chart
Swing Levels
Configure the line color, opacity, width and weather it’s solid/dotted/dashed
Once swing levels are identified, the indicator will look for the chart candle where the line starts
When price crosses the swing level, the line will be terminated
Tags
Customize the tag text for each individual timeframe, using blank if a tag is not desired for that timeframe
A tag text color can be set for all tags or base it on the line color
Set tag text size based on: Auto, Tiny, Small, Normal, Large
Choose how far to the right of the line the tag text should appear, as an integer representing the size of a candle
Choose to clear the tag or leave it in place after price crosses a swing level
Use Cases
Visualize key swing points from higher timeframes to identify potential reversal or breakout zones
Identify possible low resistance liquidity run (LRLR) areas
Use swing points for stop placement or as targets or draws on liquidity

Heiken Ashi Algo Premium KillZoneTraders face daily challenges in navigating the fast-paced market, from waiting for higher timeframe data to delayed confirmation signals. This innovative system changes everything, offering tools that have never before been available in the trading community. With groundbreaking features like
KillZones
High Timeframe RSI (HTF RSI) and
True Midline
this system is seeks to solve major problems that hurt traders every day.
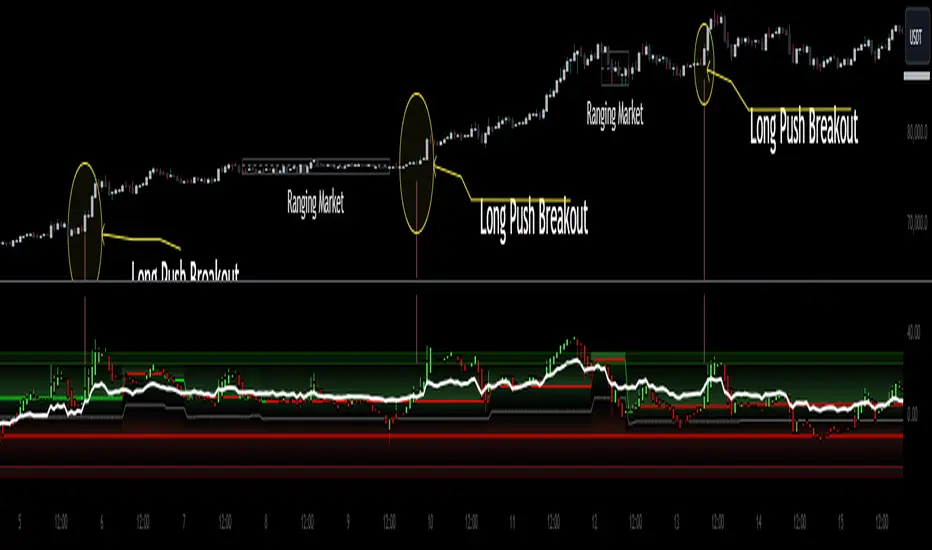
KillZones give traders an edge by pinpointing critical price levels where momentum and liquidity shift.
The Custom High Timeframe RSI brings real-time higher timeframe trend confirmation directly to your chart, eliminating the need to wait for candles to close. A totally new way to calculate HTF RSI without waiting for higher time candles to close.
The True Midline adjusts dynamically, showing exactly when the market is in equilibrium or transitioning between bullish and bearish momentum.
Custom Heiken-Ashi Oscillator Candles:
It uses customized Heiken Ashi candle calculations that allow it present trends more accurately while the candles are limited to an oscillator as opposed to price values. Candle up or candle down doesnt always mean long or short. Ive included a setting called "Secret Sauce Colors" to alter the colors of the Heiken Ashi candles so they will be colored to the actual trend taking place instead of just bullish or bearish closing.
The Liquidity Ribbon:
This indicator contains a built in customized version of a Stochastic Oscillator called "The Liquidity Ribbon" which shows you when liquidity of either side is entering and existing the market. It uses calculations of market and volume pressure to give you a visual representation of who is trying to alter asset pricing. This is NOT the stochastic RSI but I've given you guys an visual approach of something that looks similar.
The ribbon has bullish and bearish sides that flip over eachother. As one grows, the other shrinks so yo u can see in real time the flow of money from either side and whos winning.
Bullish and Bearish Premium and Discount Zones
What Are They?
Bullish and Bearish Premium and Discount Zones are visualized on the indicator as distinct colored sections within the oscillator, providing a quick snapshot of market conditions:
Bearish Premium Zone: Indicates areas of overextension in bearish momentum, often associated with ranging markets.
Bearish Discount Zone: Highlights opportunities where bearish trends are gaining strength and momentum is trending.
Bullish Discount Zone: Marks areas in bullish conditions where the market is consolidating or ranging.
Bullish Premium Zone: Identifies zones where bullish momentum is strong and trends are more pronounced.
How to Use Them?
For long trades, consider the following:
Scalping Opportunities: When the market is trending higher and Heiken-Ashi candles are closing above the high-timeframe RSI, short-term long scalps can be executed in the Discount Bullish Zone, where consolidation occurs.
Trending Trades: Larger, more sustained long trades can be taken when price moves into the Premium Bullish Zone, signaling stronger upward momentum.
Breakout Trading: When price crosses into a trending zone and simultaneously breaks through previous price resistance or support, this confluence solidifies entries for breakout trades across previous highs or lows, providing a higher probability for successful trades.
This structured use of Premium and Discount Zones gives traders a clear edge, offering insights into both market range and trend strength.
True Midline
What Is It?
The True Midline represents the dynamic equilibrium between buyers and sellers, adapting to real-time market activity. Unlike fixed midlines in traditional oscillators, it adjusts based on where buyers and sellers enter and exit the market.
How Does It Work?
The midline accounts for four key activities: buyer entry, buyer exit, seller entry, and seller exit. This holistic approach highlights shifts in momentum and periods of reduced activity, such as when both buyers and sellers exit simultaneously, creating larger ranging zones.
How to Use It?
Consolidation Zones: Narrow midline ranges signal market indecision, often preceding breakouts.
Momentum Shifts: Crossing above or below the midline indicates transitions into bullish or bearish conditions.
Ranging Markets: Identifies reduced interest during simultaneous buyer and seller exits, helping avoid false signals.
The True Midline offers a clearer picture of market balance, helping traders navigate trends and consolidations with confidence.
Dynamic Trending Zones:
What Are They?
Dynamic Trending Zones represent areas of high volatility and breakout potential, reflecting shifts in market momentum and participation. These zones are self-adjusting and directly influence the midline's position.
There are two zones:
Bullish Trending Zone: Signals increased buyer momentum.
Bearish Trending Zone: Signals increased seller momentum.
How Are They Calculated?
The zones are derived using a combination of volume pressure and momentum changes, but these changes need to be sufficient to have moved price over time:
The indicator tracks sudden shifts in momentum relative to volume changes to identify critical thresholds for breakouts.
A "need-to-cross" point is established in each zone, acting as a breakout trigger.
If opposing or additional volume and momentum are insufficient, the zone remains unchanged until market conditions shift.
This ensures the zones dynamically adapt to real-time market activity while maintaining accuracy during periods of indecision or consolidation.
How to Use Them?
Bullish Breakouts: Crossing into the bullish zone and breaking a previous resistance signals strong buyer momentum. Check for contraction in the bearish zone to confirm dominance.
Bearish Breakouts: Similarly, crossing into the bearish zone while breaking a support level confirms seller strength.
Momentum Confirmation: Ensure current momentum is leading the high-timeframe RSI for more reliable trade setups.
Zone Analysis : Expansion of a zone signals increased participation (e.g., more buyers or sellers entering), while contraction indicates reduced activity or that buyers and or sellers are closing their positions.
These zones provide actionable insights into breakout potential and market momentum, helping traders make informed decisions in volatile conditions.
High Timeframe RSI (HTF RSI)
What Is It?
The High Timeframe RSI gives you real-time higher timeframe RSI values directly on your lower timeframe chart. This means you don’t have to wait for the higher timeframe candle to close before seeing the RSI updates—it’s always live.
Why Is It Needed?
Normally, to see the RSI on a higher timeframe, you have to wait for that timeframe to close. This can be slow and lead to missed opportunities. The HTF RSI solves this by showing you the higher timeframe RSI values as soon as each lower timeframe candle closes, giving you faster insights and no delays.
How It works?
Rather than just using the standard RSI, the HTF RSI compares the momentum on your current timeframe with what it would be on the higher timeframe. It takes into account how many candles on your current chart fit into each higher timeframe candle. This makes sure that the higher timeframe RSI is accurate and reflects the real momentum, even when switching between timeframes.
How to Use It?
Trend Confirmation:
When the HTF RSI is above the midline, it shows a bullish trend on the higher timeframe, and if your current momentum is also bullish, it strengthens your trade setup.
When the HTF RSI is below the midline, it shows a bearish trend, and if your current momentum is bearish, it supports short trade setups.
If bearish momentum is above the HTF RSI, it suggests a local downtrend within a larger bullish trend.
Major Benefits
Custom Timeframes: You can use any higher timeframe you choose, not just the typical ones.
Real-Time Updates: Get higher timeframe RSI values with each candle, without delays.
Better Trading Insights: Align your trades with both lower and higher timeframe trends to make more informed decisions.
With HTF RSI, you get a clear view of higher timeframe trends in real time, so you can act faster and smarter on your trades.
Higher Time Frame Strat [QuantVue]The Higher Time Frame Strat Indicator is a tool that helps traders visualize and analyze price action from a higher timeframe (HTF) on their current chart. It applies the Strat method, a trading strategy focused on identifying key price action setups by observing how current price bars relate to previous ones. This helps in understanding the market's structure and determining potential trading opportunities based on higher timeframe data.
Key Concepts:
Strat Basics:
Type 1 Bar (Inside Bar): The current bar's high is lower than the previous bar's high, and its low is higher than the previous bar's low. This signifies a consolidation, or indecision, as the price is contained within the previous bar's range.
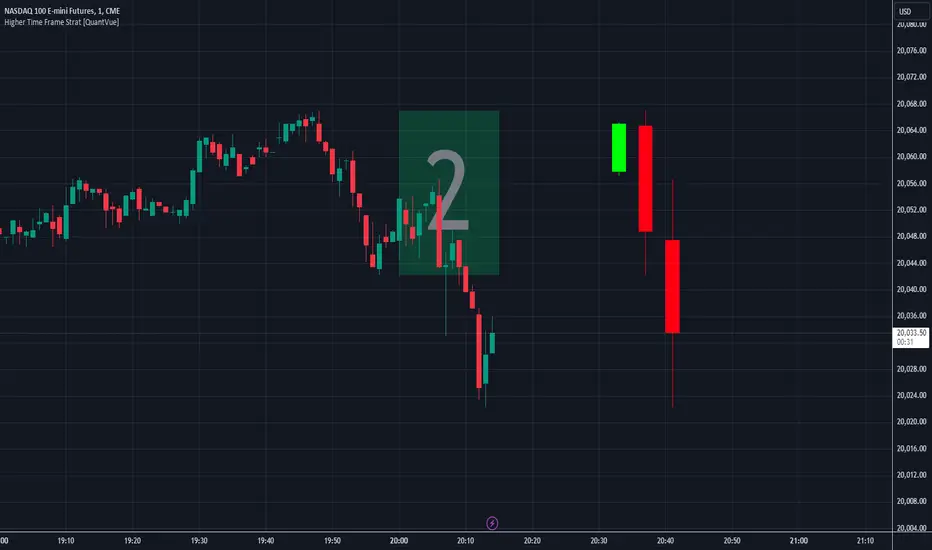
Type 2 Bar (Directional Bar): The current bar either breaks above the previous bar's high (bullish) or stays above the previous bar's low (bearish), indicating a continuation in the price direction.
Type 3 Bar (Outside Bar): The current bar breaks both above the previous bar's high and below the previous bar's low, showing volatility and a potential reversal.
Higher Timeframe Visualization:
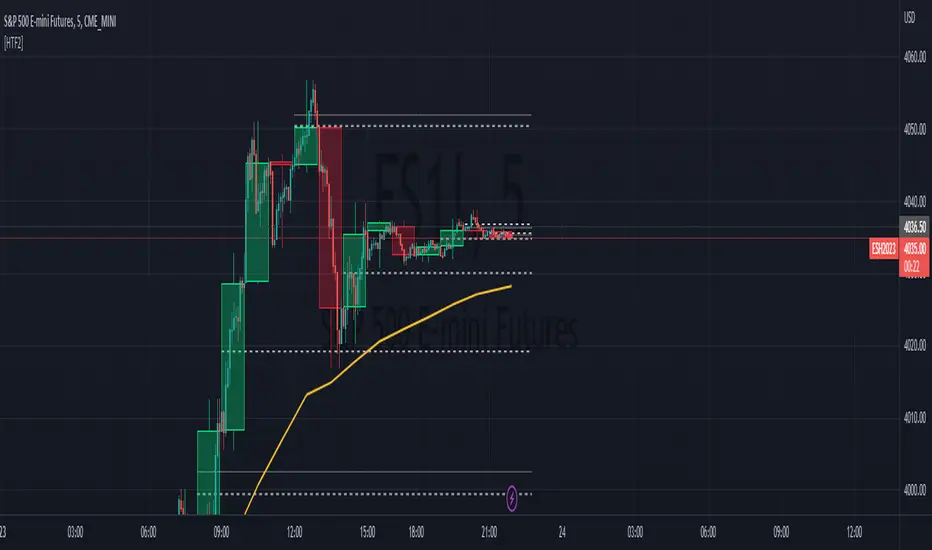
The indicator uses a user-defined higher timeframe (default: 1 hour) and plots the last three higher timeframe candles on the current chart.
Strat Classification:
When a new higher timeframe candle forms, the indicator draws a semi-transparent box around the candle's range (high to low), along with the Strat type label. This provides a visual cue to the trader about the structure of the newly formed candle and how it fits into the overall market movement.
The script classifies each higher timeframe candle as one of the Strat types (1, 2, or 3). Based on the relationship between the current candle and the previous candle's high/low, it assigns a label ("1", "2", or "3"), helping traders quickly identify the price action setup on the higher timeframe.
How to Use the Indicator:
Trend Continuation: Look for Type 2 bars, which indicate a continuation in the current trend. For example, a Type 2 up suggests the price is breaking above the previous high, potentially signaling further upward movement.
Reversals: Type 3 bars show increased volatility, where the price breaks both above and below the previous bar's range. This could indicate a reversal, so be prepared for a potential change in direction.
Consolidation: Inside bars (Type 1) signify a tightening range and can signal the beginning of a breakout once the price moves outside of the previous bar's high or low.
By combining these price action concepts with the visualization of higher timeframe data, traders can potentially get earlier entry and exits as a higher timeframe set up forms.
Wall Street Cheat Sheet IndicatorThe Wall Street Cheat Sheet Indicator is a unique tool designed to help traders identify the psychological stages of the market cycle based on the well-known Wall Street Cheat Sheet. This indicator integrates moving averages and RSI to dynamically label market stages, providing clear visual cues on the chart.
Key Features:
Dynamic Stage Identification: The indicator automatically detects and labels market stages such as Disbelief, Hope, Optimism, Belief, Thrill, Euphoria, Complacency, Anxiety, Denial, Panic, Capitulation, Anger, and Depression. These stages are derived from the emotional phases of market participants, helping traders anticipate market movements.
Technical Indicators: The script uses two key technical indicators:
200-day Simple Moving Average (SMA): Helps identify long-term market trends.
50-day Simple Moving Average (SMA): Aids in recognizing medium-term trends.
Relative Strength Index (RSI): Assesses the momentum and potential reversal points based on overbought and oversold conditions.
Clear Visual Labels: The current market stage is displayed directly on the chart, making it easy to spot trends and potential turning points.
Usefulness:
This indicator is not just a simple mashup of existing tools. It uniquely combines the concept of market psychology with practical technical analysis tools (moving averages and RSI). By labeling the psychological stages of the market cycle, it provides traders with a deeper understanding of market sentiment and potential future movements.
How It Works:
Disbelief: Detected when the price is below the 200-day SMA and RSI is in the oversold territory, indicating a potential bottom.
Hope: Triggered when the price crosses above the 50-day SMA, with RSI starting to rise but still below 50, suggesting an early uptrend.
Optimism: Occurs when the price is above the 50-day SMA and RSI is between 50 and 70, indicating a strengthening trend.
Belief: When the price is well above the 50-day SMA and RSI is between 70 and 80, showing strong bullish momentum.
Thrill and Euphoria: Identified when RSI exceeds 80, indicating overbought conditions and potential for a peak.
Complacency to Depression: These stages are identified based on price corrections and drops relative to moving averages and declining RSI values.
Best Practices:
High-Time Frame Focus: This indicator works best on high-time frame charts, specifically the 1-week Bitcoin (BTCUSDT) chart. The longer time frame provides a clearer picture of the overall market cycle and reduces noise.
Trend Confirmation: Use in conjunction with other technical analysis tools such as trendlines, Fibonacci retracement levels, and support/resistance zones for more robust trading strategies.
How to Use:
Add the Indicator: Apply the Wall Street Cheat Sheet Indicator to your TradingView chart.
Analyze Market Stages: Observe the dynamic labels indicating the current stage of the market cycle.
Make Informed Decisions: Use the insights from the indicator to time your entries and exits, aligning your trades with the market sentiment.
This indicator is a valuable tool for traders looking to understand market psychology and make informed trading decisions based on the stages of the market cycle.

HTF Volume by Prosum SolutionsOverview of Features
This indicator was inspired by the work of "LonesomeTheBlue" in the script called "Volume Multi Time Frame" . This script will provide a highly customizable interface to specify the higher timeframe period for the volume with the ability to link to the "HTF Candles by Prosum Solutions" indicator using the "HTF Setting Code" data point, as well as adjusting various styling options for the volume bar color fill and border.
Usage Information
The indicator can be applied to any chart at any time frame. When the "Chart" option is chosen for the "Timeframe" field, the indicator will attempt to find a higher timeframe resolution to ensure the volume bars are drawn. The indicator will simply accumulate the volume value for each candlestick bar and reset when the new high timeframe period has started. The color of the volume bars are relative to the higher timeframe setting so that you can visually interpret when the volume in a rising or falling state relative to the higher timeframe price action.
If you choose to add the "HTF Candles by Prosum Solutions" indicator, you can link this indicator to it by choosing the "HTF Candles" option for the "Timeframe Source" field and then choosing the "HTF Setting Code" option for the "HTF Candles" field. At this point, whenever you adjust the high timeframe setting in the "HTF Candles by Prosum Solutions" indicator, this indicator will automatically adjust the timeframe to match it, thereby reducing the steps you need to take to keep the two indicators in sync.
Enjoy! 👍

HTF Tool 2HTF Tool 2: Because the previous version was removed for being too powerful.
HTF Tool allows Users to display Higher Timeframe(HTF) Candles on their Chart with retracement lines drawn from the (High/Low) range of the HTF candle, as well as a live HTF MA.
This indicator perfectly handles Requested data to display a non-lagging HTF Moving Average(MA) by bridging a solid historical data stream with the live data stream.
This is done by offsetting plot data backwards to the middle of the last HTF candle, and then drawing a line from the last candle middle, to the live candle middle.
I have manipulated the data display to give the appearance that it consists of only 1 plot line, Whereas in reality, The HTF MA consists of 3 different processes:
- 1 historical plot value, to display the (correct) historical EMA with the same plot points you would see on the HTF chart from the same ema.
- 1 live line, re-drawn at every tick to mimic the way plot values move around while the bar is live.
- 1 live plot value, that is only displayed as a number on the status line and price scale to make it look like these are the outputs from the constantly redrawing line.
Because of this, This indicator displays the exact same way you would see this data on the requested timeframe's chart .
Note: You will see 2 values on the status line, these are the Historic MA, and Live MA values (Left, Right).
When hovering over historic values, a Historic MA value will only display in the middle of the HTF bars (same bar as the HTF wick)
This indicator include:
- HTF Candles, Drawn in the Traditional Candlestick Fashion.
- A User Adjustable HTF EMA / SMA , This Moving Average is accurate the the display you would see on a HTF chart.
- User Adjustable Retracement lines, up to 3 levels. These levels dynamically delete when price crosses them.
- Adjustable Display Range to display more or less HTF candles.
- Toggleable "Safe Mode" to keep the indicator display looking clean at all times.*
All Colors are Customizable to fit your layout style (Candle, Levels, HTF MA)
*Safe mode checks that your current chart's timeframe cleanly multiplies into your requested timeframe an odd number of times. This keeps the HTF candle wicks perfectly centered, and keeps the candle body width perfectly consistent.
If you choose to turn safe mode off here are some things to consider:
All Vertical data is consistent with the HTF requested , ONLY the horizontal alignment of the indicator will be thrown off.
When on low timeframes requesting other relatively low timeframes these issues are extremely more apparent than when requesting substantially larger timeframes.
Example: Safe Mode will likely need to be turned off for any 4h chart request, but as seen in the following image, the bars still look very normal.
Note: If you ONLY want to see the Levels and Moving Average... You ARE capable of requesting the current chart's timeframe. If you do this, the indicator will stop drawing the HTF candles, since your chart already shows that timeframe's candles.
Enjoy!
Bull Bear Power VoidThere are a million oscillators out there based on volume. My biggest problem with them is that they simply tell you whether you have volume to the upside or volume to the down side. it's kind of tricks you with the lack of information into thinking you have a change in your trend or that you're going to be able to break out of a range across a moving average or through some trend line or support and resistance.
However many of these Oscillators are failing because they lacked to tell you one key thing. they tell you that you have volume but they never tell you if it's enough volume.
Even a popular indicator like the MACD can have its MACD Line crossing upwards over the signal, telling you that you have an uptrend but again it's still failing to give you the results of how much volume you have and is it enough volume in that crossover. It boils down to the one key fact that with out volume there is no momentum. This should be able to make trading crossovers a lot easier.
So in today's video I'm going to show you the newest addition to the trading View Community Scripts and it is called,
"The Bull Bear Void Volume Oscillator"
From my own testing, this oscillator can predict weather the next candle will get you the move you need or not.
In the markets you cannot have anything good without volume. after you have volume you have momentum. you cannot have momentum without volume and this is the key thing that causes people to fail when they look for breakouts, trend reversals, or if they're wondering whether this move is a fake out.
This indicator is based on the study volume spread analysis or VSA.
This indicator is designed to be paired perfectly with the Heiken Ashi Algo oscillator.
www.INSERTA-LINK-HERE.com
This indicator is strictly to be used as a confirmation indicator and not to be used by itself to tell you when to buy or sell.
what are its parts.
The void
is a bullish and bearish Cloud that appear extending from the center of words and the center down words. This is the average range of volume. anything that appears to close inside of this void is usually a ranging volume and it is not enough to break the trend or break out.
The MACD and MACD Signal Line
Just like using the macd these two lines indicate whether the trend is moving up for the trend is moving down
The Colored Columns
RED Column - Indicates volume movie downward
Light Red - indicates volume is pulling back from a downward move
Green - indicates volume is moving upwards
Light Green - indicates volume is moving down from an outboard move
Rules for a SELL CONFIRMATION TRADE
The macd line must be underneath the signal line and the macd line must be below the midline.
A bullish column must appear below the midline and it must extend outside of the red void.
if you are using the heikin-ashi Aldo oscillator you must also have a red heiken Ashi candle close below -10.
To do a by trade you simply reverse the rules.

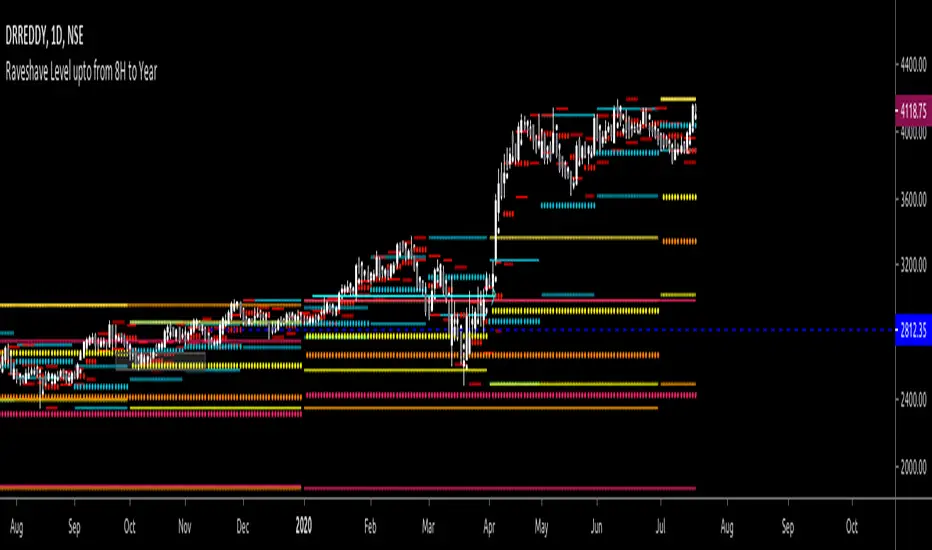
Support Resistance Channels/Zones Multi Time FrameHello All,
For long time I have been getting a lot of requests for Support/Resistance Multi Time Frame script. Here ' Support Resistance Channels/Zones Multi Time Frame ' is in your service.
This script works if the Higher Time Frame you set is higher than the chart time frame. so the time frame in the options should be higher than the chart time frame.
The script checks total bars and highest/lowest in visible part of the chart and shows all S/R zones that fits according the highest/lowest in visible part. you can see screenshots below if it didn't make sense or if you didn't understand
Let see the options:
Higher Time Frame : the time frame that will be used to get Support/Resistance zones, should be higher than chart time frame
Pivot Period : is the number to find the Pivot Points on Higher time frame, these pivot points are used while calculating the S/R zones
Loopback Period : is the number of total bars on higher time frame which is used while finding pivot points
Maximum Channel Width % : is the percent for maximum width for each channel
Minimum Strength : each zone should contain at least a 1 or more pivot points, you set it here. (Open/High/Low/Close also are considered while calculating the strength)
Maximum Number of S/R : the number of maximum Support/Resistance zones. there can be less S/Rs than this number if it can not find enough S/Rs
Show S/R that fits the Chart : because of we use higher time frame, you should enable this option then the script shows only S/Rs that fits the current chart. if you disable this option, all S/R zones are shown and it may shrink the chart. also you may not see any S/R zone if you don't choose the higher time frame wisely ;)
Show S/R channels in a table : if you enable this option (by default it's enabled) then lower/upper bands of all S/R zones shown in a table ( even if it doesn't fit the chart ). you can change its location. zones are sorted according to their strengths. first one is the strongest.
and the other options is about colors and transparency.
Screenshots before and after zoom-out:
after zoom-out number of visible bars and highest/lowest change and it shows more S/R zones that fits the current chart!
if you see Support Resistance zone like below then you should decrease ' Maximum Channel Width ' or you should set higher time frame better:
You can change colors and transparency:
You can change Table location:
Alerts added :)
P.S. I haven't tested it so much, if you see any issue please drop a comment or send me message
Enjoy!

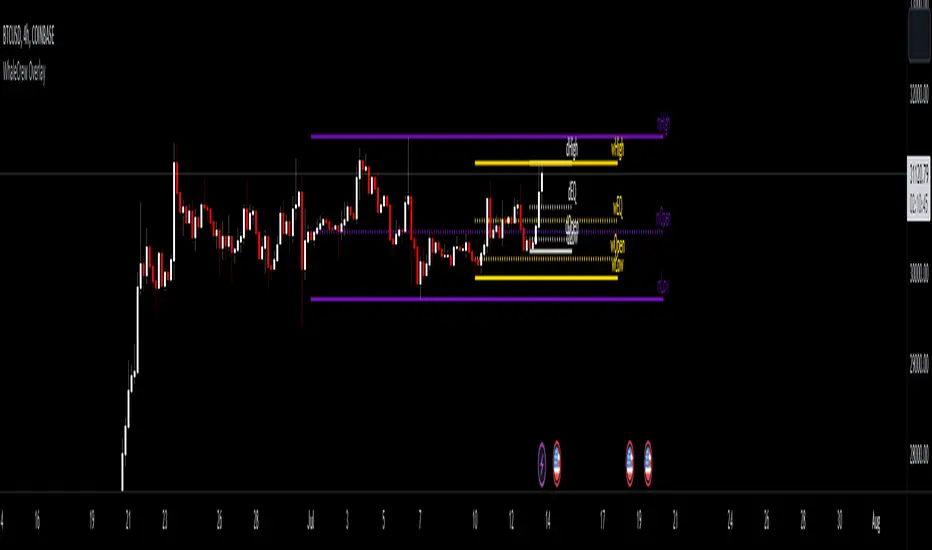
WhaleCrew OverlayThis overlay is all about looking for confluence, and this is achieved by combining the power of Support/Resistance trading and Moving Averages.
Features
Support and Resistance
Trend Visualization
Fib Ribbons
Moving Average System
Intraday Tools
Support and Resistance
This involves Daily Levels (High, Low, Open, and Range Center), Weekly Levels (Open, High and Low), as well as the Monthly/Quarterly/Yearly Open.
Automatically having these support/resistance levels on your chart no matter what timeframe you're on is a big advantage, they can be used as confluence levels for potential trades.
Trend Visualization
Our trend component visualizes the current trend using two moving averages. There are multiple inbuilt modes that should be picked based on your trading style.
Use this indicator as confluence and don't rely solely on it.
Fib Ribbons
Our Fib Ribbons are a bundle of multiple EMAs with custom timeframe built-in. Unlike EMA Ribbons our EMA lengths are only based on Fibonacci Numbers.
The numbers of EMAs is four by default (fastest: 8, slowest: 34), but EMA 5 & 55 can be manually enabled.
The ribbons will act as support in an uptrend and as resistance in a downtrend. A ribbon cross often indicates a potential trend change.
Moving Average System
Build a system around 2 custom moving averages for more confluence (supports custom timeframes and many moving average types).
The moving averages can be used for generating signals whenever they cross, or as possible support/resistance.
Intraday Tools
We also support intraday tools like VWAP (Volume-Weighted-Average Price) and TWAP (Time-Weighted-Average-Price).
They differ from normal moving averages by taking volume/time into account and will act as potential support/resistance (commonly used by big market participants).
Usage
You should look for price levels where moving averages and support/resistance are lined up for confluence.
Closely monitor price action near important price levels for potential trade setups:
Consolidation right below resistance is considered bullish
Consolidation right at support might be considered bearish
Watch out for rejections and retests (also counts for moving averages)
Access to this indicator can be obtained through our website.
HTF Candles & PivotsThis indicator displays HTF candles and pivot points.
The candles are displayed in a box and you can select Open-Close, High-Low or both.
You can show all of the past, or just "today only" or "previous day only".
You can also shift one previous candle to the current one.
The pivot point is the normal one.
There is an option to display CPR (Central pivot range).
Example: Shift previous to current

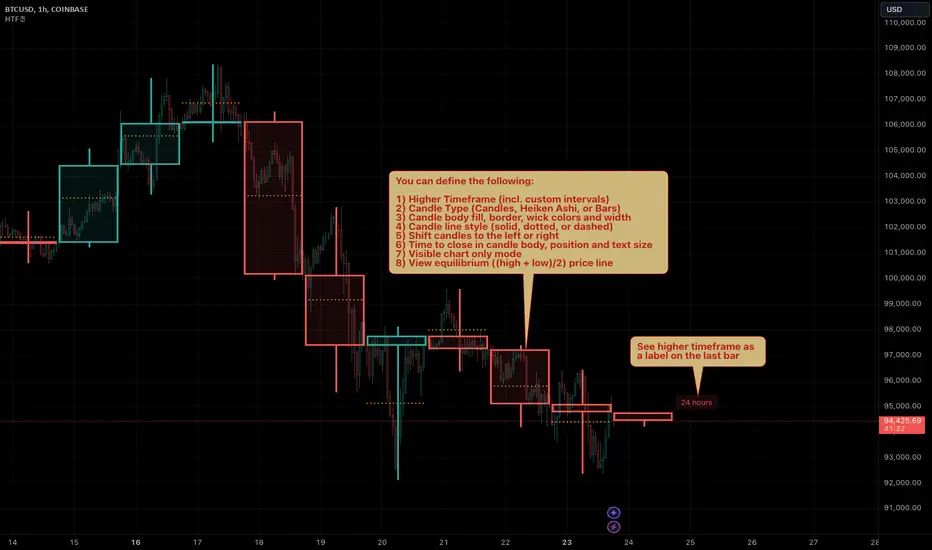
HTF Candles by Prosum SolutionsOverview of Features
This indicator was inspired by the work of "informanerd" in the script called "HTF Candles" as well as the built-in script called "Multi-Time Period Charts" by TradingView. The script will provide a highly customizable interface to specify the higher timeframe resolution for the candlesticks, the type of candle, as well as various styling options for the body, borders and wicks.
Usage Information
The indicator can be applied to any chart at any time frame, but resolutions less than 1 minute may demonstrate gaps between bars and the candles may not render properly.
When the "Same as chart" option is chosen for the "Resolution" field, the indicator will attempt to find a higher timeframe resolution to ensure the candlesticks are drawn.
Enjoy! 👍
All past LevelsContains all past levels that we need
1. Previous Monthly High
2. Previous Monthly Low
3. Previous Weekly High
4. Previous Weekly Low
5. Previous Daily High
6. Previous Daily Low
7. Previous Monthly Range Average (PMH+PML)/2
8. Previous WeeklyRange Average (PWH+PWL)/2
9. Previous Daily Range Average (PDH+PDL)/2
10. Monthly Open
11. Weekly Open
12. Daily Open
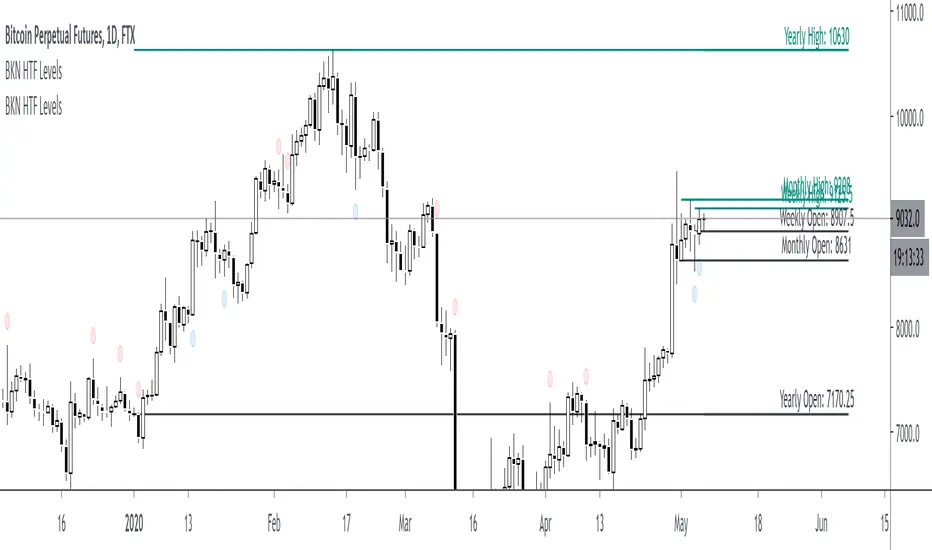
BKN High Timeframe LevelsThis indicator is developed to mark out yearly, monthly, weekly and daily levels. Allows you to select if you want to plot the open, high or low. Don't really recommend using the indicator for closes as it looks ahead to the current bar so it will just show the current price as the close.
High timeframe opens specifically are great levels to watch for reactions. By request, we've added the ability to plot highs or lows in addition to the opens. If you'd like to see opens as well as highs or lows, you would add the indicator to your chart twice and you have the option to change the color of the lines on the secondary indicator.