Harmonik PRZ MalibuThe Harmonik PRZ Malibu indicator includes 6 main features:
1. Harmonic Pattern Detection
2. PRZ (Potential Reversal Zone) Visualization
3. RSI Confluence System
4. Time Ratio Analysis
5. Quality Scoring
6. Automatic TP/SL Management
━━━━━━━━━━━━━━━━━━━━━━━━━━━━━━━━━━━━━━━━━━━━━━━━━━━━━━━━━━━━━━━━━━━
HARMONIC PATTERN DETECTION:
◆ What are Harmonic Patterns?
Harmonic patterns are geometric price structures that use Fibonacci ratios to identify potential reversal points. They represent natural market cycles where institutional buying and selling creates predictable XABCD formations.
◆ How does the indicator detect patterns?
The indicator uses a multi-layer ZigZag analysis system with 4 independent depth levels: Micro, Small, Medium, and Macro. Each layer scans for valid swing highs and lows simultaneously, ensuring no pattern is missed regardless of market volatility or timeframe.
When all required swing points align with harmonic geometry rules, the indicator confirms a valid pattern. Supported patterns include Gartley, Bat, Butterfly, Shark, Cypher, and AB=CD variations.
━━━━━━━━━━━━━━━━━━━━━━━━━━━━━━━━━━━━━━━━━━━━━━━━━━━━━━━━━━━━━━━━━━━
PRZ (POTENTIAL REVERSAL ZONE):
◆ What is PRZ?
The PRZ is not a single price level but a cluster zone where multiple Fibonacci projections converge. This confluence creates a high-probability reversal area.
◆ How is PRZ calculated?
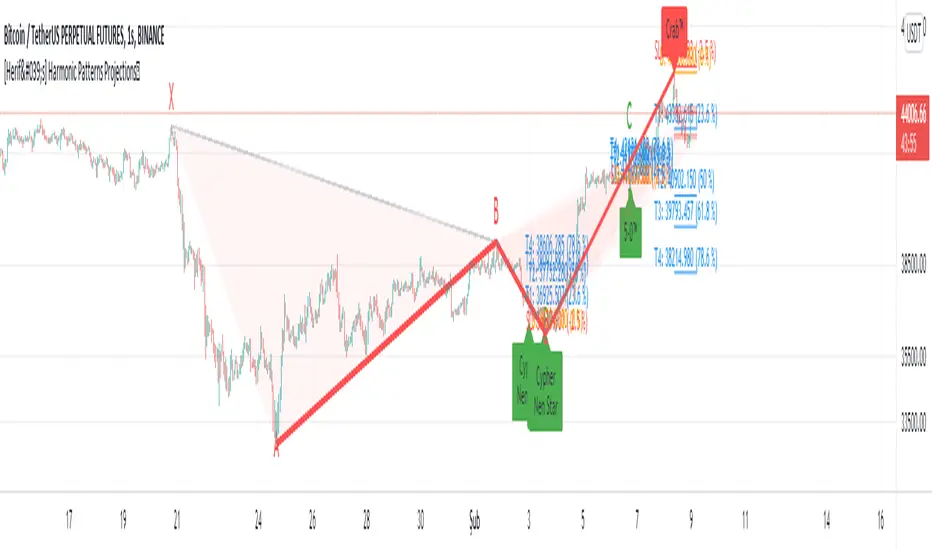
The indicator calculates PRZ using three independent projections:
• BC Projection - Where the CD leg is expected to complete
• AB=CD Completion - Symmetry point of the pattern
• BA Retracement Extension - Additional confirmation level
When these three levels cluster tightly, the pattern receives a higher quality score.
━━━━━━━━━━━━━━━━━━━━━━━━━━━━━━━━━━━━━━━━━━━━━━━━━━━━━━━━━━━━━━━━━━━
RSI CONFLUENCE SYSTEM:
◆ Why use RSI with harmonic patterns?
Price reaching the PRZ alone is not enough. The RSI Confluence System adds momentum confirmation by checking if the market is actually oversold (for bullish patterns) or overbought (for bearish patterns) at the D point.
◆ What is RSI Divergence Check?
For extension patterns like Butterfly, the indicator also checks for RSI divergence - when price makes a new extreme but RSI does not. This divergence signals exhaustion and increases reversal probability.
The RSI value at entry is displayed on the pattern label with a ✓ (confirmed) or ✗ (not confirmed) symbol.
━━━━━━━━━━━━━━━━━━━━━━━━━━━━━━━━━━━━━━━━━━━━━━━━━━━━━━━━━━━━━━━━━━━
TIME RATIO ANALYSIS:
◆ What is Time Ratio?
Harmonic patterns are not only about price - TIME matters equally. The Time Ratio measures how long the CD leg takes compared to the AB leg.
◆ Why is it important?
A pattern where CD completes too quickly or takes too long compared to AB has lower reliability. The ideal time ratio falls within natural Fibonacci proportions, creating a balanced and symmetrical pattern in both price AND time.
The indicator displays the Time Ratio on each pattern label and can filter out patterns with abnormal timing.
━━━━━━━━━━━━━━━━━━━━━━━━━━━━━━━━━━━━━━━━━━━━━━━━━━━━━━━━━━━━━━━━━━━
QUALITY SCORING SYSTEM:
◆ How are patterns graded?
Each pattern receives a quality score from A+ to C based on multiple factors:
• PRZ Tightness - How closely the Fibonacci levels cluster
• RSI Confirmation - Whether momentum aligns with direction
• Time Ratio Balance - Whether timing is proportional
◆ How to use quality scores?
• A+ patterns: Highest probability setups - suitable for larger position sizes
• A patterns: Strong setups - standard position sizes
• B patterns: Moderate setups - reduced position sizes or skip
• C patterns: Weak setups - consider skipping or paper trading only
The statistics table tracks Win/Loss rate separately for each quality grade.
━━━━━━━━━━━━━━━━━━━━━━━━━━━━━━━━━━━━━━━━━━━━━━━━━━━━━━━━━━━━━━━━━━━
AUTOMATIC TP/SL MANAGEMENT:
◆ Where are TP levels placed?
Take-profit levels are calculated using CD leg retracement. The indicator displays TP1 and TP2 levels with clear price labels.
◆ Where is Stop-Loss placed?
Stop-loss placement is pattern-specific. For internal patterns (Gartley, Bat), SL is placed beyond the X point. For extension patterns (Butterfly, Shark), SL accounts for the extended structure.
All levels are drawn automatically with adjustable visual settings.
━━━━━━━━━━━━━━━━━━━━━━━━━━━━━━━━━━━━━━━━━━━━━━━━━━━━━━━━━━━━━━━━━━━
REAL-TIME STATISTICS:
The indicator includes a built-in statistics table that tracks:
• Total patterns detected per type
• Win/Loss count (TP1 hit vs SL hit)
• Win rate percentage
• Filter by quality score
This allows you to see actual performance directly on your chart.
━━━━━━━━━━━━━━━━━━━━━━━━━━━━━━━━━━━━━━━━━━━━━━━━━━━━━━━━━━━━━━━━━━━
📱 7-DAY FREE TRIAL: Contact via Telegram @lmaLibul
Send your TradingView username to get access.
Wskaźnik Pine Script®