My-Indicator - Global Liquidity & Money Supply M2 + Time OffsetThis script is designed to visualize a global liquidity and money supply index by combining data from various regions and, optionally, central bank activity. Visualizing this data on a chart allows you to see how central banks are intervening in the financial system and how the total amount of money in the economy is changing. Let’s take a look at how it works:
Central Bank Liquidity
Shows the actions of central banks (e.g. FED, ECB) providing short-term cash to commercial banks. If you see spikes or a steady increase in these indicators, it may suggest that liquidity is being increased through intervention, which often stimulates the market.
Money Supply
M2 money supply is a monetary aggregate that includes M1 (cash and current deposits) plus savings deposits, small term deposits, and other financial instruments that, while not as liquid as M1, can be quickly converted into cash. As a result, M2 provides a broader picture of the available money in the economy, which is useful for analyzing market conditions and potential economic trends.
How does it help investors?
It allows you to quickly see when central banks are injecting additional liquidity, which could signal higher prices.
It allows you to see trends in the money supply, which informs potential changes in inflation and the economic cycle.
Combining both sets of data provides a more complete picture – both in the short and long term – which makes it easier to predict upcoming price movements.
This allows investors to better respond to changes in central bank policy and broader monetary trends, increasing their chances of making better investment decisions.
Data Collection
The script retrieves money supply data for key markets such as the USA (USM2), Europe (EUM2), China (CNM2), and Japan (JPM2). It also offers additional money supply series for other markets—like Canada (CAM2), Great Britain (GBM2), Russia (RUM2), Brazil (BRM2), Mexico (MXM2), and New Zealand (NZM2)—with extra options (e.g., Australia, India, Korea, Indonesia, Malaysia, Sweden) disabled by default. Moreover, you can enable data for central bank liquidity (such as FED, RRP, TGA, ECB, PBC, BOJ, and other central banks), which are also disabled by default.
Index Calculation
The indicator calculates the index by adding together all the enabled money supply series (and the central bank data if activated) and then scales the sum by dividing it by 1,000,000,000,000 (one trillion). This scaling makes the resulting values more manageable and easier to read on the chart.
Time Offset Feature
A key feature of the script is the time offset. With the input parameter "Time Offset (days)", the user can shift the plotted index line by a specific number of days. The script converts the given offset in days into a number of bars based on the current chart's timeframe. This allows you to adjust for the delay between liquidity changes and their effect on asset prices.
Overall, the indicator plots a line on your chart representing the global liquidity and money supply index, allowing you to visually monitor trends and better understand how liquidity and central bank actions may influence market movements.
What makes this script different from others?
Every supported market—both major regions (USA, Eurozone, China, Japan, etc.) and additional ones—is available. You can toggle each series on or off, so you can view only Money Supply data, only Central Bank Liquidity, or any custom combination.
Separated Data Groups. Inputs are organized into clear groups (“Money Supply”, “Other Money Supply”, “Central Bank Liquidity”), making it easy to focus on just the data you need without clutter.
True Day‑Based Offset. This script converts your chosen “Time Offset (days)” into actual days regardless of timeframe. Whether you’re on a 5‑minute or daily chart, the index is always shifted by exactly the number of days you specify.
Globaleconomy

M2 Global Liquidity Index [Extended + Offset]M2 Global Liquidity Index
This indicator visualizes global M2 money supply, weighted in USD, based on major economic regions.
Features:
Standard Mode: Includes M2 data from the USA, China, Eurozone, Japan, and the UK.
Extended Mode: Adds Switzerland, Canada, India, Russia, Brazil, South Korea, Mexico, and South Africa.
Offset Function: Adjustable time lag (78 or 108 days) to analyze the delayed impact of liquidity on financial markets.
Use Case:
Designed to help identify global liquidity cycles and assess potential turning points in financial markets. Rising global liquidity generally supports risk assets like equities and crypto, while declining liquidity can put downward pressure on these markets.
Technical Details:
Non-USD M2 values are converted using real-time FX rates.
All values are displayed in trillions of USD (Tn).
Note:
Not all countries release M2 data in real-time or at the same frequency. Minor delays and discrepancies may occur.
Example:

Blockchain Fundamentals: Global LiquidityGlobal Liquidity Indicator Overview
This indicator provides a comprehensive technical analysis of liquidity trends by deriving a Global Liquidity metric from multiple data sources. It applies a suite of technical indicators directly on this liquidity measure, rather than on price data. When this metric is expanding Bitcoin and crypto tends to bullish conditions.
Features:
1. Global Liquidity Calculation
Data Integration: Combines multiple market data sources using a ratio-based formula to produce a unique liquidity measure.
Custom Metric: This liquidity metric serves as the foundational input for further technical analysis.
2. Timeframe Customization
User-Selected Period: Users can select the data timeframe (default is 2 months) to ensure consistency and flexibility in analysis.
3. Additional Technical Indicators
RSI, Momentum, ROC, MACD, and Stochastic:
Each indicator is computed using the Global Liquidity series rather than price.
User-selectable toggles allow for enabling or disabling each individual indicator as desired.
4. Enhanced MACD Visualization
Dynamic Histogram Coloring:
The MACD histogram color adjusts dynamically: brighter hues indicate rising histogram values while darker hues indicate falling values.
When the histogram is above zero, green is used; when below zero, red is applied, offering immediate visual insight into momentum shifts.
Conclusion
This indicator is an enlightening tool for understanding liquidity dynamics, aiding in macroeconomic analysis and investment decision-making by highlighting shifts in liquidity conditions and market momentum.

Relevant World GDP GroupedLooking at a basket of countries total GDP for comparing size of economy. Makes it easy to select your own groupings of countries for comparison. A country's GDP is the total of consumer spending (C) plus business investment (I) and government spending (G), plus net exports, which is total exports minus total imports (X – M). Alliances visualized was the original idea but wasn't quite sure for a lot of other countries where they stand so it is what it is; feel free to improve.

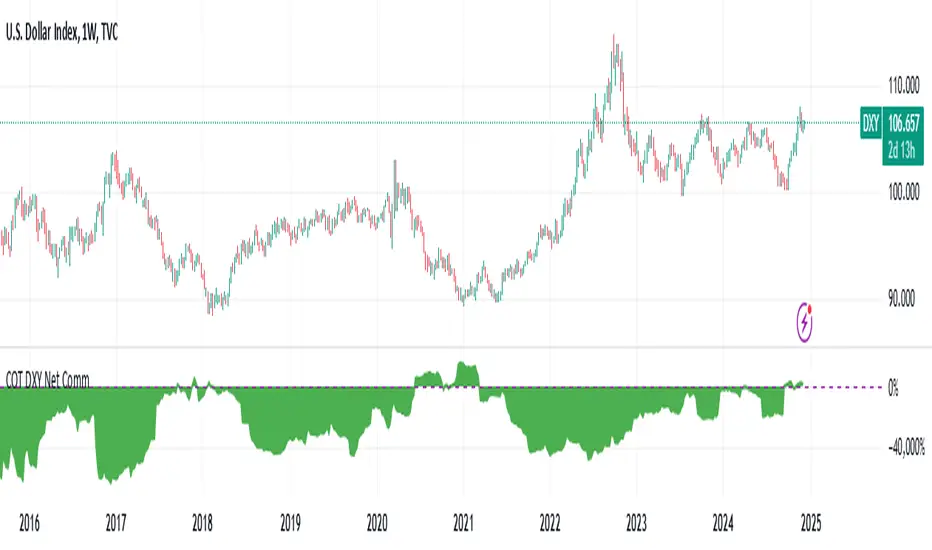
DXY COT Commercial Net PositionsThis script was created due to the lack of position of US Dollar Index Futures (DXY).
It is designed to perform a much more liquid and inclusive position analysis.
As the exponential ratios do not mean anything to positions, weights are used as multipliers instead of exponential functions.
Swedish Krona (SEK) Futures are not directly quoted in Quandl, therefore weighted in Euro / dollar parity.
By perceiving these positions as inverse correlations, you can also identify where the world economy is doing well.
COT Commercial Net Positions are calculated as (Short - Long) because of Commercials act according to the reverse of the market.
In this way, you can follow up normally instead of reverse correlation.
Because except in extreme cases, in which case capitals usually shift to Gold.
This is not the case, since there is no capital inflow to other currencies, it is not a strong sell position to the dollar index.
When there is a shift in bonds, we see the effect of the dollar in general.
I created for the Dollar Index in order not to deviate from the concept.
I wanted to share it with everyone as I thought that you have important clues about how investors take positions.
Modified currency weights :
Euro : % 61.8
Japanese Yen : % 13.6
British Pound : %11.9
Canadian Dollar : % 9.1
Swiss Franc : % 3.6
NOTE : You can use it for all instruments except crypto coins, especially US Dollar Index (DXY).
Since the COT data is taken, it will not repaint in 1 week (1W) timeframe.
The log can also be repaint according to the time of data publication.
It will repaint in lower time frames.
I hope it will help your analysis and your scripts,regards.