Land & SeaI have placed what is needed to know about the indicator at the start of the script. I also placed some hints on the chart.Wskaźnik Pine Script®od NYBKLYN55453
(13) Twists Swing/Day VS-478TWISTS adds a simple, but very effective twist to utilizing a multiple moving average crossover systems, enabling the effective and profitable trading of any stock, crypto or commodity. This enables trend, swing and day traders to dramatically improve their results over a similar, short-term simple, smoothed, exponential or weighted moving average crossover system. Four distinct Laguerre filters are applied to the price, one fast, one medium one long and one very long. The default Laguerre settings are: Short = 0; Medium = 0.33, Long = 0.55 XLong = 0.77. The correlation between the length of time and the Laguerre output is adjustable in the format > inputs pane for this indicator and are referred to as gamma. The first three lengths produce two major bands or ribbons. During up trends the top band is filled with green and during down trends this top band will be filled with red. Obviously these bands or ribbons are twisting or flipping positions when the direction of the price trends change. Trading indicator dots are produced during both phases. Green dots for uptrends and red dots during down trends. During consolidation phases it is possible that there will be no dots produced because of the rule set applied to these Entry/hold and Exit/short indicator dots. TWISTS is a triple moving average trading system using an advanced smoothing filter developed by John Ehlers. You can read about this dramatic advancement in moving averages in the following article: Time Warp -- Without Space Travel. You can find the link to this article on our site. Access this Genie indicator for your Tradingview account, through our web site. (Links Below) This will provide you with additional educational information and reference articles, videos, input and setting options and trading strategies this indicator excels in. Wskaźnik Pine Script®od StockSwinger25
Run.Trader.FuturesCFDThis is a Futures/CFD version of our RunTrader script that day trades the futures and commodity markets using trend analysis and confirmation of retraces to establish high probability entries in the general direction of the trend. The script can also be used for reversal purposes when the trigger candles on the chart are "not confirmed" The script generally produces 3-4 signals each day in the stock index futuresWskaźnik Pine Script®od bkforexZaktualizowano 28
Vwap and MvwapDay Trading - Made Easy Vwap (Volume weighted avergae price) is an excellent day trader's tool which comprises of two vital elements ( volume and Price). and a 50 period vwap based MVWAP provides a baseline for the day trading strategy.. Green bars = price above both vwap and Mvwap.. (for long positions) Red bars = price below both vwap and Mvwap .. (for short positons) Gray bars = price in between both vwaps * One has to apply this strategy along with momentum, major supports and resistances. * add other confirmations for better trades. Wskaźnik Pine Script®od Nifty_Trade_KingZaktualizowano 1111 1 K
Run.Trader by Boris SchlossbergThis is a short term scalping indicator from BK Forex that buys retraces in an uptrend and sells rallies in a downtrend at oversold/overbought points using 1 hour or 15-minute timeframes. It can be traded on all the majors including EURUSD GBPUSD and USDJPY using 10 points take-profit targets and it can be traded on higher volatility pairs such as GBPJPY and EURNZD with wider stops and about 20 pip targets. By making the entry process highly visual this script makes timing the day trades much easier.Wskaźnik Pine Script®od bkforexZaktualizowano 1154
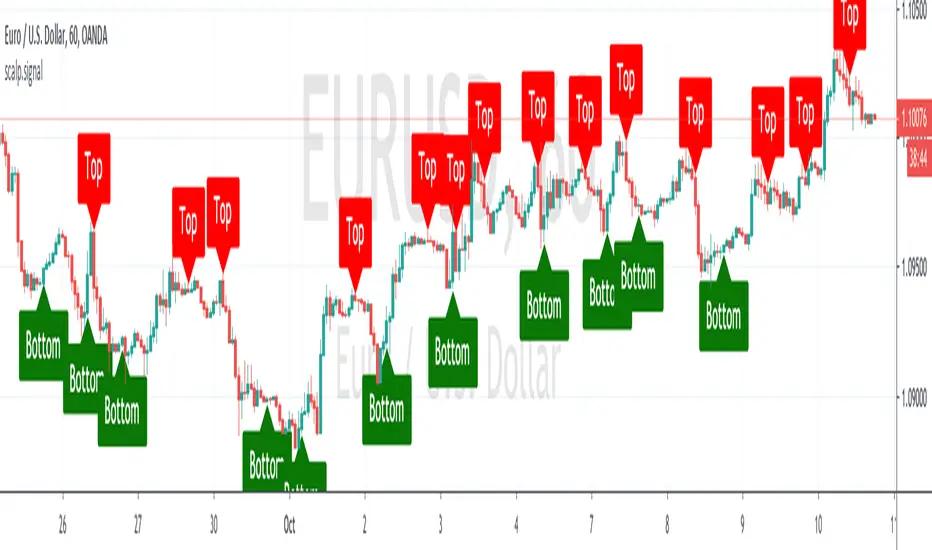
BK Scalp Signal Trader by Boris SchlossbergThis is part 2 of 2 part system of indicators that allows traders to scalp tops and bottoms on intra-day chartsWskaźnik Pine Script®od bkforexZaktualizowano 4496
EMA-50H-50L-15CThank you @rachitpjain for sharing this simple yet effective strategy on open platform( Twitter ). For detail reading about strategy refer tweets of @rachitpjain where he timely posts charts using this strategy. ************************************************************************************************** **EMA-50H-50L-15C Script V1 ************************************************************************************************** This script will be helpful to identify trade based on strategy shared by @rachitpjain. Here are salient features of this script : -Apply Three EMAs using single indicator (50H-50L-15C) -When 15C crosses 50H - EMA Band will be filled with green color and only BUY trades should be taken -When 15C crosses 50L - EMA Band will be filled with red color and only SELL trades should be taken -When 15C in between 50H - 50L Band will be filled with white color and Trading should be avoided *Strategy works best in trending market using any instrument. Results will vary with change in time frame **Apply Basic TA like horizontal support, resistance, Higher High, Higher Low, Lower Low and Lower High price structure will increase success rate of this strategy *** Script is kept protected mode and don't ask for codes. (I think it's easy to code and by coding yourself, you will learn so many aspect of trading which you might missed)Wskaźnik Pine Script®od TheSpecialist_IN55162
MRK_OO7 Ichimoku & EMAThis trading strategy was based on @ToolFreeCrypto. I will continue to build and refine this trading method over time. To learn the trading strategy behind this please visit the YouTube page linked below. ~ Cheers ~ youtu.beWskaźnik Pine Script®od Bond_OO78
AVWAPVWAP is based on volume and price and represents the average a security has traded at. The script in for Dynamic Trader L3 members only.Wskaźnik Pine Script®od iJavidTrader2424260
5 Min Simple TrenderA script for day trading Pre-market volume a must. VISL had pre-market volume this day on some news Time frame: 5 minutes up and down triangles are deep pull backs: after a deep pullback, a shallow pull back usually follows. One can also buy or sell in ema zones after a deep pullback. look for tail wicks during those instances. Best of luck Wskaźnik Pine Script®od NYBKLYN33339
Very easy scalping indicator for non skilled traderThunderScalp is bundled indicator for scalping trader with simple usage and high winning rate. It works for any time frame. The indicators are: Humidity Pole Signal is Buy or Sell signal based on Humidity indicator or volume consolidation mapping Interactive Signal is Buy or Sell signal based on Chart Pattern analyzer Pivot Support and Resistance is candle support and resistance up to 3 layer for each Fractal Support and resistance is support and resistance based on fractal candles Scalping MA is moving average lines which best suite for scalping Wskaźnik Pine Script®od deSultanTMZaktualizowano 4444385
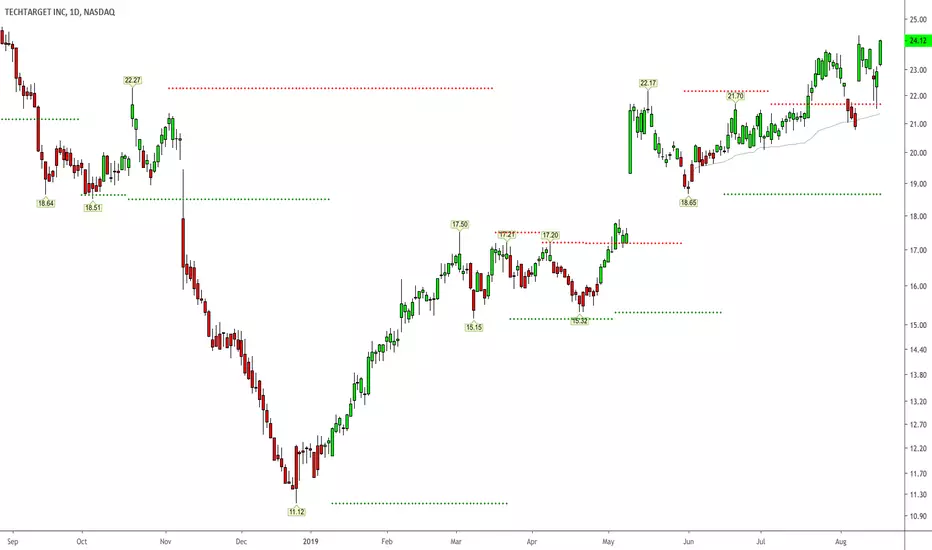
Trade Crusher: Swing and Day Trade IndicatorHow to use the indicator Add to favorites/apply to chart. The indicator can be used for both Swing trade and Intra-day trading. Swing trading: --Use with background colors --Input: 30 or 36 --Time frame: Daily or Weekly --Buy only when background is aqua --Sell only when background is red --Use with bars or candles (use candles without borders to avoid confusion). I suggest to just use bars. --Place buy orders above the 1st or 2nd blue bar after black bars. The background must be aqua. --Ignore yellow bars with aqua background. They are shake out bars at the beginning or a trend and warnings of reversal towards the end of trend. --Place sell orders bellow the 1st or 2nd yellow bar after black bars. The background must be red. --Ignore blue bars with red background (same as above). --Black bars are nothing: Pullbacks/Chop Day Trading: --DO NOT use background colors. Un-click. --Input: 10 --Time frame: 5 minutes --Use with bars or candles (use candles without borders to avoid confusion). I suggest to just use bars. --Place buy orders above the 1st or 2nd blue bar after black bars. --Place sell orders bellow the 1st or 2nd yellow bar after black bars. --Utilize some sort of scanner that can identify stocks with heavy pre-market volume (news, earnings, etc) *** Use stop losses however you normally do. Take profits however you normally do. I do not suggest using with other indicators as you may just paralyze your brain, however, if you find something that works, drop a comment. Best of luck Wskaźnik Pine Script®od NYBKLYN1212419
50EMA + 52RSI Day TradeBased on the great day trading video by @TrueCrypto28 ( www.youtube.com ), this indicator is perfect for trading on Binance. Have tweaked it so it is based on the 50EMA instead of SuperTrend. Default settings Long signal will be given when RSI is above 52 on the hourly chart to confirm a higher timeframe bullish bias as well as price closing above the 50EMA on the 5 minute chart. High + Low + Close / 3 has been used to smooth signals. Trade will be closed when price either closes below the 50EMA on the 5 minute or RSI drops above 52 on the hourly. Colour coded candles included for ease of trading. Green = all signals met to buy. Red = sell. Can change inputs to suite your style.Wskaźnik Pine Script®od btcjeanralphio145
Scalping Buy and Sell IndicatorThis is the final version of scalping Buy and Sell Indicator, which is a combination of few indicators such as EMAs, MAs, Rsi, and MACD. It best used on 1hr, 4 hrs and smaller TimeFrame for scalping on Bitmex and other exchanges. Buy symbol paints below the candle and sell symbol paints above the candle. Buy and Sell Alerts are added for this indicator. In the Alerts window, please choose the option "Once the candle closes" for best results. This is an invite-only script. Please message me or mail me for access. I am giving access to limited people only.Wskaźnik Pine Script®od vickyprudhviZaktualizowano 689689 1.1 K
SMA Serial for Crypto Day Trade Fixed Length SSCDTENCrypto market is different from other financial markets This indicator plot SMA series that fits Crypto, esp BTCUSD, XBTUSD Good for 5m - 1H time period for Day Trading. Specific SMA can be toggle on/off ---------- Française ---------- Le marché de la crypto-monnaie est différent des autres marchés financiers Cet indicateur série SMA qui correspond à Crypto-monnaie, en particulier BTCUSD, XBTUSD Bon pour 5m - 1H période pour le day trading. SMA spécifique peut être activé / désactivé ---------- 中文 ---------- 加密货币市场与其他金融市场不同 该指标绘制了适合加密货币的SMA系列,特别是BTCUSD,XBTUSD 适合5分钟 - 1小时 日间交易时间段。 特定SMA可以打开/关闭 ----------日本語---------- 暗号通貨市場は他の金融市場とは異なります この指標は、暗号通貨、特にBTCUSD、XBTUSD用のSMAシリーズを描画します。 5分から1時間の取引期間に適しています。 特定のSMAをオン/オフにすることができます ---------- Disclaim ---------- Before using this indicator, you acknowledge that you have read and accepted that this indicator is for research purpose only and it does NOT provide any investment nor trading signal. Users should make their own decisions, carefully assess risks and be responsible for their own investment and trading activities. Wskaźnik Pine Script®od go86863346
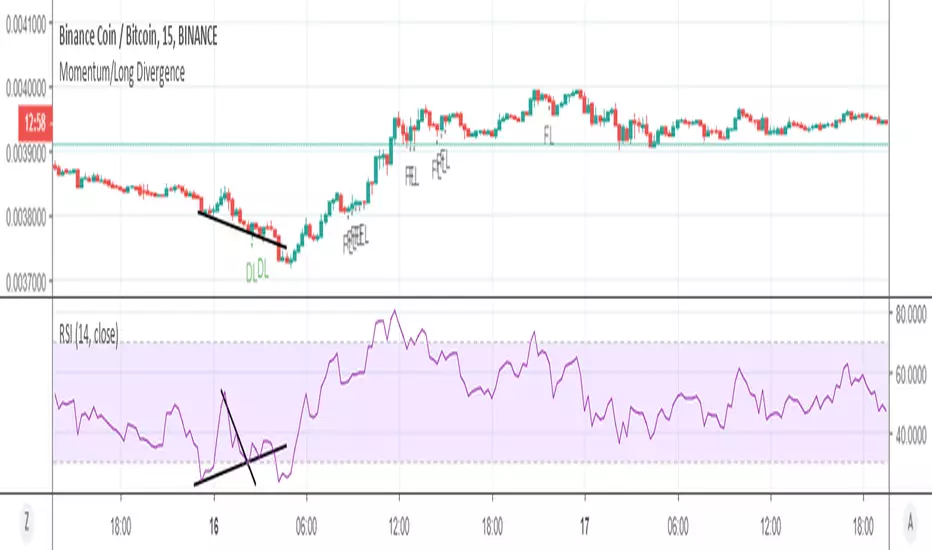
Momentum IndicatorUses momentum indicators and divergence strategy for tradesWskaźnik Pine Script®od manishchhetri21
ZenTrading MTFA Support & Resistance Day/Swing_BETAThis is a multiple timeframe analysis indicator for the day trading and swing trading timeframes (4HR downwards). The pink dots indicate support/resistance levels. Current levels as well as past levels are relevant. This is a beta testing version of the indicator, there may be some minor issues, so use at your own risk. If you have any questions feel free to contact meWskaźnik Pine Script®od DariusZen34
Cryptocurrency Profitability Rankings PRO Customisable ListA good cryptocurrency may multiply your earnings - with the same effort. This indicator helps crypto traders to find the trading securities that suit their profitability and volatility preference. This indicator calculates and generate a ranking of profitability from a user-defined list of cryptocurrencies, based on MACD cycles within user-defined time span. Multiple time frames: This indicator is designed for day trading, so suggested time frames are: 3m, 5m, 15m, 30m, 1H. Users can try other time frames (< 1D) if they find it useful. This is PRO version of Cryptocurrency Profitability Rankings with Popular List, developed based on Profitability Meter for Day Trading PRO PRO Version advanced functions: Customisable(User-Defined) Cryptocurrency List Option to select Open or Close price as start point for calculation. Flexible Time Span Type: Hours and Bars, besides Days More statistics options: Display price change(%) of latest rising/falling MACD cycle Free trial for two weeks: Please leave a comment asking for a trial, you should get access within 48 hours. In case it doesn't work, please message the author. Format Configuration: Profitability Threshold: a percentage of price movement within a MACD cycle that a user thinks can be used to define profitability, defval: 0.8%. Select open or close as start point: which can affect the results greatly, as difference between open and close can be significant, especially for big time interval. Statistics Options timeSpan: time span for statistics timeSpanType: time span type for statistics User-defined cryptocurrencies list: up to 10 items About Customisable List of Cryptocurrency: At present, in Pine Language, there is no method to plot a string input variable. Therefore, fixed handles are used to represent each symbol name, eg. "Sym_10". User need to remember the order of the list or refer to "Format". Make sure to input correct tiers, eg. "BITFINEX:ETHUSD" Related Indicators: Profitability Meter for Day Trading PRO - Calculating and evaluating individual trading security's profitability. About Loading Time: It may take up to 2 minutes for your browser to load a new format setting, depending on the your computer and network speed. List of the author's Indicators www.tradingview.com Disclaim: By using or requesting access to this indicator, you acknowledge that you have read and accepted that this indicator is for study purposes only and it does NOT guarantee you will make money. I am not financial adviser and I am NOT responsible for any profits or losses you may incur by using this indicator! Users should make their own decisions, carefully assess risks and be responsible for investment and trading activities. The latest updates override the previous description. Please check the updates. 加密货币赢利潜力排行指标 PRO 自定义列表 优质的交易币种可能倍增你的收益-在付出同样的努力的情况下。 该指标基于Profitability Meter for Day Trading PRO开发,帮助加密货币交易员找到适合其赢利性和波动率偏好的币种。 该指标根据用户定义的时间跨度内的MACD周期,计算和比对用户自定义的一组虚拟货币,生成一个赢利潜力排名。 多时间维度:本指标为日内交易设计,因此建议使用时间维度:3m,5m,15m,30m,1H; 如果用户需要,也可以用于其他小于1D的维度。 免费试用两周:跟帖评论要求试用,您应该在48小时内获得访问权限。 如果没有获得,请私信开发者。 这是Cryptocurrency Profitability Rankings with Popular List的PRO版本 可自定义加密货币列表,上至10个 可选择开盘价或收盘价作为计算起点。 灵活的时间跨度类型:小时,蜡烛数,天数 更多统计选项:显示最近上涨/下跌的MACD周期的价格变动(%) 格式配置: 盈利能力阈值:用户自定义的MACD单次波动的可赢利的百分比,默认为0.8% 选择开盘或者收盘作为起点:这会对结果产生很大影响,因为开盘价和收盘价之间的差异可能很大,特别是在较大的时间维度。 统计选项 timeSpan:统计功能的时间跨度 timeSpanType:统计功能的时间跨度单位 用户自定义的加密货币列表输入栏 关于自定义的加密货币列表: 目前,在Pine Language中,不能打印字符串输入变量。 因此,使用顺序数字字符代表币种名称,例如。“Sym_10”。 用户需要记住其输入币种的顺序或随时参考“格式设置”中的顺序。 确保输入正确的交易所和币种名称,例如。 “BITFINEX:ETHUSD”。 相关指标: 日内交易盈利潜力指示仪PRO (Profitability Meter for Day Trading PRO):用于计算和评估单个交易品种的盈利能力 关于载入新设置:每次载入新的设置可能需要0-2分钟,取决于用户的电脑配置和网络速度。 试用开发者的其他指标 www.tradingview.com 免责声明:在要求获得本指标使用权之前以及在使用本指标之前,用户认可已经完全了解和接受:本指标仅供教育和研究目的, 它不提供任何赢利的可能性。 本指标的开发者并非专业投资顾问,因此不对用户的任何赢亏负责。 用户应独立判断,审慎评估并自负投资和交易风险! 最新更新会覆盖之前的说明。 请检查更新。Wskaźnik Pine Script®od go8686Zaktualizowano 229
Cryptocurrency Profitability Rankings with Popular ListA good cryptocurrency may multiply your earnings - with the same effort. This indicator helps crypto traders to find the trading securities that suit their profitability and volatility preference. This indicator calculates and generate a ranking of profitability from a popular list of crypto currencies, based on MACD cycles within user-defined time span. Multiple time frames: This indicator is designed for day trading, so suggested time frames are: 3m, 5m, 15m, 30m, 1H. Users can try other time frames (< 1D) if they find it useful. Developed based on Profitability Meter for Day Trading PRO About popular list of Cryptocurrency: The author has the right to change the list from time to time without notice. PRO Version of this Indicator: (invite-only) Advanced functions: Customisable(User-Defined) Cryptocurrency List Option to select Open or Close price as start point for calculation. Flexible Time Span Type: Hours and Bars, besides Days More statistics options: Display price change(%) of latest rising/falling MACD cycle Format Configuration: Profitability Threshold: a percentage of price movement within a MACD cycle that a user thinks can be used to define profitability, defval: 0.8%. Statistics Options timeSpan: time span for statistics timeSpanType: time span type for statistics Related Indicators: Profitability Meter for Day Trading PRO - Calculating and evaluating individual trading securitie's profitability. About Loading Time: It may take up to 2 minutes for your browser to load a new format setting, depending on the your computer and network speed. List of the author's Indicators www.tradingview.com Disclaim: By using or requesting access to this indicator, you acknowledge that you have read and accepted that this indicator is for study purposes only and it does NOT guarantee you will make money. I am not financial adviser and I am NOT responsible for any profits or losses you may incur by using this indicator! Users should make their own decisions, carefully assess risks and be responsible for investment and trading activities. The latest updates override the previous description. Please check the updates. 加密货币赢利潜力排行指标 热门列表 优质的交易币种可能倍增你的收益-在付出同样的努力的情况下。 该指标基于Profitability Meter for Day Trading PRO开发,帮助加密货币玩家找到适合其赢利性和波动率偏好的币种。 该指标根据用户定义的时间跨度内的MACD周期,计算和比对一组虚拟货币,生成一个赢利潜力排名。 多时间维度:本指标为日内交易设计,因此建议使用时间维度:3m,5m,15m,30m,1H; 如果用户需要,也可以用于其他小于1D的维度。 关于加密货币的热门列表: 作者有权随时更改列表,恕不另行通知。 该指标的PRO版本:Cryptocurrency Profitability Rankings PRO with Customisable List (Invite-Only) 可自定义加密货币列表,上至10个 可选择开盘价或收盘价作为计算起点。 灵活的时间跨度类型:小时,蜡烛数,天数 更多统计选项:显示最近上涨/下跌的MACD周期的价格变动(%) 格式配置: 盈利能力阈值:用户自定义的MACD单次波动的可赢利的百分比,默认为0.8% 统计选项 timeSpan:统计功能的时间跨度 timeSpanType:统计功能的时间跨度单位 相关指标: 日内交易盈利潜力指示仪PRO (Profitability Meter for Day Trading PRO):用于计算和评估单个交易品种的盈利能力 关于载入新设置:每次载入新的设置可能需要0-2分钟,取决于用户的电脑配置和网络速度。 试用开发者的其他指标 www.tradingview.com 免责声明:在要求获得本指标使用权之前以及在使用本指标之前,用户认可已经完全了解和接受:本指标仅供教育和研究目的, 它不提供任何赢利的可能性。 本指标的开发者并非专业投资顾问,因此不对用户的任何赢亏负责。 用户应独立判断,审慎评估并自负投资和交易风险! 最新更新会覆盖之前的说明。 请检查更新。 Wskaźnik Pine Script®od go868643
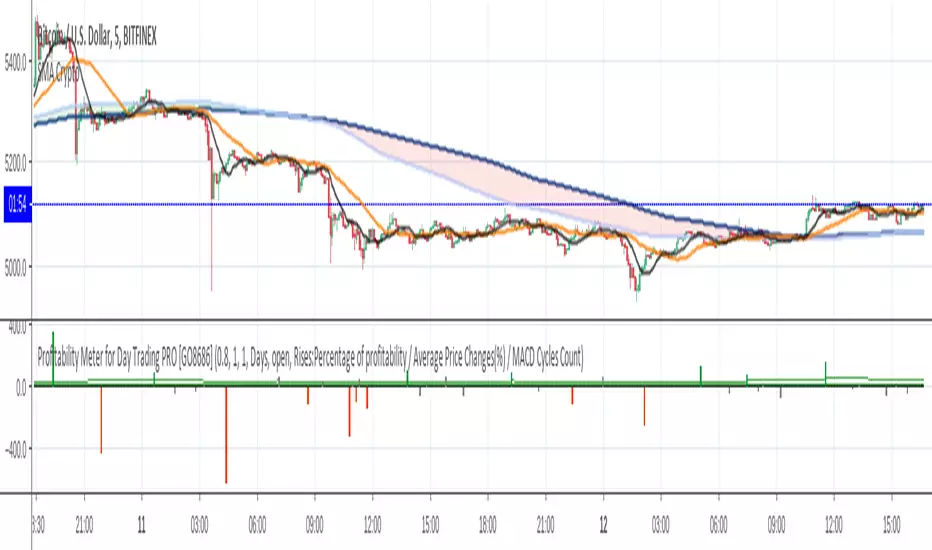
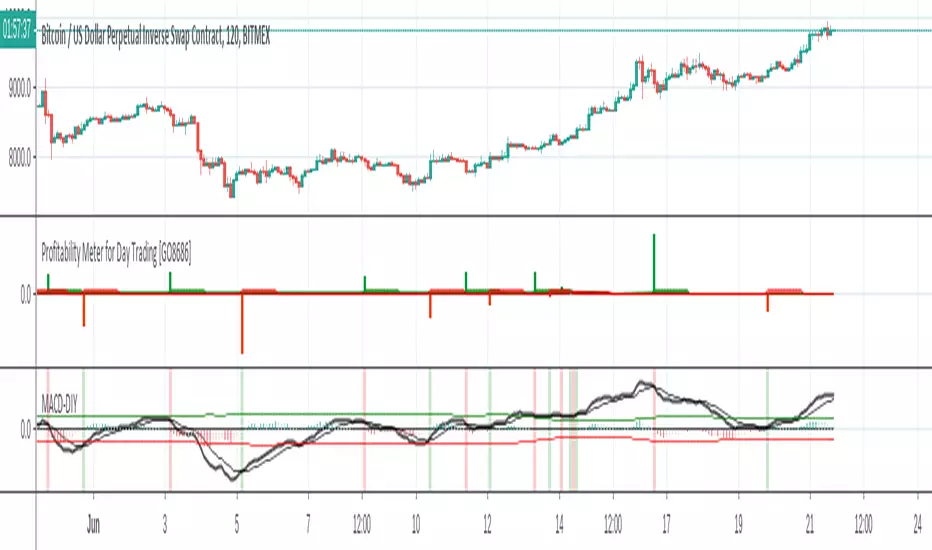
Profitability Meter for Day Trading PRO [GO8686]For day traders, keeping a position is risky and costly, a popular strategy is to open a position ONLY when volatility is active, in other words, only when profitability is back. This indicator reveals the movements of the underlying profitability of a trading security in different time dimensions. This indicator calculates and displays price change percentage of MACD cycles, highlights those MACD cycles that are over the profitability threshold, helping traders identify range area, the start of a new trend and the fading of a trend. Multiple time frames: This indicator is designed for day trading, so suggested time frames are: 3m, 5m, 15m, 30m, 1H. Users can try other time frames (< 1D) if it fits their trading practice. Range area in general: a small green column and a small red column appear alternately, or most columns are gray within the period. The start of a new trend: an outstanding green or red column means the macd cross brought a price change that was higher than the profitability threshold, which could mean a new trend, especially when it was from a range area. The fading of a trend: for instance, when green columns are getting smaller and red columns appear, a fading of bull trend could be on the way. This is PRO version of Profitability Meter for Day Trading PRO excluded functions: Alert Function: allowing user to set alert for price change with Profitability, or set alert for statistics results. Statistics within Customisable Time Span: Percentage of MACD cycles with profitability, the average of price change(%) and MACD cycles count. Users can customize the time range by days,hours or bars (up to the maximum backtracking value that Tradingview allows). Subscribers of this indicator may apply for two-month free-trial of "Crypto Currency Profitability Rankings PRO with Customisable List" Free trial of two-week: Please leave a comment asking for a trial, you should get access in 48 hours. In case it doesn't happen, please message the author. Visibility:Invite-Only Format Configuration: Profitability Threshold: a percentage of price movement within a MACD cycle that a user thinks is good to define profitability, defval: 0.8%. Alertthreshold: Threshold percentage for alert. timeSpan: Time span for statistics timeSpanType: Time span type for statistics Related Indicators: Crypto Currency Profitability Rankings Standard with Popular List (Protected): The Indicator calculates and compares the profitability of a group of popular crypto currencies - based on MACD cycles and user-defined time span, helping traders to find the most suitable trading security. Crypto Currency Profitability Rankings PRO with Customisable List (Invite-Only): Contact the author for a free trial. List of the author's Indicators www.tradingview.com Disclaim: By using or requesting access to this indicator, you acknowledge that you have read and accepted that this indicator is for study purposes only and it does NOT guarantee you will make money. I am not financial advisor and I am NOT responsible for any profits or losses you may incur by using this indicator! Users should make their own decisions, carefully assess risks and be responsible for investment and trading activities. The latest updates override the previous description. Please check the updates. 日内交易盈利潜力指示仪PRO 这是日内交易盈利潜力指示仪的PRO版本 PRO专属功能: 预设警报:方便用户为赢利性变动和统计学结果设置警报。 统计功能:过去特定时间段的可赢利波动的百分比,波动百分比平均值和MACD周期计数。用户可以自定义时间幅度:可以用天数,小时数,蜡烛数(上至Tradingview最大回溯值) 本指标用户可以申请免费试用两个月“Crypto Currency Profitability Rankings PRO with Customisable List (Invite Only)” 指标特征描述 本指标帮助交易员认知交易标的在不同时间维度的赢利潜力的变化。 对于日内交易,保持仓位是要承担风险和成本的,一种交易策略是只在波动率被激活至可赢利水平后才开仓位。 本指标计算和展示赢利潜力-基于MACD周期的波动百分比,用颜色来突出高赢利性的波动周期。方便交易员辨识非交易区间,新趋势的开始和旧趋势的衰减。 多时间维度:本指标为日内交易设计,因此建议使用时间维度:3m,5m,15m,30m,1H; 如果用户需要,也可以用于其他不大于1D的维度。 盘整区的一般特征:当波动率消减时,波动率低于可赢利门槛,呈现灰色; 或者小的绿色和红色波动率间隔出现。 新趋势的开始:在盘整后期,新出现的绿色或者红色波动率可能标识着新趋势的开始。 旧趋势的衰减:以上升趋势为例,当绿色波动率逐渐缩小,而红色波动率开始出现时,可能标识着上升趋势衰减。 设置:盈利能力阈值:用户自定义的MACD单次波动的可赢利的百分比,默认为0.8% 免费试用两周:跟帖评论, 要求试用,您应该会在48小时内获得访问权限。 如果没有获得,请私信作者。 相关指标: Crypto Currency Profitability Rankings Standard with popular list (Protected) 加密货币赢利潜力排行指标 标准版 热门列表: 指标计算和比对一组热门虚拟货币的可赢利属性 - 基于MACD波动周期和用户自定义的时间周期,帮助交易员发掘最适合自己赢利和风险偏好的交易品种。 Crypto Currency Profitability Rankings PRO with Customisable List (Invite-Only): 加密货币赢利潜力排行指标 PRO 自定义列表 试用开发者的其他指标 www.tradingview.com 免责声明:在要求获得本指标使用权之前以及在使用本指标之前,用户认可已经完全了解和接受:本指标仅供教育和研究目的, 它不提供任何赢利的可能性。 本指标的开发者并非专业投资顾问,因此不对用户的任何赢亏负责。 用户应独立判断,审慎评估并自负投资和交易风险! 最新更新会覆盖之前的说明。 请检查更新。Wskaźnik Pine Script®od go8686Zaktualizowano 6625
Profitability Meter for Day Trading [GO8686]Disclaim: By using or requesting access to this indicator, you acknowledge that you have read and accepted that this indicator is for study purposes only and it does NOT guarantee you will make money. I am not financial adviser and I am NOT responsible for any profits or losses you may incur by using this indicator. Users should make their own decisions, carefully assess risks and be responsible for investment and trading activities. Indicator Description Visibility:Protected This indicator helps traders understand the movements of the underlying profitability of a trading security in different time dimensions. For day trading, keeping a position is risky and costly, a popular strategy is to open a position ONLY when volatility is active, in other words, only when profitability is back. This indicator calculates and displays price movement percentage of MACD cycles, highlights those MACD cycles that are over the profitability threshold, helping traders identify range area, the start of a new trend and the fading of a trend. Multiple time frames: This indicator is designed for day trading, so suggested time frames are: 3m, 5m, 15m, 30m, 1H. Users can try other time frames (< 1D) if they find it useful. Range area in general: a small green column and a small red column appear alternately, or most columns are gray within the period. The start of a new trend: an outstanding green or red column means the MACD cross brought a price change that was higher than the profitability threshold, which could mean a new trend, especially when it was from a range area. The fading of a trend: for instance, when green columns are getting smaller and red columns appear, a fading of bull trend could be on the way. Format Configuration: Profitability Threshold: a percentage of price movement within a MACD cycle that a user thinks is good to define profitability, defval: 0.8%. PRO Version of this Indicator: Profitability Meter for Day Trading - PRO (Invite-Only) Alert Function: allowing user to set alert for price change with profitability, or set alert for statistics results. Statistics with Customisable Time Span: Percentage of MACD cycles with profitability, the average of price change(%) and MACD cycles count. Users can customize the time range by days,hours or bars (up to the maximum backtracking value that Tradingview allows). Related Indicators: Crypto Currency Profitability Rankings Standard with Popular List (Protected): This indicator calculates and generate a ranking of profitability from a popular list of crypto currencies, based on MACD cycles within user-defined time span, helping crypto traders to find the trading securities that suit their risk and volatility preference. Crypto Currency Profitability Rankings PRO with Customisable List (Invite-Only): Contact the author for a free trial. List of the author's Indicators www.tradingview.com The latest updates override the previous description. Please check the updates. 日内交易盈利潜力指示仪 免责声明:在要求获得本指标使用权之前以及在使用本指标之前,用户认可已经完全了解和接受:本指标仅供教育和研究目的, 它不提供任何赢利的可能性。 本指标的开发者并非专业投资顾问,因此不对用户的任何赢亏负责。 用户应独立判断,审慎评估并自负投资和交易风险! 指标特征描述 本指标帮助交易员认知交易标的在不同时间维度的赢利潜力的变化。 对于日内交易,保持仓位是要承担风险和成本的,一种交易策略是只在波动率被激活至可赢利水平后才开仓位。 本指标计算和展示赢利潜力-基于MACD周期的波动百分比,用颜色来突出高赢利性的波动周期。方便交易员辨识非交易区间,新趋势的开始和旧趋势的衰减。 多时间维度:本指标为日内交易设计,因此建议使用时间维度:3m,5m,15m,30m,1H; 如果用户需要,也可以用于其他不大于1D的维度。 盘整区的一般特征:当波动率消减时,波动率低于可赢利门槛,呈现灰色; 或者小的绿色和红色波动率间隔出现。 新趋势的开始:在盘整后期,新出现的绿色或者红色波动率可能标识着新趋势的开始。 旧趋势的衰减:以上升趋势为例,当绿色波动率逐渐缩小,而红色波动率开始出现时,可能标识着上升趋势衰减。 设置:盈利能力阈值:用户自定义的MACD单次波动的可赢利的百分比,默认为0.8% 高级版本功能: Profitability Meter for Day Trading - PRO (Invite Only) 预设警报:方便用户为赢利性变动和统计学结果设置警报。 统计功能:过去特定时间段的可赢利波动的百分比,波动百分比平均值和MACD周期计数。用户可以自定义时间幅度:可以用天数,小时数,蜡烛数(上至Tradingview最大回溯值) 相关指标: Crypto Currency Profitability Rankings Standard with popular list (Protected) 加密货币获利机会排行指标 标准版 热门列表(保护,开放使用权): 指标计算和比对一组热门虚拟货币的可赢利属性 - 基于MACD波动周期和用户自定义的时间周期,帮助交易员发掘最适合自己赢利和风险偏好的交易品种。 Crypto Currency Profitability Rankings PRO with Customisable List (Invite-Only): 加密货币获利机会排行指标 PRO - 自定义列表 试用开发者的其他指标 www.tradingview.com 最新更新会覆盖之前的说明。 请检查更新。 Wskaźnik Pine Script®od go8686Zaktualizowano 71
MOSTKOD INDCATOR v1Hello to everyone, The Mostkod Indicator gives us the buying and selling points. Blue color on buy; Red color on sale. You can contact us for more information.Wskaźnik Pine Script®od ibrypc104
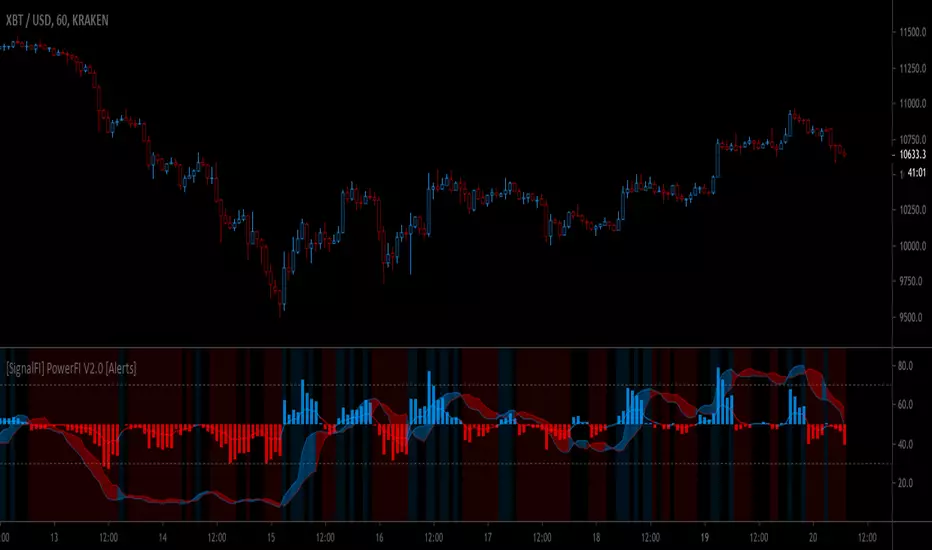
[SignalFI] PowerFI V1.0 [Alerts]PowerFI is a multidimensional RSI that gives you insight into price momentum and trend crossovers via price statistics and rates of change. MUTLTIPLE-TIMEFRAME RSI DIFFERENCE STATISTICS COMBINED WITH RSI MOMENTUM RSI IMPULSE STRENGTH HISTOGRAM ALERTS VERSION Only for Jedi and Master Subscribers SignalFI was created to help traders and investors to effectively analyze the market based on the Golden Mean Ratio (Fibonacci numbers), plan a trade and ultimately execute it. To help inform and educate market decisions we developed a set of Trading Indicators which are available on TradingView , the most advanced and yet easy to use charting platform available on the web. SignalFI indicators are just that, indicators. Our indicators are generally configured to use completely historical data (negating repaint), and we advise all alerts created with SignalFI indicators to be fired upon "close" of the current candle. Our indicators can provide valuable context and visualization support when performing market analysis and executing buy and sell decisions. However. we are not financial experts, and all information presented on this site or our other media outlets are for educational purposes only. For subscription information, visit www.signalfi.net and follow us on twitter.Wskaźnik Pine Script®od SignalFiZaktualizowano 13