Session Liquidity Sweep + Trend ConfirmationThis strategy aims to capture high-probability intraday trades by combining liquidity sweeps with a trend confirmation filter. It is designed for traders who want a systematic approach to trade breakouts during specific market sessions while controlling risk with ATR-based stops.
How it Works:
Session Filter: Trades are only considered during a defined session (default 9:30 - 11:00). This helps avoid low-volume periods that can lead to false signals.
Trend Confirmation: The strategy uses a 50-period EMA to identify the market trend. Long trades are only taken in an uptrend, and short trades in a downtrend.
Liquidity Sweep Detection:
A long entry occurs when price dips below the prior N-bar low but closes back above it, indicating a potential liquidity sweep that stops being triggered before the trend continues upward.
A short entry occurs when price spikes above the prior N-bar high but closes below it, signaling a potential sweep of stops before the downward trend resumes.
ATR-Based Risk Management:
Stop loss is calculated using the Average True Range (ATR) multiplied by a configurable factor (default 1.5).
Take profit is set based on a risk-reward ratio (default 2.5x).
Position Sizing: Default position size is 5% of equity per trade, making it suitable for risk-conscious trading.
Inputs:
Session Start/End (HHMM)
Liquidity Lookback Period (number of bars to define prior high/low)
ATR Length for stop calculation
ATR Stop Multiplier
Risk-Reward Ratio
EMA Trend Filter Length
Visuals:
Prior Liquidity High (red)
Prior Liquidity Low (green)
EMA Trend (blue)
Why Use This Strategy:
Captures stop-hunt moves often triggered by larger market participants.
Only trades with trend confirmation, reducing false signals.
Provides automatic ATR-based stop loss and take profit for consistent risk management.
Easy to adjust session time, ATR, EMA length, and risk-reward to suit your trading style.
Important Notes:
Assumes 0.05% commission and 1-pip slippage. Adjust according to your broker.
Not financial advice; intended for educational, backtesting, or paper trading purposes.
Always test strategies thoroughly before applying to live accounts.
DZIEŃ

Table to filter trades per dayThis script contains a block of code that allows users to filter the total number of trades, loss trades, win trades and win rate per day in a table. This makes it easier to compare which days were profitable and which were not.
Be aware that this script can only be used in strategy scripts. To use the script, open it and copy every line from "START" to "STOP". Then, paste these lines at the very bottom of the strategy script that you want to attach it to.
The user has the ability to adjust the position of the table and customize the size of the text displayed.
If the user sets "Check when the trade:" to "Opened", the script will monitor when the trade opens and add it to the table once it has been closed. If "Check when the trade:" is set to "Closed", the script will track when the trade is closed and add it to the table once it has been closed.
It is recommended to run the script on the "Exchange" setting for more accurate results, even though a "Set the timezone" option is available. This will prevent discrepancies caused by daylight saving time changes.
Please note that the code will only work properly if you choose a daily timeframe or lower.

Time of Day and Day of Week Buying and Selling StrategyThis strategy allows you to back test longing or shorting or do nothing during time increments of 30 minutes for various days of the week. For example if you want to see if every Saturday if Bitcoin dropped in value from 1600-7000 UTC, this script will allow you to test that.
Make sure you are in the 30 minute time frame while viewing the performance and trade history.

Day of Week Custom Buy/Sell StrategyThis strategy was made for bitcoin and allows you to back test longing or shorting for various days of the week. The price may tend to go in one direction or another for each week day, and this strategy allows you to test days across a range of dates to capitalize on this.
Make sure you are on the daily time frame while viewing the performance and trade history to ensure the script works as intended and you have the most historical data as possible from Trading View.

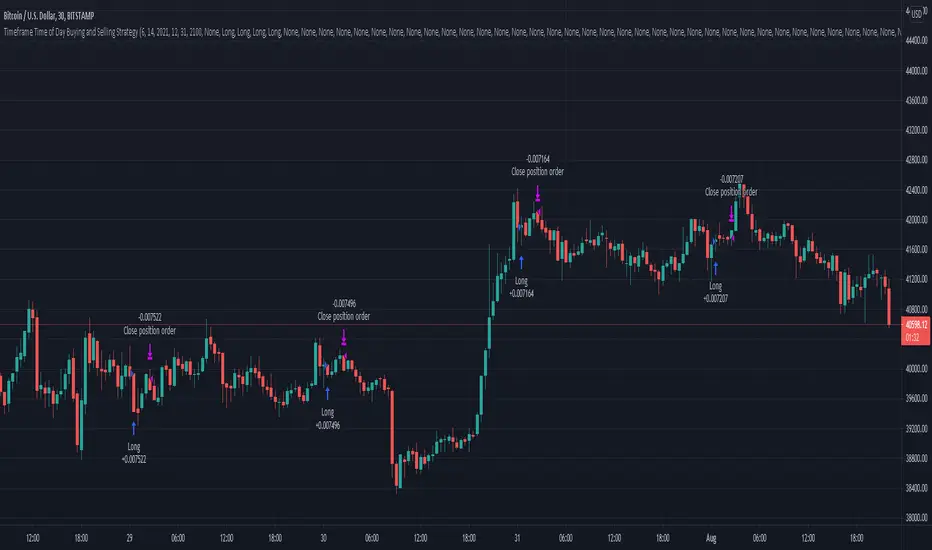
Timeframe Time of Day Buying and Selling StrategyThis strategy allows you to back test longing or shorting or do nothing during time increments of 30 minutes. The price trends in one direction every 30 minutes and this strategy allows you to test various 30 minute time frames across a range of dates to capitalize on this.
Make sure you are in the 30 minute time frame while viewing the performance and trade history.
Khair Day trade with profit lossBest used when applied for intraday trading. Users can customize length and deviation to fit their needs. Works best for high volatility stocks.
This strategy only works intraday intervals, so it means when you try to apply it to day/week/month it won't show any entry or exits.
Bollinger band breakout with non-standard deviation along with profit targets and stop loss.
There are 2 profit targets that can be adjusted based on individual preference.
This strategy minimizes risk and only opens trades when the probability of profitability is higher.

Candle checker for long/short for scalping/day tradingHey.
This strategy is still in working.
For it I check a x amount of candles in the past if they been for example all red/green in row, and based on that I enter. For example candle 7 < candle 6 .... candle 3 < candle 2 .... candle 1 < candle current for long and viceversa for short.
After that,once the trade is initiated, I exit based on 2 possibilities : candle color is different than the color of candle when entry, or based tp/sl.
Let me know what you think of it.
I will try to make the process to calculate automatically and input the number of candles to check like 5-10-15 and so on.

B3 FisherTransform TraderB3 Fisher Transform Trader ~ As you may have found, Fisher Transform (FT) is not an easy beast to tame. However, I have never seen an indicator so consistently early to a move, so, I had to pry into it some more. I tend to stick with indicators that work on many symbols and time-frames, but FT isn't one of them. For starters, I only had a small amount of success in back-tests and only with stocks not futures. I did find however that when set to 9-10 and tightly trailed with a signal average and then put to a intermediate chart like 2h to day bars, it seems to have a nice sweet space in back-tests. I found this to work in multiple platforms, and after plenty of testing, I came up with a few personal tweaks to the indicator. Then walking forward the tests have played out like the back-testing, which is key!
Each symbol you trade will have a sweet spot bar interval in that intermediate area, so long as you keep the input setting to 9-10 for the FT and 2-3 for the signal average length. You are welcome to test well beyond these parameters . :)
Here is a quick view of the success the system has had trading AAPL in binary long or short at all times fashion over the last 10 years.
virtuosotrader.files.wordpress.com
~B3

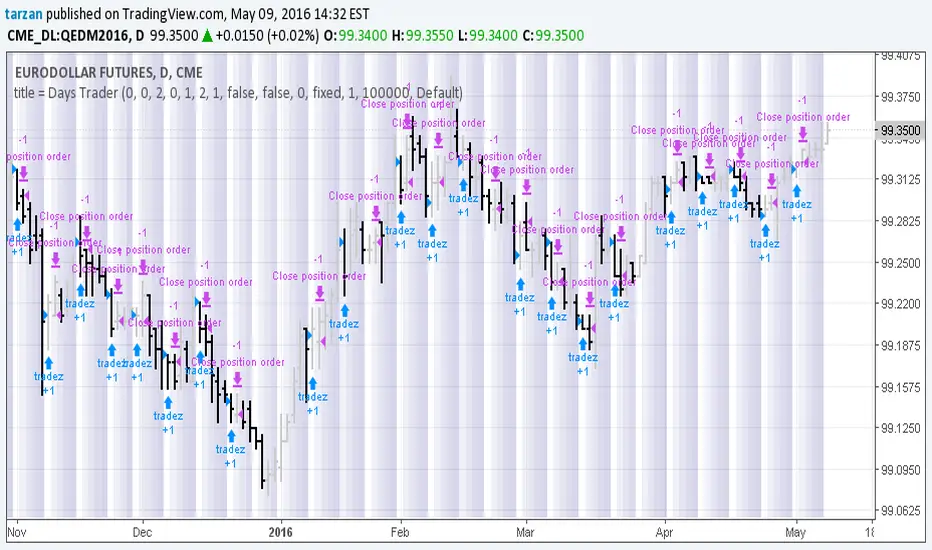
Days Trader 1.0Simple program to look for day of week or day of month patterns in chart data.
All original work by Boffin Hollow Lab
Author: Tarzan