[Sumit Ingole] 200-EMA SUMIT INGOLE
Indicator Name: 200 EMA Strategy Pro
Overview
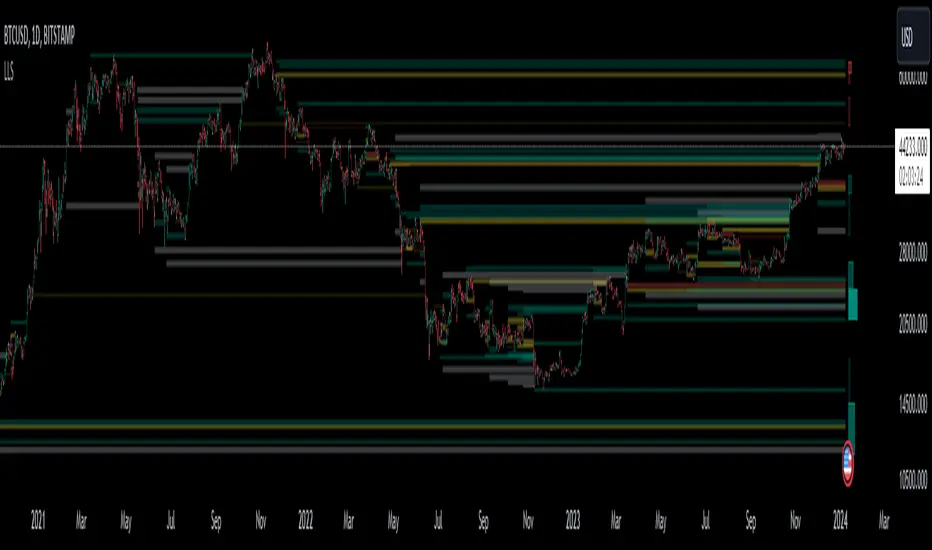
The 200-period Exponential Moving Average (EMA) is widely regarded as the "Golden Line" by professional traders and institutional investors. This indicator is a powerful tool designed to identify the long-term market trend and filter out short-term market noise.
By giving more weight to recent price data than a simple moving average, this EMA reacts more fluidly to market shifts while remaining a rock-solid trend confirmation tool.
Key Features
Trend Filter: Instantly distinguish between a Bull market and a Bear market.
Price above 200 EMA: Bullish Bias
Price below 200 EMA: Bearish Bias
Dynamic Support & Resistance: Acts as a psychological floor or ceiling where major institutions often place buy or sell orders.
Institutional Benchmark: Since many hedge funds and banks track this specific level, price reactions near the 200 EMA are often highly significant.
Reduced Lag: Optimized exponential calculation ensures you stay ahead of the curve compared to traditional lagging indicators.
How to Trade with 200 EMA
Trend Confirmation: Only look for "Buy" setups when the price is trading above the 200 EMA to ensure you are trading with the primary trend.
Mean Reversion: When the price stretches too far away from the 200 EMA, it often acts like a magnet, pulling the price back toward it.
The "Death Cross" & "Golden Cross": Use this in conjunction with shorter EMAs (like the 50 EMA) to identify major trend reversals.
Exit Strategy: Can be used as a trailing stop-loss for long-term positional trades.
Best Used On:
Timeframes: Daily (1D), 4-Hour (4H), and Weekly (1W) for maximum accuracy.
Assets: Highly effective for Stocks, Forex (Major pairs), and Crypto (BTC/ETH).
Disclaimer: This tool is for educational and analytical purposes only. Trading involves risk, and it is recommended to use this indicator alongside other technical analysis tools for better confirmation.
Wskaźnik Pine Script®