Central Bank Liquidity Gap IndicatorThis indicator measures the gap between global liquidity growth and stock market growth to identify potential buying opportunities.
Liquidity drives markets. When central banks print money, that liquidity eventually flows into stocks and other assets. If we spot when liquidity growth is outpacing market growth, we can spot moments when the market is "due" to catch up.
I like this quote:
Earnings don't move the overall market; it's the Federal Reserve Board... focus on the central banks and focus on the movement of liquidity."
- Stanley Druckenmiller
How Central Bank Liquidity Gap Indicator Works
The indicator calculates a simple divergence:
Divergence = Liquidity Growth % − S&P 500 Growth %
Green bars = Liquidity is growing faster than the market (bullish)
Red bars = Market is growing faster than liquidity (less bullish)
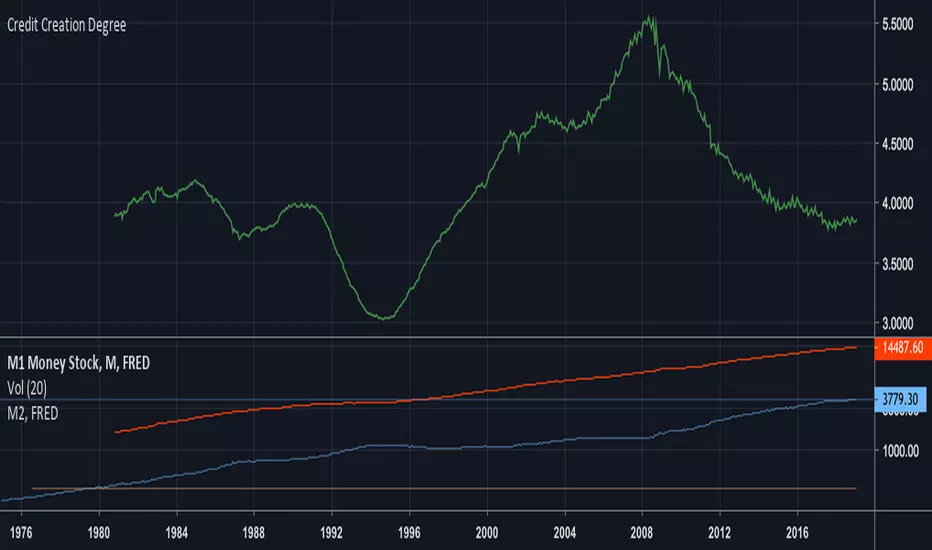
Multi-Country M2 Money Supply
Unlike basic M2 indicators, this one lets you combine money supply data from multiple economies, including US, UK, Canada, China, Eurozone, Switzerland and Japan.
Each country's M2 is automatically weighted by its actual size (converted to USD). Larger economies have more influence on the global liquidity picture.
I've added a discount for China. China's M2 weight is reduced by 50% to account for capital controls that limit how much Chinese liquidity flows into global markets and into the US market.
Fed Net Liquidity
You can also blend in Fed Net Liquidity for a more precise US liquidity measure:
Net Liquidity = Fed Balance Sheet − Treasury General Account − Reverse Repo
This captures the actual liquidity the Fed has injected into financial markets, not just the broad money supply.
How To Read It
The Buy Zone (5%+ Divergence)
When the divergence exceeds +5%, the indicator enters the "Buy Zone" (highlighted with green background). This means liquidity is significantly outpacing market growth — historically a good buy signal.
The Support Table
The info table shows:
Component weights: How much each country's M2 contributes
Corr w/ SPX: Current correlation between liquidity and SPX (are they moving together?)
Leads SPX by X: Does past liquidity predict future SPX moves? (higher = more predictive)
Divergence %: Current divergence value
Signal
Correlation Stats
Corr w/ SPX: Measures if liquidity and SPX are moving in sync right now
Leads SPX: Measures if liquidity changes predict future SPX moves. A positive value here suggests liquidity is a leading indicator.
Potential Use Cases
Long-term investing: Wait for 5%+ divergence (buy zone) to accumulate index funds, ETFs, or stocks
Leveraged ETFs: Use buy zone signals to time entries into UPRO, TQQQ, SSO (higher risk, higher reward)
Crypto: Bitcoin and crypto markets also correlate with global liquidity — use this for BTC accumulation timing
Risk management: Avoid adding positions when divergence is deeply negative
Important Notes
This is a long-term indicator and not for daytrading. It works best used on Daily/Weekly timeframes
It identifies accumulation zones and not precise bottoms
Truly yours, Henrique Centieiro
Inspired by the relationship between M2 money supply and market performance, enhanced with multi-country liquidity tracking and Fed balance sheet analysis.
Let me know if you have questions/suggestions.
Wskaźnik Pine Script®