COT CFTC Title: Enhanced COT CFTC Analysis Tool
Description:
Introducing the 'Enhanced COT CFTC Analysis Tool', meticulously designed to dissect the CFTC's Commitments of Traders (COT) data. This sophisticated tool aims to equip traders and investors with profound insights into market dynamics, utilizing the positions of Large Speculators, Commercials, and Non-Reportable Positions for a comprehensive market overview.
Key Features:
Large Speculators Analysis: Visualizes the net positions of large speculators, offering insights into speculative market sentiments.
Commercials Insights: Provides a deep dive into the trading activities of commercials, known for their strategic hedging practices.
Non-Reportable Positions Tracking: Displays the activities of smaller speculators, often considered as contrarian indicators.
Additional Plots:
Options Share: Allows selection between the proportion of options in the market.
Net, Short, and Long Positions: Offers options to view net, short, and long positions.
Percentage of Net Short and Long Positions: Displays the percentage of net short and long positions, either as raw data or as an index over a specified time period.
Extreme Value Indicators: Highlights extreme values in the market data, providing critical insights into market peaks and troughs.
This tool features an intuitive display with color-coded lines and charts, simplifying the complex data analysis process. It also includes an innovative 5% detector, highlighting extreme market positions for enhanced market understanding.
Spread Analysis: This feature provides an insightful visualization of the spread between various COT data points, enabling users to gauge the market’s depth and liquidity effectively.
Usage Tips:
Utilize divergence analysis between different groups to identify potential trend reversals.
Keep a close eye on the 5% detector for early indications of market overextensions.
The 'Enhanced COT CFTC Analysis Tool' is a vital addition to your trading arsenal, designed to enrich your trading strategy with precise and actionable market insights. It’s not just an indicator; it’s a comprehensive market analysis suite.
Disclaimer: This indicator is for educational purposes only. Trading decisions should always be approached with caution and based on thorough personal analysis.
Commitment of Traders (COT)

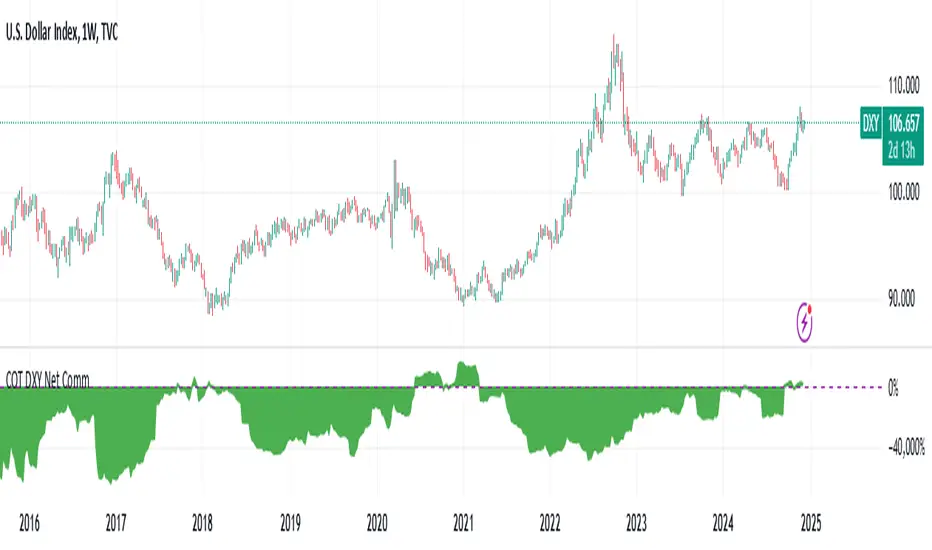
Open Interest Chart [LuxAlgo]The Open Interest Chart displays Commitments of Traders %change of futures open interest , with a unique circular plotting technique, inspired from this publication Periodic Ellipses .
🔶 USAGE
Open interest represents the total number of contracts that have been entered by market participants but have not yet been offset or delivered. This can be a direct indicator of market activity/liquidity, with higher open interest indicating a more active market.
Increasing open interest is highlighted in green on the circular plot, indicating money coming into the market, while decreasing open interests highlighted in red indicates money coming out of the market.
You can set up to 6 different Futures Open interest tickers for a quick follow up:
🔶 DETAILS
Circles are drawn, using plot() , with the functions createOuterCircle() (for the largest circle) and createInnerCircle() (for inner circles).
Following snippet will reload the chart, so the circles will remain at the right side of the chart:
if ta.change(chart.left_visible_bar_time ) or
ta.change(chart.right_visible_bar_time)
n := bar_index
Here is a snippet which will draw a 39-bars wide circle that will keep updating its position to the right.
//@version=5
indicator("")
n = bar_index
barsTillEnd = last_bar_index - n
if ta.change(chart.left_visible_bar_time ) or
ta.change(chart.right_visible_bar_time)
n := bar_index
createOuterCircle(radius) =>
var int end = na
var int start = na
var basis = 0.
barsFromNearestEdgeCircle = 0.
barsTillEndFromCircleStart = radius
startCylce = barsTillEnd % barsTillEndFromCircleStart == 0 // start circle
bars = ta.barssince(startCylce)
barsFromNearestEdgeCircle := barsTillEndFromCircleStart -1
basis := math.min(startCylce ? -1 : basis + 1 / barsFromNearestEdgeCircle * 2, 1) // 0 -> 1
shape = math.sqrt(1 - basis * basis)
rad = radius / 2
isOK = barsTillEnd <= barsTillEndFromCircleStart and barsTillEnd > 0
hi = isOK ? (rad + shape * radius) - rad : na
lo = isOK ? (rad - shape * radius) - rad : na
start := barsTillEnd == barsTillEndFromCircleStart ? n -1 : start
end := barsTillEnd == 0 ? start + radius : end
= createOuterCircle(40)
plot(h), plot(l)
🔶 LIMITATIONS
Due to the inability to draw between bars, from time to time, drawings can be slightly off.
Bar-replay can be demanding, since it has to reload on every bar progression. We don't recommend using this script on bar-replay. If you do, please choose the lowest speed and from time to time pause bar-replay for a second. You'll see the script gets reloaded.
🔶 SETTINGS
🔹 TICKERS
Toggle :
• Enabled -> uses the first column with a pre-filled list of Futures Open Interest tickers/symbols
• Disabled -> uses the empty field where you can enter your own ticker/symbol
Pre-filled list : the first column is filled with a list, so you can choose your open interest easily, otherwise you would see COT:088691_F_OI aka Gold Futures Open Interest for example.
If applicable, you will see 3 different COT data:
• COT: Legacy Commitments of Traders report data
• COT2: Disaggregated Commitments of Traders report data
• COT3: Traders in Financial Futures report data
Empty field : When needed, you can pick another ticker/symbol in the empty field at the right and disable the toggle.
Timeframe : Commitments of Traders (COT) data is tallied by the Commodity Futures Trading Commission (CFTC) and is published weekly. Therefore data won't change every day.
Default set TF is Daily
🔹 STYLE
From middle:
• Enabled (default): Drawings start from the middle circle -> towards outer circle is + %change , towards middle of the circle is - %change
• Disabled: Drawings start from the middle POINT of the circle, towards outer circle is + OR -
-> in both options, + %change will be coloured green , - %change will be coloured red .
-> 0 %change will be coloured blue , and when no data is available, this will be coloured gray .
Size circle : options tiny, small, normal, large, huge.
Angle : Only applicable if "From middle" is disabled!
-> sets the angle of the spike:
Show Ticker : Name of ticker, as seen in table, will be added to labels.
Text - fill
• Sets colour for +/- %change
Table
• Sets 2 text colours, size and position
Circles
• Sets the colour of circles, style can be changed in the Style section.
You can make it as crazy as you want:

ICT Commitment of Traders° by toodegreesDescription:
The Commitment of Traders (COT) is a valuable raw data report released weekly by the Commodity Futures Trading Commission (CFTC). This report offers insights into the current long and short positions of three key market entities:
Commercial Traders ( usually represented in red )
Large Traders ( typically depicted in green )
Small Speculator Traders ( commonly shown in blue )
The concept of utilizing the COT data as a strategic trading tool was first introduced by Larry Williams, who emphasized the importance of monitoring Commercial Speculators – large corporate producers or consumers of commodities.
The Inner Circle Trader (ICT) prompts us to delve deeper into this data. While we can easily determine their Net Position (also referred to as the Main Program) by subtracting Commercial Short Positions from the Commercial Long Positions, this calculation doesn't reveal their ongoing Hedge Program .
Merely following the Main Program won't provide a trading edge. Aligning with the Hedge Program can be an invaluable weapon in your trading arsenal.
The Commercial Speculators' Hedge Program can be unveiled by examining the highest and lowest reading of their Net Position over a chosen time period and setting a new "zero line" between these extremes. This process generates a novel "COT Graph" providing a detailed understanding of the Commercial Speculators' current market activity.
When the Hedge Program, Seasonality, and Open Interest are cross-referenced with Institutional Orderflow, a trader can construct a very clear medium-to-long-term market narrative.
Features:
Access COT Data for the Commercial Speculators via Tradingview's reliable data source
Automate calculations and display the 3-month, 6-month, 12-month, 2-year, and 3-year Hedge Program
Define your own Custom Time Range for the Hedge Program
Display the Main Program and all Hedge Programs in an easy-to-understand table format
Additionally, by following the included instructions, you can augment your table with COT data from multiple markets. This extra information can help monitor correlated markets and develop a more robust market narrative:

EURUSD COT Trend StrategyThis is a long term/investment type of strategy designed to have a good idea about where the big trend direction is headed.
Its logic, its made entirely on the COT report, mainly from looking into the net non comercial positions aka the speculators.
For bullish trend we look that the difference between long non comercial vs short non comercial is higher than 0
For bearish trend we look that the difference between long non comercial vs short non comercial is lower than 0.
This is mainly as an educational tool, for a full strategy, I recommend implement other things into it, like technical analysis or risk management.
If you have any questions, please let me know !

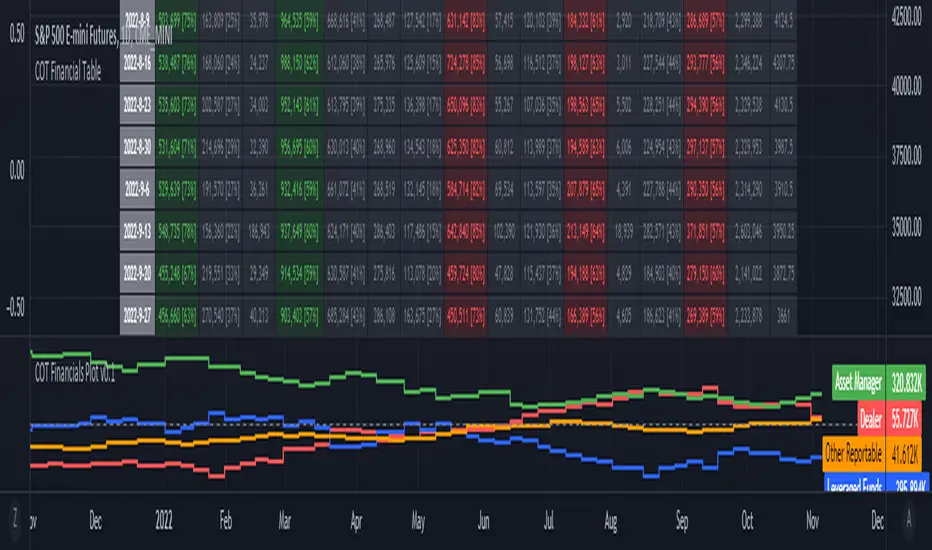
ILM COT Financials PlotUse this indicator on Daily Timeframe
Please refer to the below link for CFTC Financials
www.cftc.gov
This script is very similar to COT Financial Table indicator except that it plots the data (Longs - Shorts) instead of showing in a table.
COT Report IndicatorA COT Report Indicator that shows the Data for both currencies (base- and quotecurrency). It works in the forex market and on the Bitcoin Chart.
The table shows the Net-Contracts, Long and Short Percentage of the latest report. The line chart shows if the Commercials, Institutionals and Retail Traders are more long biased (value above 50) or more short biased (value below 50).
The COT Report is only published weekly. This should not be used as an entry indicator, but can help to find market bottoms/top and the trend of the market.

Bitfinex Shorts StratOverview
This strat applies the data from BITFINEX:USDSHORTS to the RSI indicator in order to provide SHORT/LONG entries as the number of contracts goes up and down. Although Bitfinex has lost relevance over the years its generally considered an exchange dominated by smart money rather than retail. I'd like to see if any insights can be gained by following their trading behaviour.
How to use
Select the underlying security you wish to trade and load the indicator. Select the appropriate short security by searching in the Bitfinex Short Symbol. RSI settings apply to short symbol not the actual asset. Strategy shorts the underlying asset when shorts rise and longs when they drop. The shorts symbol will follow the value of the loaded chart. Works best on 4 hour chart.
Why use shorts only rather than both long/shorts?
Bitfinex longs seem to be on a long-term uptrend accounting for 25x the number of shorts. Might be enormous confidence on part of the whales, but more likely reflects selling spot and buying perp. Given the size disparity and price action I don't think longs info is adding much.
Problems with script:
a) We don't really know the intentions of short players (e.g. speculation or hedging spot)
b) The script uses a decline in shorts as a long signal
c) RSI is a blunt tool there are probably better options for calculating high/lows in shorts
d) Shorts are accumulated both at highs and also when BTC price is already heavily trending down. This suggests some are speculative (at the highs) or protective/hedging during a decline
Takeaways:
Based on this strat Bitfinex whales are more wrong than right.
Results don't carry across well into altcoins using the accompanying short symbol. However, what is interesting is that applying the BITFINEX:BTCUSDSHORTS to altcoin charts does work pretty well.
Strat needs some refinement to control for entries under different circumstances.
Probably not a great idea to use this as a strategy in isolation, but highlights how Bitfinex whale behaviour is a good gauge to follow.

COT + ema + aux tickerPurpose: Create a script for backtesting the idea that COT can steer weekly Bias on Forex Market.
How does it works: the script use Commercials Delta Conctract, EMA of the selected ticker, EMA of 2 auxiliary tickers (e.g. correlated ticker) to generates buy and sell signals, it allows to include or not each of these.
If you use all the indicator, The buy or sell signals are generated following that rules:
(Example for buy signals on GBPCAD)
1) Commercials add net contract to GBP futures + remove net contract to CAD
2) EMA of GBPCAD is rising
3) EMA of 1st aux ticker is rising (or decline if select inv option)
4) EMA of 2nd aux ticker is rising (or decline if select inv option)
The scripts set the stop at low of the week for long orders and high of the week for shorts.
The exit strategy is to exit at first week of profit
How could you use it:
1) Choose your FX Ticker e.g. GBPCAD and set 1W TimeFrame
2) Select ticker in the strategy setting, remember to select the currency in right order, if you want to study GBP CAD 1st currency is GBP and 2nd CAD
3) Choose if you want to use EMA (and its period of calculation)
4) Choose if you want to use a aux ticker, the direction, and the relative ema period
What could be better;
1) you can just buy on begin of the week.
2) the exit strategy isn't best you can do
3) No level of delta contract is consider, its generate a buy signial also for 1 contract in the right direction
For any question, suggestion of improvemet, ideas, insult:) write to me
It all started from a script i find here on tradingview that extract COT data. Don't remember the name of that guy but Thanks a lot.
My English isn't perfect but i hope you can understand as well.

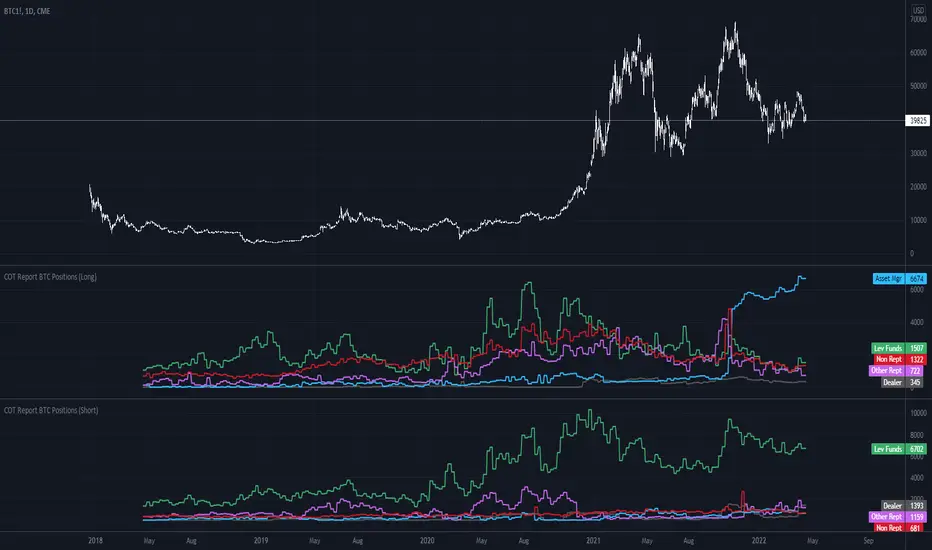
COT Report BTC Positions█ OVERVIEW
Showing the Commitments of Traders (COT) report(*) for BITCOIN Positions - CHICAGO MERCANTILE EXCHANGE (futures only) with COT charts on TradingView data.
* COT reports are released each Friday (except for U.S. holidays) by the CFTC.
* Each COT report release includes data from the previous Tuesday.
* Original data is www.cftc.gov
Data currently displayed are through April 12, 2022
█ FEATURES
You can switch the display for each of the following Positions :
Long
Short
You can switch the display for each of the following Categories :
Dealer
Asset manager
Leverage funds
Other reportable
Non reportable
█ HOW TO USE IT
This indicator allows you to see changes for each category within TradingView without having to refer directly to each report.
COT Net Positions BTC & ETH FO_ALLWeekly Commitment of Traders Report for Futures positions, as well as futures plus options positions.
This is only for Bitcoin and Ether.
OPEN INTEREST
DEALER
ASSET MANAGER
LEVERAGED FUNDS
OTHER REPORTABLE
TOTAL REPORTABLE
NON REPORTABLE
CoT data with OpenInterestDisplays COT data based on the "Disaggregated Commitments of Traders" report for Futures of the CFTC.
It does make accesible the following symbols:
ZB
ZN
ZS
ZM
ZL
ZC
ZW
KE
HE
LE
GC
SI
HG
CL
HO
RB
NG
6A
6B
6C
6E
6J
6S
SB
KC
CC
CT
ES
RTY
YM
NQ
PA
PL
AUP
HRC
EH
BB
ZR
ZO
DC
OJ
LBS
GF
SP
DJIA
6N
6L
VX
6M
6R
6Z
ZT
ZF
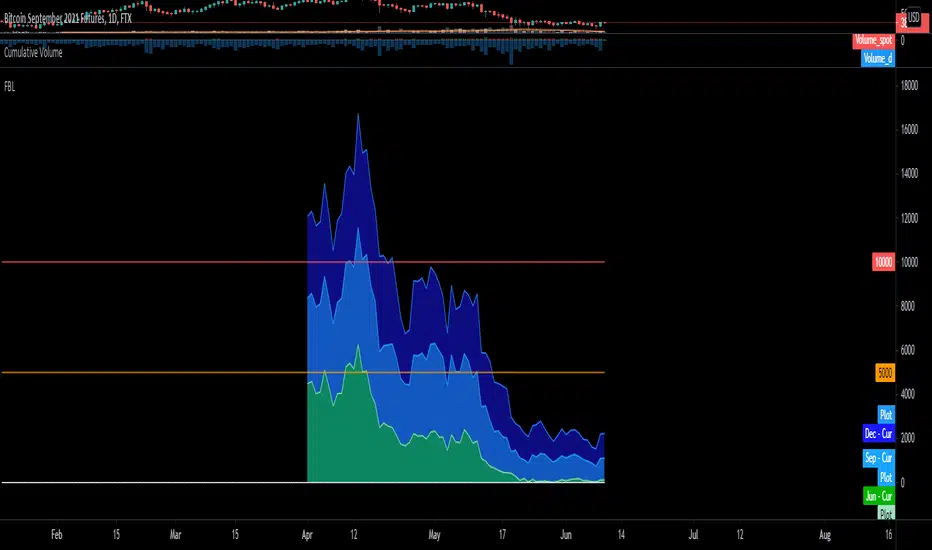
BTC FTX Futures PremiumsThis indicator shows the future BTC premiums on FTX.
The purple area is the Daily December Futures contract subtracted by the current price.
The blue area is the Daily September futures contract subtracted by the current price.
The green area is the Daily June futures contract subtracted by the current price.
You can use this to try and understand market sentiment.
If the current price dumps but the premium remains the same it likely means that sentiment is unchanged.
The opposite is true, if the price pumps and the premium is the same it means the market likely wasn't convinced by the movement.
The difference between the current price and the futures price can help determine how bullish or bearish a market or at extremes the level of euphoria.
Last Friday of MonthThis script marks the last Friday of the month in a daily chart because this is the day when BTC and ETH options expire according to Deribit.
I only found a script that highlights the 3rd Friday of the month, which is not what I wanted.
This script tries to figure out the correct number of days per month but is not aware of holidays which might displace the expiry date.

GOD's EYEGet to know when to accumulate when biggies are buying and when to stay away from the stock

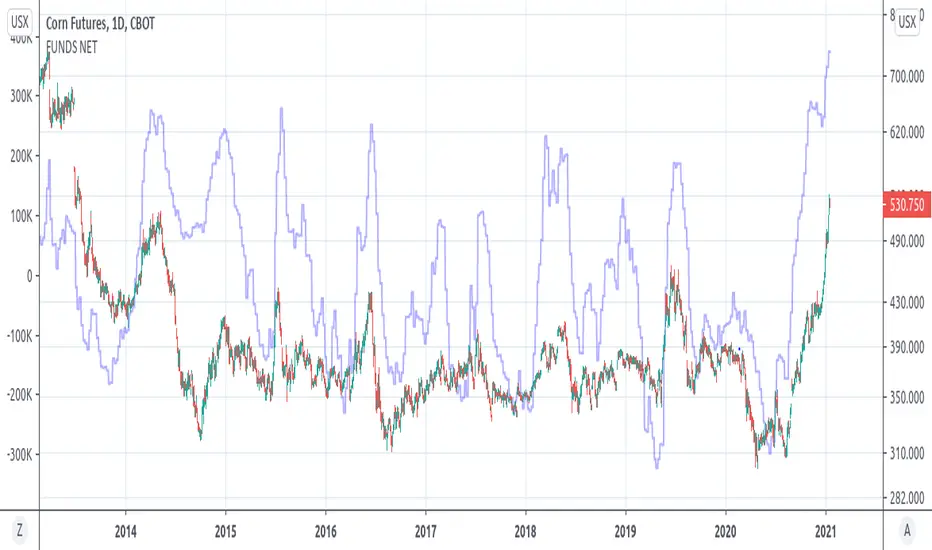
COT GRAINS FUNDS NET POSITION(GRAINSTATS)- Retrieves fund net position from CFTC Commitments of Traders(COT) Reports
- Overlays fund net positions on left y-axis vs price on right y-axis
- Current supported Grain Products
- Corn (CBOT) (QUANDL: 002602)
- Soybeans (CBOT) (QUANDL: 005602)
- Kansas City Wheat(CBOT) (Hard Red Winter) (QUANDL: 001612)
- Oats (CBOT) (QUANDL: 004603)
- Soybean Meal (CBOT) (QUANDL: 026603)
- Soybean Oil (CBOT) (QUANDL: 007601)
- Wheat (CBOT) (Soft Red Winter) (QUANDL: 001602)
(MGEX WHEAT IS UNSUPPORTED)

Cumulative distribution function - Probability Cumulative distribution function (tScore and zScore)
This script provides the calculation of the cumulative distribution function (i.e., probability). The measure allows you to calculate the chances of a value of interest being above or below a hypothesized value over the measurement period—nothing fancy here, just good old statistics and mathematics. The closer you are to 0 or 1, the more significant your measurement. We’ve included a significance level highlighting feature. The ability to turn price and/or volume off.
We have included both the Z and T statistics. Where the ‘Z’ is looking at the difference of the current value, minus the mean, and divided by the standard deviation. This is usually pretty noisy on a single value, so a smoother is included. Nice shoutout to the Pinecoders Github Page with this function also. The t-statistic is measuring the difference between a short measurement, an extended measurement, and divided by the standard error (sigma/sqrt(n)). Both of these are neatly wrapped into a function, so please feel free to use them in your code. Add a bit of science to your guessing game. For the purists out there, we have chosen to use sigma in the t-statistic because we know the population's behavior (as opposed to the s-measure). We’ve also included two levels of the t-statistic cumulative distribution function if you are using a short sample period below 6.
Finally, because everyone loves choices, we’ve included the ability to measure the probability of:
the current value (Price and volume)
change
percent change
momentum (change over a period of time)
Acceleration (change of the change)
contribution (amount of the current bar over the sum)
volatility (natural log ratio of today and the previous bar)
Here is a chart example explaining some of the data for the function.
Here are the various options you have the print the different measurements
A comparison of the t-statistic and z-statistic (t-score and z-score)
And the coloring options

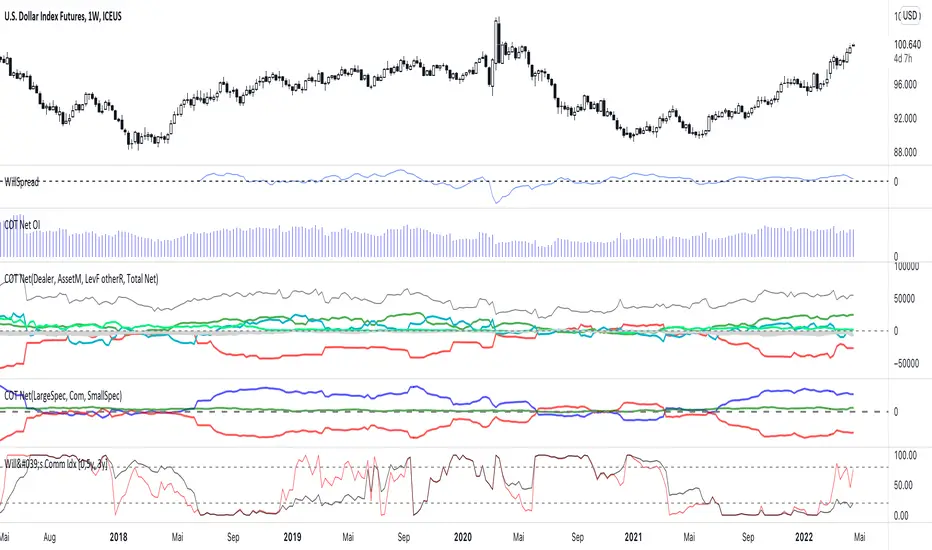
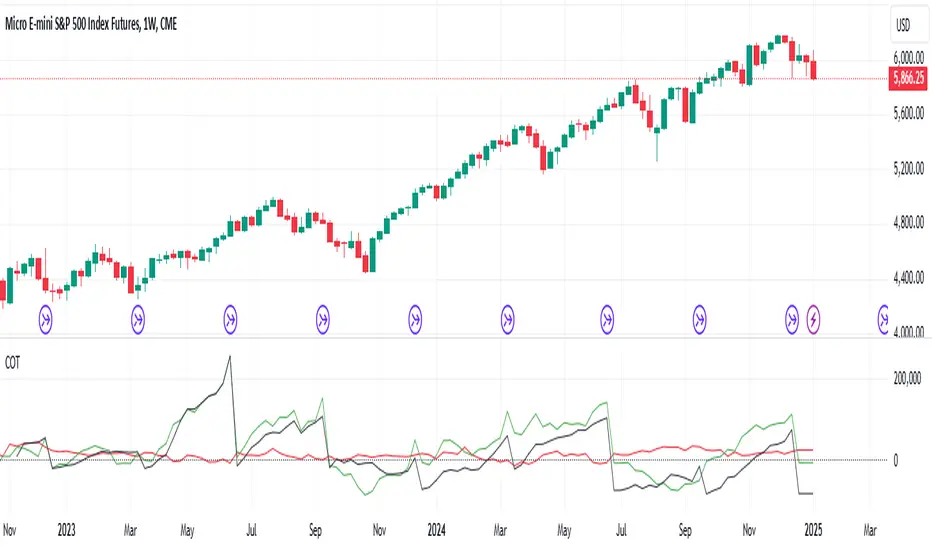
COT Net Non-Commercials vs Commercials (Updated MTF Non-Repaint)Hello there,
With this script, you can see CFTC COT Non Commercial and Commercial Positions together.
This way, you can analyze net values greater than 0 and smaller, as well as very dense and very shallow positions of producers and speculators.
Green - Non Commercials - Speculators
Red - Commercials - Producers
This script is multi time-frame and non-repaint script.
Data pulled through Quandl.
And the latest version codes have been used.
As time goes by, I will try to make useful modifications to this scheme.
Regards.
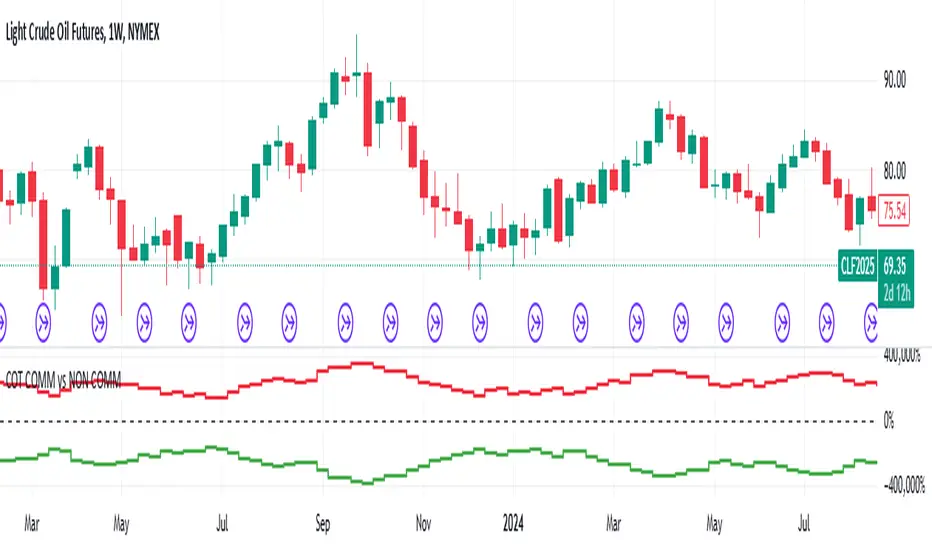
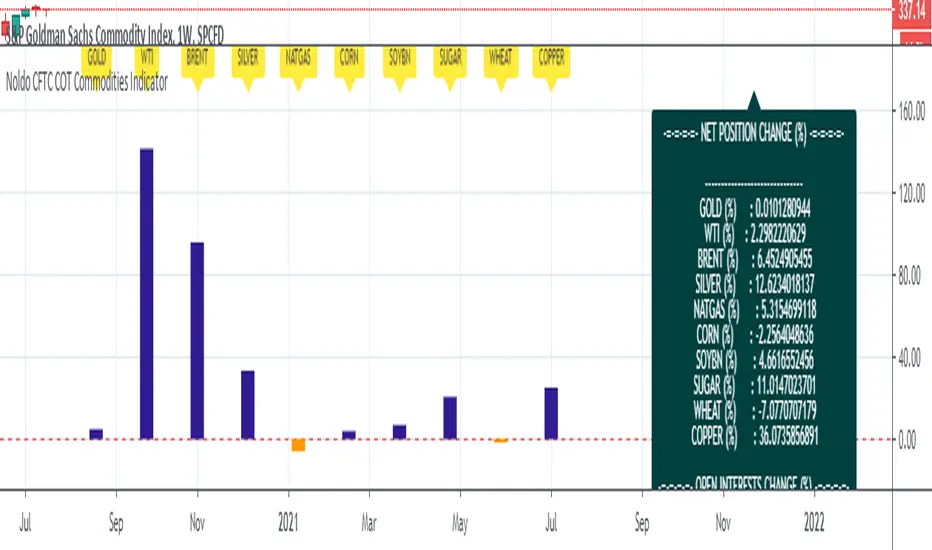
Noldo CFTC COT Commodities IndicatorHi.
Hello, this script has the same logic as Noldo CFTC COT Forex indicator :
It is the version for the future markets.
Major future assets are the subject.
Usage
This script works only on SPGSCI (S&P Goldman Sachs Commodity Index).
You must open SPGSCI :
www.tradingview.com
It only works on 1W graphics.
Because COT data is announced on Tuesday, it will cause repaint every Tuesday.
However, since it is a terminal, this factor is not strong enough to affect your decisions.
For use, you should open the bottom panel, go a little to the right in the history section and enlarge the panel you have opened.
The terminal will take its form in the presentation and provide analysis on the big screen.
COT data are pulled via Quandl.
Regards.
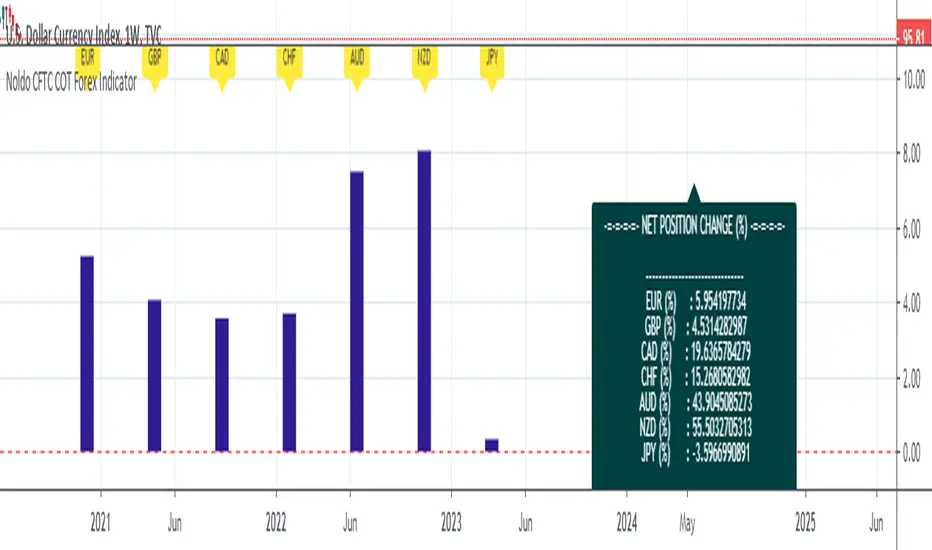
Noldo CFTC COT Forex IndicatorHello.
I decided to publish the COT Forex Indicator, which I created for convenience, as an open source.
The period DXY is determined by the differences between the two signals on the Pivot Reversal Strategy on the weekly chart.(1W)
Thus, relative period point search is automated.
When the new signal comes, after the closing, the number of bars between the previous bar before the new signal comes both directions.
This elapsed time is our period in which we will look back on relative changes.
If there is no signal, the period remains constant, thereby allowing us to notice excessive changes.
And in this period, COT data exchange and price changes are reflected in the terminal.
The automatic time-keeping of the period and the automatic generation of the relative differences of the terminals according to the period prevents a great loss of time.
Thus, we create one of the strong columns that enable us to make decisions.
The other column is the signals we obtained as a result of technical analysis.
The last column is the economic agenda and data tracking.
That's why I made my decision to share this:
Real life should not be distracted,
should not be drowned in the sea of technical analysis.
COT data is one of the most important and valuable tools that bring us signs of real life,
It should not be forgotten !
A lot of time is lost while doing these analyzes, and I wanted this to be much more practical and tidy!
And we can see if there are factors that will back up our incoming signals.
Usage
This script works only on DXY .
You must open DXY.
It only works on 1W graphics.
Because COT data is announced on Tuesday, it will cause repaint every Tuesday.
However, since it is a terminal, this factor is not strong enough to affect your decisions.
For use, you should open the bottom panel, go a little to the right in the history section and enlarge the panel you have opened.
The terminal will take its form in the presentation and provide analysis on the big screen.
COT data are pulled via Quandl.
General kind request:
Authors who know the technical broad expression of the security function or have an idea about its creation, please reach me.
Best regards.
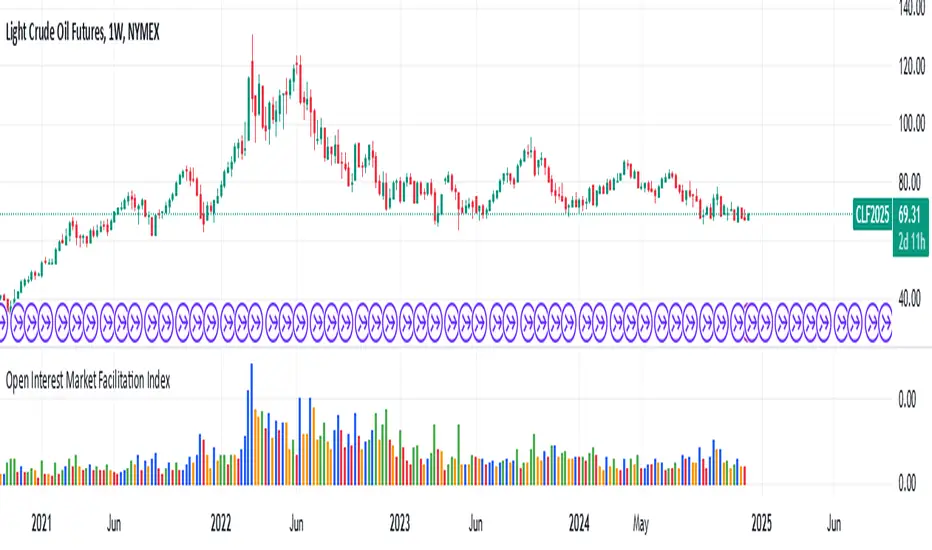
Open Interest Market Facilitation IndexOriginal script from ChartChampions :
Let's start.
This script was created by using Open Interest instead of Volume in the Market Facilitation Index.
Thus, it can make a difference in the Future and CFD Markets.
If your financial instrument is not from these markets, that is, if Open Interest is not used, you can choose Volume.
You can set "FUTURES" and "OTHERS" from the menu.
If you use the Open Interest (FUTURES) option in the menu on 1W bars and defined Future markets, it will not repaint.
This is the best use for Open Interests, as data is extracted from Quandl and CFTC COT reports are published once a week.
Color Change Rules :
In my version :
Green Bars = Green
Fade Bars = Orange
Fake Bars = Blue
Squat Bars = Red
To show the difference in the presentation, both the Futures option using Open Interest and the Others option using Volume were published to compare.
You can observe the difference.
Best regards.
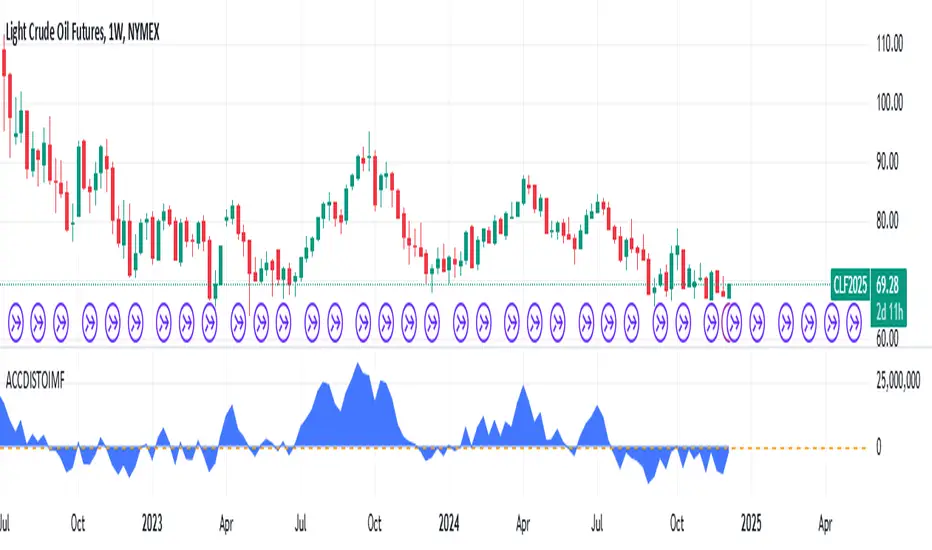
Accumulation/Distribution Open Interest Money Flow Hi, this script is the version of Accumulation / Distribution Money Flow (ADMF) that uses Open Interes ts in the required markets instead of Volume.
Can be set from the menu. (Futures/Others)
NOTE: I only modified this script.
The original script belongs to cl8DH.
Original of the script:
I think it will make a difference in the future and commodity markets.
Since the system uses CFTC data, use only for 1W timeframe.
With my best regards..
DXY COT Commercial Net PositionsThis script was created due to the lack of position of US Dollar Index Futures (DXY).
It is designed to perform a much more liquid and inclusive position analysis.
As the exponential ratios do not mean anything to positions, weights are used as multipliers instead of exponential functions.
Swedish Krona (SEK) Futures are not directly quoted in Quandl, therefore weighted in Euro / dollar parity.
By perceiving these positions as inverse correlations, you can also identify where the world economy is doing well.
COT Commercial Net Positions are calculated as (Short - Long) because of Commercials act according to the reverse of the market.
In this way, you can follow up normally instead of reverse correlation.
Because except in extreme cases, in which case capitals usually shift to Gold.
This is not the case, since there is no capital inflow to other currencies, it is not a strong sell position to the dollar index.
When there is a shift in bonds, we see the effect of the dollar in general.
I created for the Dollar Index in order not to deviate from the concept.
I wanted to share it with everyone as I thought that you have important clues about how investors take positions.
Modified currency weights :
Euro : % 61.8
Japanese Yen : % 13.6
British Pound : %11.9
Canadian Dollar : % 9.1
Swiss Franc : % 3.6
NOTE : You can use it for all instruments except crypto coins, especially US Dollar Index (DXY).
Since the COT data is taken, it will not repaint in 1 week (1W) timeframe.
The log can also be repaint according to the time of data publication.
It will repaint in lower time frames.
I hope it will help your analysis and your scripts,regards.