XLimitless - Commitments of Traders (COT)XLimitless - Commitment of Traders (COT)
Unlock unparalleled market insights with the
XLimitless - COT Indicator, designed to give traders a competitive edge by visualizing the weekly Commitment of Traders (COT) data in an interactive and customizable table.
This advanced tool provides a comprehensive breakdown of market participants' positions, including Commercials, Non-Commercials (Large Speculators), and Non-Reportables (Small Speculators).
Key Features:
Customizable Data Display:
Choose from Commercial , Non-Commercial , or Non-Reportable positions.
Set the number of weeks to display (up to 52) for a tailored view.
Heatmap highlighting for quick identification of historical extremes.
Detailed Metrics:
Weekly Long, Short, and Net Positions data.
Open Interest and weekly changes for granular analysis.
Max/Min rows to spot historical highs and lows at a glance.
Interactive Table Positioning:
Flexible table placement options (e.g., Top Right, Bottom Left) to suit your chart layout.
Dynamic date adjustments with time-zone support for accurate alignment.
Enhanced Visual Feedback:
Heatmap-based color gradients for easy trend and extreme position identification.
Integrated tooltips for intuitive data understanding.
Global Asset Coverage:
Supports major asset classes, including Currencies, Commodities, Indices, and more.
Auto-detects base and quote currencies, ensuring accurate data mapping.
Historical Lookback Settings:
Analyze trends over 6 months to 5 years with configurable lookback periods.
Market Participants:
Commercial: Users & Producers
Non Commercial: Bank, Institutions & Large Traders
Non Reportable: Small Traders, Retail
--
Disclaimer:
By using or publishing the XLimitless - Commitment of Traders (COT) indicator, you warrant that:
The information displayed and interpreted through this tool complies with applicable laws and regulations.
The indicator does not constitute investment advice or financial recommendations.
The content generated is not intended solely for qualified or professional investors.
Always ensure compliance with TradingView’s policies and applicable legal standards. Use this indicator responsibly and at your own discretion.
Commercial

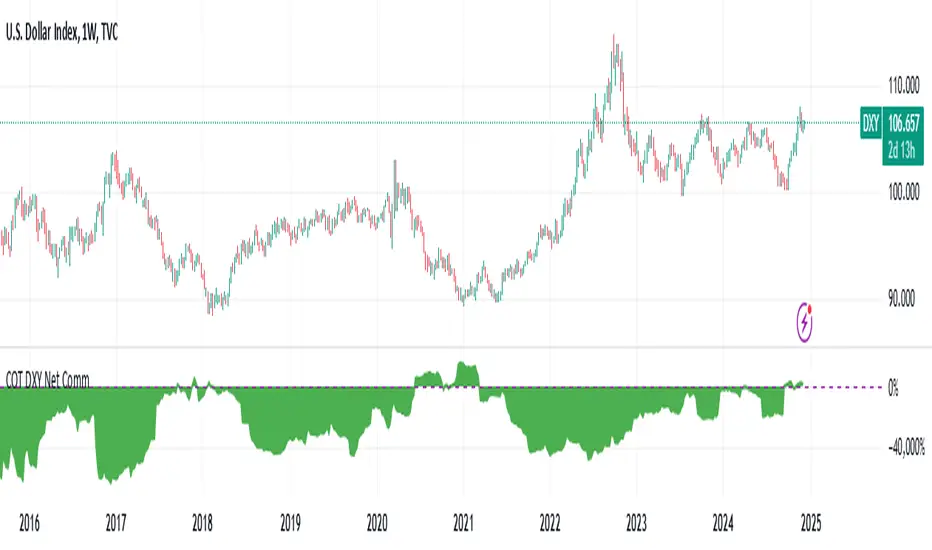
DXY COT Commercial Net PositionsThis script was created due to the lack of position of US Dollar Index Futures (DXY).
It is designed to perform a much more liquid and inclusive position analysis.
As the exponential ratios do not mean anything to positions, weights are used as multipliers instead of exponential functions.
Swedish Krona (SEK) Futures are not directly quoted in Quandl, therefore weighted in Euro / dollar parity.
By perceiving these positions as inverse correlations, you can also identify where the world economy is doing well.
COT Commercial Net Positions are calculated as (Short - Long) because of Commercials act according to the reverse of the market.
In this way, you can follow up normally instead of reverse correlation.
Because except in extreme cases, in which case capitals usually shift to Gold.
This is not the case, since there is no capital inflow to other currencies, it is not a strong sell position to the dollar index.
When there is a shift in bonds, we see the effect of the dollar in general.
I created for the Dollar Index in order not to deviate from the concept.
I wanted to share it with everyone as I thought that you have important clues about how investors take positions.
Modified currency weights :
Euro : % 61.8
Japanese Yen : % 13.6
British Pound : %11.9
Canadian Dollar : % 9.1
Swiss Franc : % 3.6
NOTE : You can use it for all instruments except crypto coins, especially US Dollar Index (DXY).
Since the COT data is taken, it will not repaint in 1 week (1W) timeframe.
The log can also be repaint according to the time of data publication.
It will repaint in lower time frames.
I hope it will help your analysis and your scripts,regards.
Commercial Movement Index-BuschiEnglish
Inspired by the book "The Commitments of Traders Bible" by Stephen Briese, this indicator is a follow-up of my already published "Commercial Index-Buschi".
Here, the Commercial Index isn't shown in values from 0 to 100, but in how far the value changed from a given timeframe (default Movement Reference: 6 weeks). Therefore it ranges from 100 (bullish move from the Commercials during the last weeks) to -100 (bearish move).
Deutsch
Inspiriert durch das Buch "The Commitments of Traders Bible" by Stephen Briese, ist dieser Indikator eine Weiterentwicklung meines bereits veröffentlichten Skriptes "Commercial Index-Buschi".
Hier wird der Commercial Index nicht in Werten von 0 bis 100 angezeigt, sondern in wieweit er sich innerhalb eines vorgegebenen Zeitfensters (Standard: Movement Reference: 6 Wochen) verändert hat. Daher schwankt er zwischen 100 (bullishe Bewegung der Commercials innerhalb der letzten Wochen) und -100 (bearishe Bewegung).
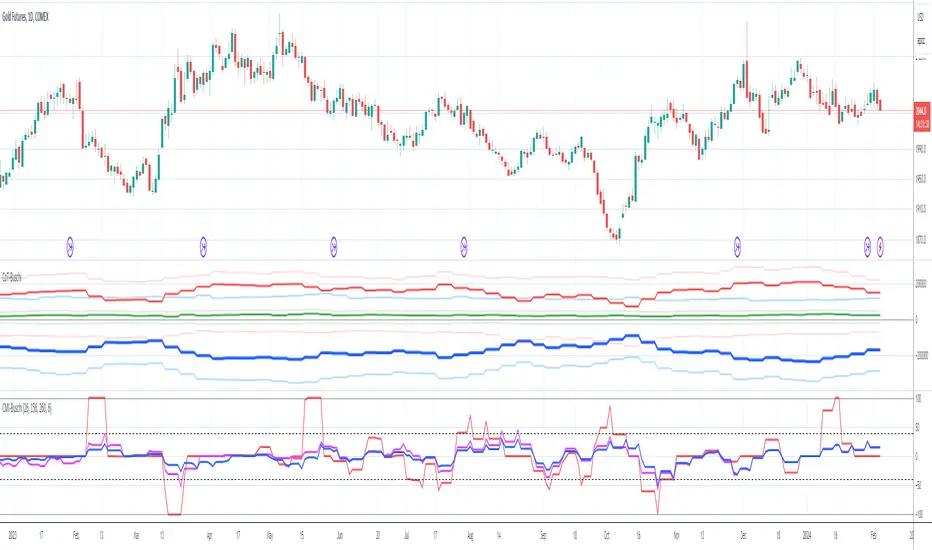
Commercial Short IndexThis script takes the hedger (commercial short) from the COT report and normalize the chart for configurable time frames (e.g. 26 weeks, 152 weeks and 260 weeks).
Based on the "Commercial Index-Buschi" script by MagicEins.

COT Commercial Positions (Updated)
This script aims to look at the markets from a manufacturer's point of view.
Producers or large enterprises gradually sell their goods as the price increases.
Because both the amount of product and position in their hands is too high, otherwise they can not find buyers, and they have to make a safe profit.
Therefore, I have shown short positions in green and long positions in red.
Blue is the net position formed by subtracting long positions from short positions.
This script is created with the latest Quandl data number codes.
Please let me know if you see a missing or a code update.
I recommend using it in a weekly (1W) time frame.
CAUTION : Since Bitcoin producer positions are very sparse, speculative long positions have been preferred in Bitcoin.
If you're looking for Bitcoin,
select Bitcoin from the menu.
Regards.

Commercial Index-BuschiThis simple script takes a closer look at the Commercial part of the CoT (Commitment of Traders) Data. It shows thier percentual level on given time frames (default: during the last 6 months, 3 years and 5 years).
This relative perspective is often more useful than the absolute contract numbers.
