AllinOne-ADR/ATR/LoDdist./MarketCap/EPStable&EPSTTM/SMA/ShortsHi guy's,
here's my 2025 Chrismas present: coco's "all in one" script.
First, what's missing:
Institutional ownership% and increase (Use MarketBeat)
Short Percent of Float (isn't working) (Use MarketBeat)
IBD EPS Ranking (Use IBD with an LLM)
Insider ownership % (Use MarketBeat)
Daily Volume (use another script)
VRVP (use another script)
RSI (use another script)
OVB (use another script)
Even if you follow the “keep it simple” approach and avoid using too many indicators, this one can consolidate several key metrics in one place.
a quarterly EPS/Sales table (Table or HeadBand mode) with earnings-event arrows
a mini stats table (ADR%/ATR/LoD dist./Market Cap/EPS TTM × multiple)
an SMA bundle
an integrated Shorts module (short-volume/short-interest metrics).
Long explanation:
This is a consolidated Pine Script v6 overlay indicator built from four functional blocks that run together in one script.
It plots a full quarterly fundamentals dashboard and optionally prints earnings markers on the chart. It pulls EPS (actual, standardized fallback, and estimates) via request.earnings() and revenue plus related fields via request.financial(). A quarter “event” is detected by changes in actual/standardized/estimate series, then historical values are reconstructed with ta.valuewhen() so the script can display multiple past quarters even if the chart timeframe is not quarterly. From those reconstructed series it calculates YoY EPS % change (MarketSurge/MarketSmith style), optional QoQ EPS % change, EPS surprise %, the same set for sales, and optional Gross Margin and ROE series. It supports display quirks such as “#” labeling when the YoY base quarter was negative, capping at ±999%, “avoid N/A” behavior, and a compare mode that prints “current vs year-ago” values inside cells.
The fundamentals are rendered into tables with two presentation modes. The “Table” mode is a larger multi-row quarterly grid showing date (MMM-yy), EPS, EPS % change, optional QoQ, optional surprise, sales (scaled to M or B), sales % change, optional QoQ, optional surprise, and optional GM/ROE columns. The “HeadBand” mode builds a compact daily-style panel for the most recent quarters with merged header cells and aligned text, intended for non-weekly timeframes. Both modes use configurable sizing, borders, frame width, and MarketSmith/MarketSurge styling presets.
On earnings-event bars it can place triangle labels beneath the price bars. The label can show EPS only or EPS plus sales, can switch between YoY and QoQ depending on the toggle, and colors the text based on positive/negative performance.
A separate mini stats table prints quick trading context metrics: ADR% (range/close over N daily bars), daily ATR (Wilder), LoD distance as a percent of daily ATR, market cap computed from outstanding shares times price (scaled K/M/B/T), and EPS TTM multiplied by a configurable x-multiple (default x20), where EPS TTM is the sum of the last four reported quarters reconstructed from the same earnings-event logic. This table is intended to stay fixed in a standard corner location and update only on the last bar.
The script also includes an SMA bundle that can plot up to ten simple moving averages, with optional computation forced to daily bars for consistency across intraday charts. Each SMA line is conditionally colored based on whether price is above or below the SMA.
Finally, it includes a Shorts block (the “Short Volume Stamper” section). That module is responsible for short-related metrics (short volume/ratio style outputs) and is integrated as an additional feature section within the same indicator rather than a separate script.
Credit goes to the following excellent works, which helped me compile this script:
Fred6724 for the EPS table:
TheScrutiniser for the ADR/ATR/LoD/MarketCap:
stocksinboxx for the SMA layout:
Hope this helps. I’d been looking for this for a while and couldn’t find it, so I combined several scripts into one. Please let me know if you spot any mistakes. Wishing you all some boring trading sessions!
Charts
VWAP Divergence | Flux ChartsThe VWAP Divergence indicator aims to find divergences between price action and the VWAP indicator. It uses filters to filter out many of the false divergences and alert high quality, accurate signals.
Red dots above the candle represent bearish divergences, while green dots below the candle represent bullish divergences.
The main filter for divergences focuses on ATR and the price movement in the past candles up to the lookback period. Divergences are determined when a price movement over the lookback period is sharp enough to be greater/less than the ATR multiplier multiplied by the ATR.
Settings
Under "Divergence Settings", both the lookback period and ATR multiplier can be adjusted.
Due to the nature of the calculations, the ATR multiplier and the lookback period should be set lower on higher time frames. As price movements become more averaged, for example on the 15 minute chart, sharp price movements happen less frequently and are often contained in fewer candles as they happen on lower time frames. Less volatile stocks such as KO, CL, or BAC should also use lower ATR multipliers and lower lookback periods.
Under "Visual Settings", you can change the color of the VWAP line, show alternating VWAP colors, adjust divergence signal size, and show the VWAP line.
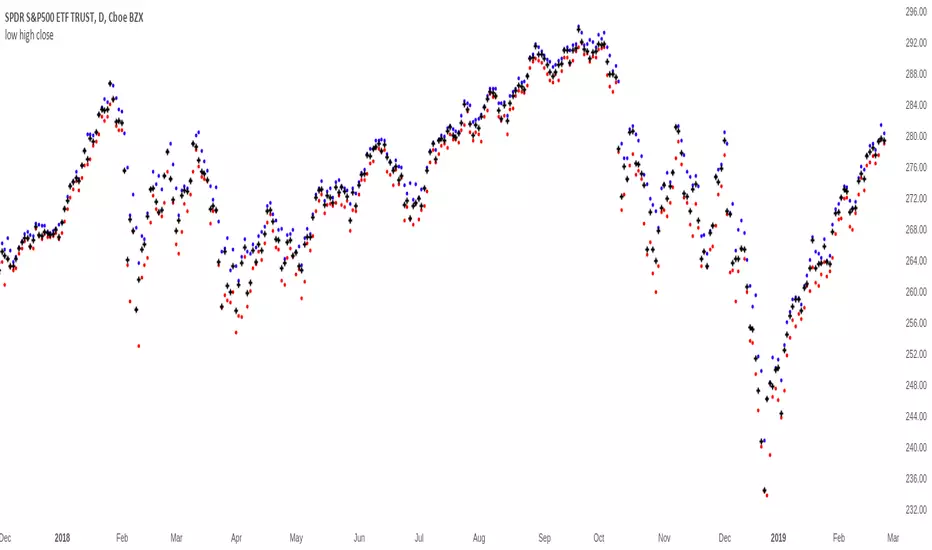
HA,Renko, Linebreak,Kagi and Average all Charts Layouts in One This is an educational study, using the security functions provided by @PineCoders(big thanks to them for creating this ) in order to see the difference between multiple candle close plots using:
Heikin Ashi
Renko
Linebreak
Kagi
Average of them all.
Both the different securities and the average can be used as a source for different indicators like moving averages or oscillators getting with them some new and unique opportunities.
If you have any questions, let me know !
UCSgears_Transaction Valuation IndexHere is the Version 2 of the TVI indicator posted earlier.
This is inspired from the Value Charts Indicator.
Version 1


