Edri Extreme Points Buy & SellEDRI EXTREME POINTS BUY & SELL INDICATOR
This Buy and Sell (non-repainting) indicator uses signals based on the combined CCI/Momentum and RSI indicators and optional regular divergence.
The idea of the indicator is to look for a potential reversal after the price reached extreme points (overbought or oversold) and signals an entry when the price shows signs of momentum for reversal.
Optionally, it considers finding a divergence while RSI is at the extreme levels to improve the predictability of a possible reversal.
Additionally, the indicator includes a simple Mean Reversion visual on the chart to assist users in identifying extreme price levels and potential reversal opportunities. It features upper and lower bands that can be optionally plotted, showing calculated values where price bounces at those extreme levels.
The purpose of these bands is to help traders avoid getting trapped in the middle of a trend and to guide them to buy low and sell high. (It's important to note that this is purely a visual aid and does not impact the generation of trade signals.)
By utilizing the Mean Reversion bands alongside the entry conditions, traders can gain insights into potential price reversals and make more informed decisions about when to enter or exit trades.
Buy and Sell Entry conditions:
• The indicator looks at the CCI/Momentum indicator to turn positive (if buy) or negative (if sell) after the RSI was overbought or oversold in the recent past.
• It also checks if there is a 3-period regular bullish divergence in the RSI (if buy), or regular bearish divergence (if sell) and consider these in the entry condition.
• If these conditions are met, this indicator suggests that it may be a good time to enter a trade.
In summary this is how this indicator works:
• The indicator takes input settings such as the choice between using CCI or Momentum as the entry signal source, length parameters for CCI/Momentum, RSI levels for overbought and oversold conditions, RSI length, and options to plot mean reversion bands on the chart.
• It calculates the CCI and Momentum and RSI values based on user-defined length..
• It checks for regular bullish and bearish divergences (3 periods) in the RSI if the option is enabled.
• The script plots shapes on the chart to indicate the buy and sell signals based on the entry conditions.
• If the mean reversion bands option is enabled, it calculates the mean reversion, standard deviation, upper band, and lower band values.
• It also plots the upper band, mean reversion line, and lower band on the chart if the mean reversion bands option is enabled.
• This indicator includes alert conditions to generate alerts for the buy and sell signals.
• On top of that, users can opt to use only one alert for both buy and sell signals. (This can save Trading view subscribers with limited alerts.)
Important! Please do not consider everything you read here as financial advice. Additionally, do not rely solely on indicators for making your trading decisions. It is important to note that no indicator or strategy is perfect. Therefore, it is always recommended to backtest everything and practice proper risk management.
I appreciate your feedback on this indicator. As I am new to script development, I am open to comments and suggestions to improve it. If you encounter any issues while using this indicator, please let me know in the comments section. If you find it helpful, I kindly ask for your support in boosting it. Thank you for your cooperation.
Oscylatory skupione

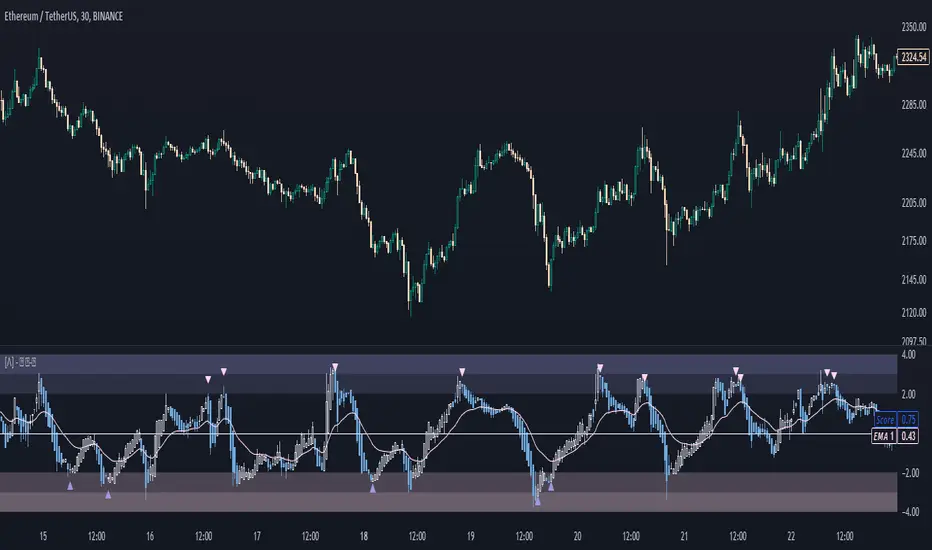
Price Exhaustion IndicatorThe Price Exhaustion Indicator (PE) is a powerful tool designed to identify trends weakening and strengthening in the financial markets. It combines the concepts of Average True Range (ATR), Moving Average Convergence Divergence (MACD), and Stochastic Oscillator to provide a comprehensive assessment of trend exhaustion levels. By analyzing these multiple indicators together, traders and investors can gain valuable insights into potential price reversals and long-term market highs and lows.
The aim of combining the ATR, MACD, and Stochastic Oscillator, is to provide a comprehensive analysis of trend exhaustion. The ATR component helps assess the volatility and range of price movements, while the MACD offers insights into the convergence and divergence of moving averages. The Stochastic Oscillator measures the current price in relation to its range, providing further confirmation of trend exhaustion. The exhaustion value is derived by combining the MACD, ATR, and Stochastic Oscillator. The MACD value is divided by the ATR value, and then multiplied by the Stochastic Oscillator value. This calculation results in a single exhaustion value that reflects the combined influence of these three indicators.
Application
The Price Exhaustion Indicator utilizes a unique visual representation by incorporating a gradient color scheme. The exhaustion line dynamically changes color, ranging from white when close to the midline (40) to shades of purple as it approaches points of exhaustion (overbought at 100 and oversold at -20). As the exhaustion line approaches the color purple, this represents extreme market conditions and zones of weakened trends where reversals may occur. This color gradient serves as a visual cue, allowing users to quickly gauge the strength or weakness of the prevailing trend.
To further enhance its usability, the Price Exhaustion Indicator also includes circle plots that signify potential points of trend reversion. These plots appear when the exhaustion lines cross or enter the overbought and oversold zones. Red circle plots indicate potential short entry points, suggesting a weakening trend and the possibility of a downward price reversal. Conversely, green circle plots represent potential long entry points, indicating a strengthening trend and the potential for an upward price reversal.
Traders and investors can leverage the Price Exhaustion Indicator in various ways. It can be utilized as a trend-following tool, or a mean reversion tool. When the exhaustion line approaches the overbought or oversold zones, it suggests a weakening trend and the possibility of a price reversal, helping identify potential market tops and bottoms. This can guide traders in timing their entries or exits in anticipation of a trend shift.
Utility
The Price Exhaustion Indicator is particularly useful for long-term market analysis, as it focuses on identifying long-term market highs and lows. By capturing the gradual weakening or strengthening of a trend, it assists investors in making informed decisions about portfolio allocation, trend continuation, or potential reversals.
In summary, the Price Exhaustion Indicator is a comprehensive and visually intuitive tool that combines ATR, MACD, and Stochastic Oscillator to identify trend exhaustion levels. By utilizing a gradient color scheme and circle plots, it offers traders and investors valuable insights into potential trend reversals and long-term market highs and lows. Its unique features make it a valuable addition to any trader's toolkit, providing a deeper understanding of market dynamics and assisting in decision-making processes. Please note that future performance of any trading strategy is fundamentally unknowable, and past results do not guarantee future performance.

Savitzky-Golay Filtered Chande Momentum OscillatorThe Savitzky-Golay Filtered Chande Momentum Oscillator (SGCMO) is a modified version of the Chande Momentum Oscillator that functions as a powerful analytical tool, capable of detecting trends and mean reversals. By applying a Savitzky-Golay filter to the price data, the oscillator provides enhanced visualization and smoother readings. (credit to © anieri for the Savitzky-Golay filter code: www.tradingview.com)
Chande Momentum Oscillator
The Chande Momentum Oscillator (CMO) is a technical indicator developed by Tushar Chande. It measures the momentum of an asset's price movement and provides insights into the overbought or oversold conditions of the market. The CMO calculates the difference between the sum of positive price changes and the sum of negative price changes over a specified period, and then normalizes it to a scale between -100 and +100. Traders and investors use the CMO to identify potential trend reversals, confirm the strength of a current trend, and generate buy or sell signals.
Smoothing
The Savitzky-Golay filter is a digital filter commonly employed for smoothing and noise reduction in time-series data. In the context of the SGCMO, the aim is to effectively smooth the CMO values, reducing the impact of short-term fluctuations and providing clearer insights into underlying trends. Additionally, an exponential moving average (EMA) filter is applied to further reduce noise and enhance trend visibility. This filtered CMO indicator may provide traders and investors with a clearer and more refined representation of momentum changes in the underlying asset, helping them make more informed trading decisions.
Application
The SGCMO serves as both a trend-following and mean-reversion tool. Traders can track the current trend using bullish white lines or bearish orange lines in trending markets. Alternatively, they can utilize green and red vertical lines, which indicate price retracement and help capture pullbacks and reversals. Green vertical lines appear when the trend reverses upwards in an oversold zone (-50 to -80), while red vertical lines indicate negative trend reversals in an overbought zone (50 to 80). Opening long positions when green and white lines appear, or short positions when red and orange lines are visible, can be considered. However, it is advisable to combine this indicator with other complementary technical analysis tools and incorporate it into a comprehensive trading strategy to maximize its effectiveness.

RSI with SMA and DisplacementThis RSI contains SMA 50 (which can be edited). Same SMA Line is displaced 10 rsi points above and below.
One can study crossing of rsi with these lines and where rsi taking support or experiencing resistance on these lines and build unique strategy.

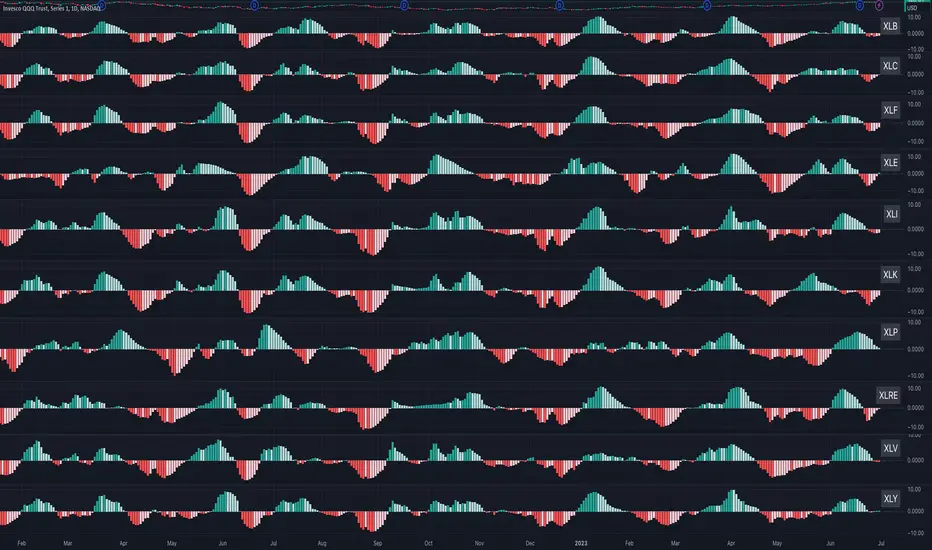
Sector MomentumThis indicator shows the momentum of a market sector. Under the hood, it's the MACD of the number of stocks above their 20 SMA in a specific sectors. The best insight it gives is to tell if the market is doing a sector rotation or having a full blown correction.
Users have the options to choose a specific sector out of the 11 sectors:
XLB, XLC, XLE, XLF, XLI, XLK, XLP, XLRE, XLU, XLV, XLY or show all them them by adding multiple indicators.
Use this indicator similar to MACD to look for momentum acceleration, deceleration and turn in a sector. More importantly, users can open up the indicator for all sectors and then compare between each.
Examples:
1. When we see momentum slows down in XLP and turn of XLK, it's a sign of sector rotation from consumer staple to tech. Money is going from defensive to riskier assets. Market is leaning towards risk-on mode. Stocks in tech have higher probability to outperform those in consumer staple.
2. When we see momentum subside across all sectors all at once or one by one, particularly both XLP, XLK/XLY, we'd expect market breadth is taking a hit across all sectors. This is not a sector rotation. A short to mid term market correction or drawdown is very likely.
Filtered Momentum Indicator (FMI)The Filtered Momentum Indicator (FMI) is a tool created to assist traders in identifying changes in momentum and gaining insights into potential shifts in price trends. By combining the concepts of momentum and Bollinger Bands, the FMI offers a unique perspective on momentum values and their relationship to price movements, helping traders make informed trading decisions. The FMI is calculated using two main components:
-- Momentum Calculation : Momentum measures the strength and velocity of price changes. It is calculated by comparing the current price to the price 14 (default) periods ago and expressing it as a percentage.
-- Bollinger Bands Calculation : Bollinger Bands are based on the momentum values and provide a range within which the momentum is expected to fluctuate. The upper and lower bands are determined using a specified period (default of 20) and deviations (default of 2.0).
The FMI consists of two lines : F+ (Filtered Plus) and F- (Filtered Minus). These lines help gauge the strength of bullish and bearish momentum:
-- F+ represents the difference between the upper Bollinger Band and the momentum values. It indicates the strength of bullish momentum. F+ is colored aqua.
-- F- represents the difference between the momentum values and the lower Bollinger Band. It indicates the strength of bearish momentum. F- is colored yellow.
When analyzing the FMI, pay attention to the relationship between F+ and F-:
-- If F- is greater than F+ , it suggests potential bullish momentum, indicating that prices may have room to rise.
-- If F+ is greater than F- , it suggests potential bearish momentum, indicating that prices may have room to decline.
Coloration of the FMI enhances its interpretability - when F- is greater than F+, the indicator color is set to lime (green), signaling potential bullish momentum; when F+ is greater than F-, the indicator color is set to fuchsia (purple), signaling potential bearish momentum.
The FMI can be applied in various ways for trading strategies:
-- Identifying Potential Reversals : Watch for crossovers between the F- and F+ lines, as they may indicate a potential shift in momentum and offer opportunities to enter or exit trades.
-- Confirmation Tool : Combine the FMI with other technical indicators or price patterns to validate potential trend reversals or continuations. By aligning signals from different indicators, you can strengthen your trading decisions.
-- Trade Timing : Consider taking trades in the direction of the dominant FMI color. When the indicator shows strong bullish momentum (F- > F+), consider going long. Conversely, when it shows strong bearish momentum (F+ > F-), consider going short.
It is essential to be aware of the limitations of the FMI:
-- False Signals : The FMI, like any indicator, may generate false signals, especially during low volatility or choppy market conditions. Always use the FMI in conjunction with other analysis techniques for confirmation.
-- Lagging Nature : The FMI relies on historical price data, causing it to lag behind sudden market moves. Keep in mind that the FMI provides insights based on past momentum and may not capture immediate changes in market conditions.
By combining momentum and Bollinger Bands, this indicator provides a unique perspective for making informed trading decisions. Utilize the FMI in conjunction with other analysis techniques, considering its limitations, to enhance your trading strategy and improve decision-making.

RSI MACDDifferent Perspective : By using the RSI as the source for MACD calculation, you are incorporating the RSI's characteristics into the MACD indicator. The RSI measures the speed and change of price movements, while the MACD focuses on the convergence and divergence of moving averages. Combining these two indicators may provide a different perspective on market conditions.
Smoothed MACD : Since the RSI is being used as the source for the MACD calculation, the resulting MACD line (macd1 in the code) may exhibit smoother movements compared to a traditional MACD calculated directly from price data. This smoothing effect could potentially help filter out noise and provide a clearer representation of trend changes.
RSI Confirmation : The RSI is often used to identify overbought and oversold conditions. By incorporating the RSI into the MACD calculation, you can potentially gain additional confirmation when the MACD line crosses above or below zero. For example, if the MACD line crosses above zero and the RSI is in an oversold region, it could provide stronger confirmation for a bullish signal.
Example:

Z-Score Heikin-Ashi TransformedThe Z-Score Heikin-Ashi Transformed (𝘡 𝘏-𝘈) indicator is a powerful technical tool that combines the principles of Z-Score and Heikin Ashi to provide traders with a smoothed representation of price movements and a standardized measure of market volatility.
The 𝘡 𝘏-𝘈 indicator applies the Z-Score calculation to price data and then transforms the resulting Z-Scores using the Heikin Ashi technique. Understanding the individual components of Z-Score and Heikin Ashi will provide a foundation for comprehending the methodology and unique features of this indicator.
Z-Score:
Z-Score is a statistical measure that quantifies the distance between a data point and the mean, relative to the standard deviation. It provides a standardized value that allows traders to compare different data points on a common scale. In the context of the 𝘡 𝘏-𝘈 indicator, Z-Score is calculated based on price data, enabling the identification of extreme price movements and the assessment of their significance.
Heikin Ashi:
Heikin Ashi is a popular charting technique that aims to filter out market noise and provide a smoother representation of price trends. It involves calculating each candlestick based on the average of the previous candle's open, close, high, and low prices. This approach results in a chart that reduces the impact of short-term price fluctuations and reveals the underlying trend more clearly.
Methodology:
The 𝘡 𝘏-𝘈 indicator starts by calculating the Z-Score of the price data, which provides a standardized measure of how far each price point deviates from the mean. Next, the resulting Z-Scores are transformed using the Heikin Ashi technique. Each Z-Score value is modified according to the Heikin Ashi formula, which incorporates the average of the previous Heikin Ashi candle's open and close prices. This transformation smooths out the Z-Score values and reduces the impact of short-term price fluctuations, providing a clearer view of market trends.
This tool enables traders to identify significant price movements and assess their relative strength compared to historical data. Positive transformed Z-Scores indicate that prices are above the average, suggesting potential overbought conditions, while negative transformed Z-Scores indicate prices below the average, suggesting potential oversold conditions. Traders can utilize this information to identify potential reversals, confirm trend strength, and generate trading signals.
Utility:
The indicator offers valuable insights into price volatility and trend analysis. By combining the standardized measure of Z-Score with the smoothing effect of Heikin Ashi, traders can make more informed trading decisions and improve their understanding of market dynamics. 𝘡 𝘏-𝘈 can be used in various trading strategies, including identifying overbought or oversold conditions, confirming trend reversals, and establishing entry and exit points.
Note that the 𝘡 𝘏-𝘈 should be used in conjunction with other technical indicators and analysis tools to validate signals and avoid false positives. Additionally, traders are encouraged to conduct thorough backtesting and experimentation with different parameter settings to optimize the effectiveness of the indicator for their specific trading approach.
Key Features:
Optional Reversion Doritos
Adjustable Reversion Threshold
2 Adjustable EMAs
Example Charts:
See Also:
On Balance Volume Heikin-Ashi Transformed
Momentum Oscillator, Divergences & Signals [TrendAlpha]The "Momentum, Real Time Divergences & Signals " indicator is designed to provide traders with insights into market momentum, identify potential divergences, and generate buy and sell signals. It offers a comprehensive set of features to assist traders in making informed trading decisions.
The indicator starts by calculating the momentum oscillator based on user-defined parameters.
- Traders can adjust the "Length" parameter to customize the sensitivity of the oscillator. The default value is set to 7, but it can be modified according to individual preferences.
- The "Source" parameter allows traders to select the input source for the oscillator calculation, with the default being the closing price of the asset.
- Traders have the option to display divergence lines by switching on the "Show Lines" parameter. This feature helps identify potential divergences between the oscillator and the price.
The oscillator is calculated using a two-step process. First, a smoothing function is applied to the source data using the "sma" (simple moving average) function. Then, the rate of change is computed over the specified length using the "mom" (momentum) function. Positive oscillator values indicate upward momentum, while negative values indicate downward momentum.
The indicator also generates buy and sell signals by identifying bullish and bearish divergences. A bullish divergence occurs when the oscillator is negative and crosses above zero, while a bearish divergence occurs when the oscillator is positive and crosses below zero. The indicator checks for specific conditions to confirm the divergences, such as comparing the current oscillator value with the previous value and validating the corresponding price action.
When a bullish or bearish divergence is detected, the indicator plots circles to highlight these signals on the chart. A green circle indicates a bullish signal, suggesting a potential buying opportunity, while a red circle indicates a bearish signal, suggesting a potential selling opportunity. In addition to circles, the indicator also displays labels to provide further clarity on the signals. A "Buy" label is shown for bullish signals, and a "Sell" label is shown for bearish signals.
To visually represent the divergences, the indicator plots lines connecting the corresponding points on the oscillator. A green line is drawn for bullish divergences, while a red line is drawn for bearish divergences. Traders can easily observe the divergence patterns and their relationships with the price action, aiding them in making trading decisions.
- The indicator also includes alert conditions for both bullish and bearish divergences. Traders can set up alerts to receive notifications when potential divergences occur, allowing them to take timely action.

Rough AverageThe Rough Average indicator is a unique technical tool that calculates a modified average to provide insights into market conditions. It incorporates a combination of mathematical operations and existing indicators to offer traders a different perspective on price movements.
The Rough Average indicator aims to capture market dynamics through a specific calculation method. It utilizes two main components: a check for the approximate scale of the price and a profile calculation based on the Relative Strength Index (RSI) of the closing price.
Methodology:
Approximate Scale: The indicator determines the approximate scale of the price by analyzing the magnitude of the closing price. This step involves a mathematical process that identifies the power of 10 that best represents the scale. This function reduces overall lag and gives a better smoothing to the output of the calculation
Profile Calculation: The indicator calculates a profile value by summing the absolute values of the RSI of the closing price over a specified period. The RSI provides insights into the strength or weakness of price movements. The profile calculation considers a range of prices based on the determined scale.
Indicator Calculation:
The Rough Average is derived by applying the Exponential Moving Average (EMA) to the calculated profile. The EMA is a smoothing technique that emphasizes recent price data. The resulting value represents the modified average of the indicator.
Utility:
The Rough Average indicator offers traders an alternative perspective on market conditions. By utilizing a modified average calculation, it can reveal potential trends, reversals, or periods of market strength or weakness. Traders can use the Rough Average to complement their analysis and identify possible trading opportunities.
It is important to note that the effectiveness of the Rough Average indicator may vary depending on the specific market and trading strategy. It is recommended to combine its analysis with other technical indicators and conduct thorough testing before making trading decisions.
Key Features:
Customizable OB\OS Levels
Bar coloring methods: Trend, Reversions, Extremities
Example Charts:

Ta StrategyHello guys
This script follows traditional technical indicators
MACD, ADX, RSI and pivot points
If the price is above the resistance and the MACD has crossover ,and the RSI 14 is above 50
ADX is higher than 20, and DI+ is higher than DI-. This is a buy signal and vice versa for a sell signal
The script moves the stop loss to the entry price after the first target is reached
You can specify the quantity you want to sell when the price reaches the first target
There are also options like if you want the script to entry long or short, or both
you can reverse the strategy if it does not work well
If you want to inquire about any details, please let me know in the comments

ATR Momentum [QuantVue]ATR Momentum is a dynamic technical analysis tool designed to assess the momentum of a securities price movement. It utilizes the comparison between a faster short-term Average True Range (ATR) and a slower long-term ATR to determine whether momentum is increasing or decreasing.
This indicator visually represents the momentum relationship by plotting both ATR values as lines on a chart and applying color fill between the lines based on if momentum is increasing or decreasing.
When the short-term ATR is greater than the long-term ATR, representing increasing momentum, the area between them is filled with green.
Conversely, when the short-term ATR is less than the long-term ATR line, the area between them is filled with red. This red fill indicates decreasing momentum.
Don't hesitate to reach out with any questions or concerns.
We hope you enjoy!
Cheers.

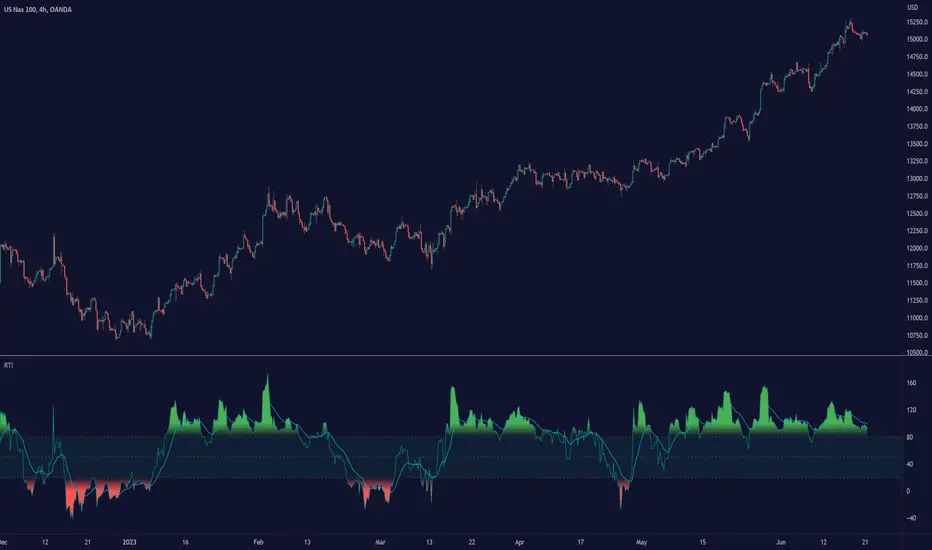
Relative Trend Index (RTI) by Zeiierman█ Overview
The Relative Trend Index (RTI) developed by Zeiierman is an innovative technical analysis tool designed to measure the strength and direction of the market trend. Unlike some traditional indicators, the RTI boasts a distinctive ability to adapt and respond to market volatility, while still minimizing the effects of minor, short-term market fluctuations.
The Relative Trend Index blends trend-following and mean-reverting characteristics, paired with a customizable and intuitive approach to trend strength, and its sensitivity to price action makes this indicator stand out.
█ Benefits of using this RTI instead of RSI
The Relative Strength Index (RSI) and the Relative Trend Index (RTI) are both powerful technical indicators, each with its own unique strengths.
However, there are key differences that make the RTI arguably more sophisticated and precise, especially when it comes to identifying trends and overbought/oversold (OB/OS) areas.
The RSI is a momentum oscillator that measures the speed and change of price movements and is typically used to identify overbought and oversold conditions in a market. However, its primary limitation lies in its tendency to produce false signals during extended trending periods.
On the other hand, the RTI is designed specifically to identify and adapt to market trends. Instead of solely focusing on price changes, the RTI measures the relative positioning of the current closing price within its recent range, providing a more comprehensive view of market conditions.
The RTI's adaptable nature is particularly valuable. The user-adjustable sensitivity percentage allows traders to fine-tune the indicator's responsiveness, making it more resilient to sudden market fluctuations and noise that could otherwise produce false signals. This feature is advantageous in various market conditions, from trending to choppy and sideways-moving markets.
Furthermore, the RTI's unique method of defining OB/OS zones takes into account the prevailing trend, which can provide a more precise reflection of the market's condition.
While the RSI is an invaluable tool in many traders' toolkits, the RTI's unique approach to trend identification, adaptability, and enhanced definition of OB/OS zones can provide traders with a more nuanced understanding of market conditions and potential trading opportunities. This makes the RTI an especially powerful tool for those seeking to ride long-term trends and avoid false signals.
█ Calculations
In summary, while simple enough, the math behind the RTI indicator is quite powerful. It combines the quantification of price volatility with the flexibility to adjust the trend sensitivity. It provides a normalized output that can be interpreted consistently across various trading scenarios.
The math behind the Relative Trend Index (RTI) indicator is rooted in some fundamental statistical concepts: Standard Deviation and Percentiles.
Standard Deviation: The Standard Deviation is a measure of dispersion or variability in a dataset. It quantifies the degree to which each data point deviates from the mean (or average) of the data set. In this script, the standard deviation is computed on the 'close' prices over a specified number of periods. This provides a measure of the volatility in the price over that period. The higher the standard deviation, the more volatile the price has been.
Percentiles: The percentile is a measure used in statistics indicating the value below which a given percentage of observations in a group falls. After calculating the upper and lower trends for the last 'length' periods and sorting these values, the script uses the 'Sensitivity ' parameter to extract percentiles from these sorted arrays. This is a powerful concept because it allows us to adjust the sensitivity of our signals. By choosing different percentiles (controlled through the 'Sensitivity' parameter), we can decide whether we want to react only to extreme events (high percentiles) or be more reactive and consider smaller deviations from the norm as significant (lower percentiles).
Finally, the script calculates the Relative Trend Index value, which is essentially a normalized measure indicating where the current price falls between the upper and lower trend values. This simple ratio is incredibly powerful as it provides a standardized measure that can be used across different securities and market conditions to identify potential trading signals.
Core Components
Trend Data Count: This parameter denotes the number of data points used in the RTI's calculation, determining the trend length. A higher count captures a more extended market view (long-term trend), providing smoother results that are more resistant to sudden market changes. In contrast, a lower count focuses on more recent data (short-term trend), yielding faster responses to market changes, albeit at the cost of increased susceptibility to market noise.
Trend Sensitivity Percentage: This parameter is employed to select the indices within the trend arrays used for upper and lower trend definitions. By adjusting this value, users can affect the sensitivity of the trend, with higher percentages leading to a less sensitive trend.
█ How to use
The RTI plots a line that revolves around a mid-point of 50. When the RTI is above 50, it implies that the market trend is bullish (upward), and when it's below 50, it indicates a bearish (downward) trend. Furthermore, the farther the RTI deviates from the 50 line, the stronger the trend is perceived to be.
Bullish
Bearish
The RTI includes user-defined Overbought and Oversold levels. These thresholds suggest potential trading opportunities when they are crossed, serving as a cue for traders to possibly buy or sell. This gives the RTI an additional use case as a mean-reversion tool, in addition to being a trend-following indicator.
In short
Trend Confirmation and Reversals: If the percentage trend value is consistently closer to the upper level, it can indicate a strong uptrend. Similarly, if it's closer to the lower level, a downtrend may be in play. If the percentage trend line begins to move away from one trend line towards the other, it could suggest a potential trend reversal.
Identifying Overbought and Oversold Conditions: When the percentage trend value reaches the upper trend line (signified by a value of 1), it suggests an overbought condition - i.e., the price has been pushed up, perhaps too far, and could be due for a pullback, or indicating a strong positive trend. Conversely, when the percentage trend value hits the lower trend line (a value of 0), it indicates an oversold condition - the price may have been driven down and could be set to rebound, or indicate a strong negative trend. Traders often use these overbought and oversold signals as contrarian indicators, considering them potential signs to sell (in overbought conditions) or buy (in oversold conditions). If the RTI line remains overbought or oversold for an extended period, it indicates a strong trend in that direction.
█ Settings
One key feature of the RTI is its configurability. It allows users to set the trend data length and trend sensitivity.
The trend data length represents the number of data points used in the trend calculation. A longer trend data length will reflect a more long-term trend, whereas a shorter trend data length will capture short-term movements.
Trend sensitivity refers to the threshold for determining what constitutes a significant trend. High sensitivity levels will deem fewer price movements as significant, hence making the trend less sensitive. Conversely, low sensitivity levels will deem more price movements as significant, hence making the trend more sensitive.
-----------------
Disclaimer
The information contained in my Scripts/Indicators/Ideas/Algos/Systems does not constitute financial advice or a solicitation to buy or sell any securities of any type. I will not accept liability for any loss or damage, including without limitation any loss of profit, which may arise directly or indirectly from the use of or reliance on such information.
All investments involve risk, and the past performance of a security, industry, sector, market, financial product, trading strategy, backtest, or individual's trading does not guarantee future results or returns. Investors are fully responsible for any investment decisions they make. Such decisions should be based solely on an evaluation of their financial circumstances, investment objectives, risk tolerance, and liquidity needs.
My Scripts/Indicators/Ideas/Algos/Systems are only for educational purposes!
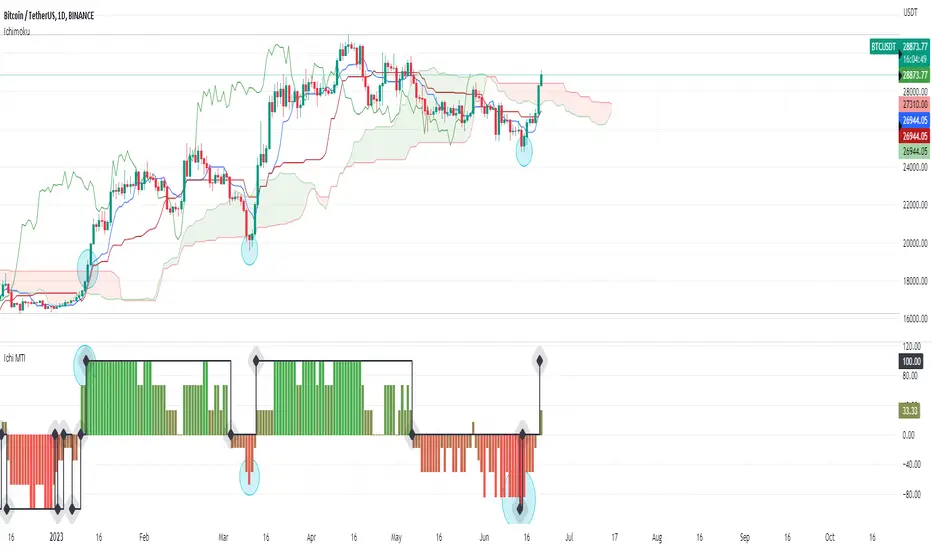
Ichimoku Cloud Momentum & Trend Indicator «NoaTrader»If you like Ichimoku cloud and use it in your analysis, or you are new to it and sometimes gets tricky to figure out all the details, this indicator tries to simplify that and visualize the change of trend and momentum relative to the past based on ichimoku.
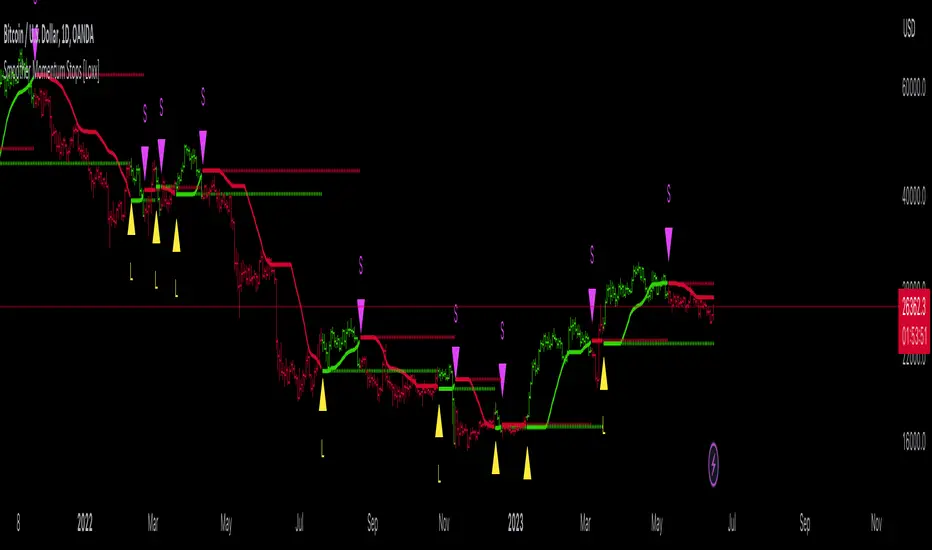
The RED/GREEN columns are showing momentum strength while the black diamond line suggests the trend change. The conditions are simple enough to check them out on the script.
As you can see highlighted cyan circles on the chart as major important signals on the chart of Bitcoin daily timeframe.
This script tries to be complementary to the ichimoku cloud itself and cannot replace the levels represented by the cloud on chart.
Smoother Momentum Stops [Loxx]Smoother Momentum Stops (SMS) is a dynamic tool that combines the logic of momentum and moving averages to create an overlay of the market price and generate potential trade signals. The original idea for this indicator comes from the beloved and esteemed trading indicator guru Mladen Rakic.
Understanding the Framework
The SMS incorporates various aspects of technical analysis, including momentum calculation, several types of moving averages, and an intelligent stop-and-reverse system that determines when to enter and exit trades.
The indicator initiates by defining the color scheme for visualization, specifically green for bullish trends and red for bearish trends. It further utilizes the 'smmom' and 'fema' functions to calculate smoothed momentum and fast exponential moving averages, respectively. The values computed by these functions are central to the signal generation process.
Momentum Calculation
The 'smmom' function serves to calculate a smoother momentum by taking a source (such as the closing price) and a period as inputs. This function employs a complex algorithm involving exponential moving averages (EMA), wherein two EMAs are calculated with different smoothing factors, and the difference between the two results is returned as the output. This smooth momentum calculation assists in eliminating unnecessary noise from the market and delivers more reliable momentum readings.
Moving Averages Computation
One key feature of the SMS is the ability to select from five different moving average types: Exponential Moving Average (EMA), Fast Exponential Moving Average (FEMA), Linear Weighted Moving Average (LWMA), Simple Moving Average (SMA), and Smoothed Moving Average (SMMA). The 'variant' function assigns the chosen method to the '_avg' variable, which is then used in the trade signal logic.
Trade Signal Generation
SMS employs a complex yet robust mechanism for generating trade signals. A stop-and-reverse system is established, which works on the principle of momentum. If the smoothed momentum is positive, an upper stop is determined and if the momentum is negative, a lower stop is defined.
The process continues by defining long and short entry conditions. The indicator goes long when an upper stop exists, and the previous bar had a lower stop, signifying a shift in momentum. The short entry condition is the opposite: the indicator goes short when a lower stop exists, and the previous bar had an upper stop. Alerts are generated for each of these conditions, helping traders to take timely action.
Visual Representation and UI Options
In terms of visual representation, the indicator plots upper and lower stops, employing green color for upper and red for lower stops. If the option to color bars is chosen, the entire bar is colored green or red, based on whether an upper or lower stop exists. This feature allows traders to visually comprehend market conditions better. Support and reisstance levels are also provided for visual context.
Conclusion
The Smoother Momentum Stops indicator is a potent tool for traders seeking to optimize their trading strategies. It blends the fundamentals of momentum and moving averages, resulting in a robust system that provides clear, reliable, and timely trading signals. By adjusting the smoothing type and period parameters, traders can customize the indicator to fit various market conditions and asset types, thereby adding a layer of flexibility to their trading strategies.
The use of a stop-and-reverse system adds a layer of risk management by offering precise entry and exit points based on momentum shifts. These stops are not just mere levels of entries or exits, but they reflect the undercurrent of the market's momentum, thus providing a dynamic framework to make informed trading decisions.
Additionally, the SMS indicator offers visual simplicity. The color-coded bars and distinct symbols for long and short positions make it easier for traders to interpret the signals and market direction quickly. Combined with the alert system, it ensures that traders never miss an important trading opportunity.
Finally, the power of the SMS indicator lies in its adaptability and comprehensive approach. By providing a selection of moving averages and an intelligent momentum-based system, it encapsulates various aspects of market behavior. As such, it is a useful tool not just for momentum traders, but for any trader who understands the significance of moving averages and momentum in predicting market movements.
In conclusion, the Smoother Momentum Stops indicator stands as an innovative, adaptable, and powerful tool for the modern trader. Its blend of flexibility, dynamic risk management, and straightforward visualization offer a comprehensive solution for traders looking to navigate the complex world of financial markets. With a detailed understanding of its workings as presented in this essay, traders can harness its full potential to optimize their strategies, manage risk, and achieve their trading objectives.
Parabolic SAR + EMA 200 + MACD SignalsParabolic SAR + EMA 200 + MACD Signals Indicator, a powerful tool designed to help traders identify optimal entry points in the market.
This indicator combines three popular technical indicators: Parabolic SAR (Stop and Reverse), EMA200 (Exponential Moving Average 200) and MACD (Moving Average Convergence Divergence) - to provide clear and concise buy and sell signals based on market trends.
The MACD component of this indicator calculates the difference between two exponentially smoothed moving averages, providing insight into the trend strength of the market. The Parabolic SAR component helps identify potential price reversals, while the EMA200 acts as a key level of support and resistance, providing additional confirmation of the overall trend direction.
Whether you're a seasoned trader or just starting out, the MACD-Parabolic SAR-EMA200 Indicator is a must-have tool for anyone looking to improve their trading strategy and maximize profits in today's dynamic markets.
Buy conditions
The price should be above the EMA 200
Parabolic SAR should show an upward trend
MACD Delta should be positive
ُSell conditions
The price should be below the EMA 200
Parabolic SAR should show an downward trend
MACD Delta should be negative

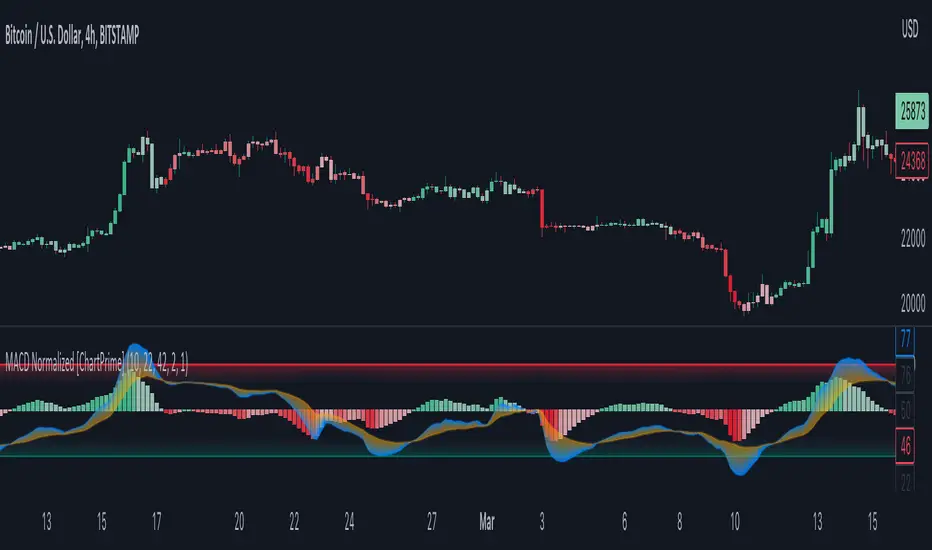
MACD Normalized [ChartPrime]Overview of MACD Normalized Indicator
The MACD Normalized indicator, serves as an asset for traders seeking to harness the power of the moving average convergence divergence (MACD) combined with the advantages of the stochastic oscillator. This novel indicator introduces a normalized MACD, offering a potentially enhanced flexibility and adaptability to numerous market conditions and trading techniques.
This indicator stands out by normalizing the MACD to its average high and average low, also factoring in the deviation of the high-low position from the mean. This approach incorporates the high and low in the calculations, providing the benefits of stochastic without its common drawbacks, such as clipping problems. As a result, the indicator becomes exceptionally versatile and suitable for various trading strategies, including both faster and slower settings.
The MACD Normalized Indicator boasts a variety of options and settings. The features include:
Enable Ribbon: Toggle the display of the ribbon accompanying the MACD Normalized, as desired.
Fast Length: Determine the movement speed of the fast line to receive advance notice of potential market opportunities.
Slow Length: Control the movement pace of the slow line for smoother signals and a comprehensive outlook on market trends.
Average Length: Specify the length used to calculate the high and low averages, providing greater control over the indicator's granularity.
Upper Deviation: Establish the extent to which the high and low values deviate from the mean, ensuring adaptability to diverse market situations.
Inner Band (Middle Deviation): Adjust the balance between the high and low deviations to create an inner band signal, giving traders a secondary level of market analysis and decision-making support.
Enable Candle Color: Enable the coloring of candles based on the MACD Normalized value for effortless visualization of trading potential.
Use Cases for the MACD Normalized Indicator
In addition to analyzing market trends and identifying potential trading opportunities, ChartPrime's MACD Normalized Indicator offers a range of applications for traders. These use cases encompass distinct trading scenarios and strategies:
Overbought and Oversold Regions
One of the key applications of the MACD Normalized Indicator is identifying overbought and oversold regions. Overbought refers to a situation where an asset's price has risen significantly and is expected to face a downturn, while oversold indicates a price drop that may subsequently lead to a reversal.
By adjusting the indicator's parameters, such as the upper and inner deviation levels, traders can set precise boundaries to determine overbought and oversold areas. When the MACD moves into the upper region, it may signal that the asset is overbought and due for a price correction. Conversely, if the MACD enters the lower region, it possibly indicates an oversold condition with the potential for a price rebound.
Signal Line Crossovers
The MACD Normalized Indicator displays two lines: the fast line and the slow line (inner band). A common trading strategy involves observing the intersection of these two lines, known as a crossover. When the fast line crosses above the slow line, it may signify a bullish trend or a potential buying opportunity. Conversely, a crossover with the fast line moving below the slow line typically indicates a bearish trend or a selling opportunity.
Divergence and Convergence
Divergence occurs when the price movement of an asset does not align with the corresponding MACD values. If the price establishes a new high while the MACD fails to do the same, a bearish divergence emerges, suggesting a potential downtrend. Similarly, a bullish divergence takes place when the price forms a new low but the MACD does not follow suit, hinting at an upcoming uptrend.
Convergence, on the other hand, is represented by the MACD lines moving closer together. This movement signifies a potential change in the trend, providing traders with a timely opportunity to enter or exit the market.
Banded Chikou Breakout — Quantifying Ichimoku MomentumTitle: Banded Chikou Breakout — Quantifying Ichimoku Momentum
Overview:
Banded Chikou Breakout (BCB) is a unique, algorithmic script designed to augment the capabilities of traders seeking substantial breakout opportunities. Constructed on the robust principles of the Ichimoku trading strategy, BCB is designed to quantify and filter the Chikou Span's significant breakouts above or below the price action. This script does not aim to replace the Ichimoku system; instead, it enhances it, providing an optimized tool for momentum trading.
Rationale:
Ichimoku traders often scrutinize the Chikou Span's position relative to price action to identify market trends. However, determining whether the Chikou Span is above or below due to a genuine trend or mere market noise can be challenging in choppy markets. BCB resolves this predicament by offering a unique way to interpret the Chikou Span's movement. It does so by quantifying the Chikou Span's momentum and utilizing Bollinger Bands to determine its significance. By effectively differentiating substantial movements from the insignificant, BCB can help traders better navigate the market and increase their potential for profitable trades.
How it Works:
BCB combines three key elements: a Momentum Script (simulating Chikou Span), a Bollinger Band Script, and a Timeframe Switcher, all working together to provide a refined trading perspective.
Momentum Script: Calculates the price difference between the current price and the price 'n' periods ago, transforming the Chikou Span into a quantifiable momentum value that signifies the strength and speed of a market move.
Bollinger Band Script: Computes a Simple Moving Average (SMA) around the momentum, plotting two 'bands' at a specified standard deviation from this SMA. This functionality allows traders to discern when the Chikou Span's momentum is abnormally high or low, signifying a potential significant breakout.
Timeframe Switcher: This feature lets traders apply the BCB script to a different timeframe from the one they are currently viewing. This capability can help traders identify higher timeframe breakouts and trade them with precision on the lower timeframe.
How to Use:
BCB is designed to complement the Ichimoku strategy for effective breakout identification.
Add the BCB script to your trading chart. It plots the momentum (yellow line) and Bollinger Bands (green lines) with the area between the bands shaded blue.
Utilize the Ichimoku strategy to identify larger and smaller timeframe trends.
Optional: Leverage the timeframe switcher to synchronize your trades with higher timeframe trends while operating on lower timeframes.
If the BCB momentum line crosses the upper Bollinger Band while the Ichimoku indicates a bullish trend, it signifies a potential significant upward breakout. Similarly, a cross below the lower band during a bearish trend could denote a significant downward breakout.
Remember, without the context provided by the Ichimoku system's trend analysis, BCB can yield false breakouts. It is, therefore, crucial to use these tools in tandem. I like to check for an Ichimoku trend on the 4H and 1H charts, and then use BCB on charts <60 minutes to capture trends with precision.

RSI-CCI Fusion StrategyRSI-CCI Fusion Strategy: Harnessing the Power of RSI and CCI
The "RSI-CCI Fusion Strategy" is a powerful trading approach that combines the strengths of the Relative Strength Index (RSI) and the Commodity Channel Index (CCI) to provide enhanced trading insights. This strategy is based on the popular "RSI & CCI Fusion + Alerts" indicator, which utilizes the RSI and CCI indicators from TradingView .
1. Overview of RSI and CCI:
The Relative Strength Index (RSI) is a widely used momentum oscillator that measures the speed and change of price movements. It helps traders identify overbought and oversold conditions in the market. On the other hand, the Commodity Channel Index (CCI) is a versatile indicator that identifies cyclical trends and provides insights into overbought and oversold levels.
2. The RSI-CCI Fusion Strategy:
The RSI-CCI Fusion Strategy harnesses the combined power of the RSI and CCI indicators to generate robust trading signals. By blending the RSI and CCI, this strategy captures both momentum and cyclical trend dynamics, offering a more comprehensive view of the market.
3. Utilizing the RSI-CCI Fusion Indicator + Alerts:
The "RSI & CCI Fusion + Alerts" indicator serves as the backbone of the RSI-CCI Fusion Strategy. It integrates the RSI and CCI indicators from TradingView, providing traders with a clear and actionable trading signal.
4. How it Works:
- The indicator calculates the RSI and CCI values, standardizes them using z-score, and combines them with a weighted fusion approach.
- The resulting RSI-CCI Fusion indicator is plotted on the chart, accompanied by dynamic upper and lower bands, which help identify potential overbought and oversold conditions.
- Traders can customize alerts based on their preferred thresholds and timeframes, enabling them to receive timely notifications for potential buy and sell signals.
5. Implementing the RSI-CCI Fusion Strategy:
Traders following the RSI-CCI Fusion Strategy can utilize the buy and sell signals generated by the RSI-CCI Fusion indicator. When the indicator crosses below the upper band, it may signal a potential selling opportunity. Conversely, when it crosses above the lower band, it may indicate a potential buying opportunity. Traders can also consider additional factors and technical analysis tools to validate the signals before making trading decisions.
Conclusion: The RSI-CCI Fusion Strategy provides traders with a robust approach to analyze the market and make well-informed trading decisions. By incorporating the RSI and CCI indicators through the "RSI & CCI Fusion + Alerts" indicator, traders can take advantage of the combined strengths of these indicators. However, it is important to remember that no strategy guarantees success, and traders should always practice risk management and conduct thorough analysis before executing trades using this strategy.
Disclaimer: Trading involves risks, and it is important to conduct your own research and consult with a financial advisor before making any investment decisions.
Note: The RSI-CCI Fusion Strategy serves as a general guide, and individual traders may have different preferences and trading styles.

RSI-CCI Fusion + AlertsThe "RSI-CCI Fusion" indicator combines the Relative Strength Index (RSI) and Commodity Channel Index (CCI) from TradingView.
RSI-CCI Fusion: Unlocking Synergies in Technical Analysis
Technical analysis plays a crucial role in understanding market dynamics and making informed trading decisions. I often rely on a combination of indicators to gain insights into price movements and identify potential trade opportunities. In the lines below, I will explore the "RSI-CCI Fusion" indicator, a powerful tool that combines the strengths of the Relative Strength Index (RSI) and the Commodity Channel Index (CCI) to provide enhanced trading insights.
1. Understanding the RSI and CCI Indicators
Before delving into the fusion of these indicators, let's briefly review their individual characteristics. The RSI is a widely used momentum oscillator that measures the speed and change of price movements. It oscillates between 0 and 100, with readings above 70 indicating overbought conditions and readings below 30 indicating oversold conditions.
On the other hand, the CCI is a versatile indicator designed to identify cyclical trends in prices. It measures the distance between the price and its statistical average, thereby providing valuable insights into overbought and oversold levels.
2. The Concept of RSI-CCI Fusion
The RSI-CCI Fusion indicator is born out of my desire to harness the collective power of the RSI and CCI. By combining these indicators, I can benefit from a more comprehensive trading signal that captures both momentum and cyclical trend dynamics.
The fusion process involves assigning weights to the RSI and CCI, creating a blended indicator that reflects their relative importance. The weighted combination ensures that both indicators contribute meaningfully to the final result.
To maintain consistency, the RSI and CCI values are standardized using the z-score technique. This normalization process brings the values to a common scale, making them directly comparable. Rescaling is then applied to bring the combined indicator back to its original scale, facilitating intuitive interpretation.
3. Interpreting the RSI-CCI Fusion Indicator
When plotting the RSI-CCI Fusion indicator on a chart, I gain valuable insights into market dynamics and potential trading opportunities. The indicator's plot typically includes dynamic upper and lower bands, which are calculated based on the indicator's standard deviation. These bands provide boundaries for evaluating overbought and oversold conditions.
When the RSI-CCI Fusion indicator crosses above the lower band, it suggests oversold conditions and potential buying opportunities. Conversely, when the indicator crosses below the upper band, it indicates overbought conditions and potential selling opportunities. I also pay attention to the baseline, which represents the neutral level and may signal potential trend reversals.
4. Utilizing Alerts for Trading Decisions
The RSI-CCI Fusion indicator can be further enhanced by incorporating alerts. These alerts notify me when the indicator generates buy or sell signals, enabling me to take prompt action. I can customize the alerts based on my preferred thresholds and timeframes.
However, it is crucial to remember that the RSI-CCI Fusion indicator should not be relied upon in isolation. To increase the robustness of my trading decisions, it is recommended to combine the indicator with other analysis techniques such as trend lines, support and resistance levels, or additional indicators. This convergence of analysis methodologies enhances the overall accuracy of my trade signals.
Conclusion: The RSI-CCI Fusion indicator represents a compelling approach to technical analysis by synergizing the strengths of the RSI and CCI. By combining momentum and cyclical trend dynamics, I gain a more comprehensive view of market conditions. The fusion of these indicators, accompanied by timely alerts, equips me with valuable insights and facilitates well-informed trading decisions.
As with any technical analysis tool, it is essential for me to backtest the RSI-CCI Fusion indicator to evaluate its performance across different market conditions and timeframes. Additionally, applying proper risk management strategies is crucial to ensure consistent and disciplined trading practices.

Ultimate Balance StrategyThe Ultimate Balance Oscillator Strategy harnesses the power of the Ultimate Balance Oscillator to deliver a comprehensive and disciplined approach to trading. By combining the insights of the Rate of Change (ROC), Relative Strength Index (RSI), Commodity Channel Index (CCI), Williams Percent Range, and Average Directional Index (ADX) from TradingView, this strategy offers traders a systematic way to navigate the markets with precision.
The core principle of this strategy lies in its ability to identify optimal entry and exit points based on the movement of the Ultimate Balance Oscillator. When the oscillator line crosses below the 0.75 level, a buy signal is generated, indicating a potential opportunity for a bullish trend reversal. Conversely, when the oscillator line crosses above the 0.25 level, it triggers an exit signal, suggesting a possible end to a bullish trend.
Key Features:
1. Objective Market Analysis: The Ultimate Balance Oscillator Strategy provides a disciplined and objective approach to market analysis. By relying on the quantified insights of multiple indicators, it helps traders cut through market noise and focus on key signals, improving decision-making and reducing emotional biases.
2. Enhanced Timing and Precision: This strategy's entry and exit signals are based on the specific thresholds of the Ultimate Balance Oscillator. By waiting for confirmation through the crossing of these levels, traders can potentially enter trades at opportune moments and exit with greater precision, maximizing profit potential and minimizing risk exposure.
3. Customizability and Adaptability: The strategy offers flexibility, allowing traders to customize the parameters to fit their preferred trading style and timeframes. Whether you're a short-term trader or a long-term investor, the Ultimate Balance Oscillator Strategy can be adjusted to suit your specific needs, making it adaptable to various market conditions.
4. Real-time Alerts: Stay informed and never miss a potential trade opportunity with the strategy's built-in alert system. Set personalized alerts for buy and exit signals to receive timely notifications, ensuring you're always aware of the latest developments in the market.
5. Backtesting and Optimization: Before applying the strategy to live trading, it's recommended to conduct thorough backtesting and optimization. By testing the strategy's performance over historical data and fine-tuning the parameters, you can gain insights into its strengths and weaknesses, enabling you to make informed adjustments and increase its effectiveness.
Trading involves risk. Use the Ultimate Balance Oscillator Strategy at your own discretion. Past performance is not indicative of future results.

Ultimate Balance OscillatorIntroducing the Ultimate Balance Oscillator: A Powerful Trading Indicator
Built upon the renowned Rate of Change (ROC), Relative Strength Index (RSI), Commodity Channel Index (CCI), Williams Percent Range, and Average Directional Index (ADX) from TradingView, this indicator equips traders with an unparalleled understanding of market dynamics.
What sets the Ultimate Balance Oscillator apart is its meticulous approach to weighting. Each component is assigned a weight that reflects its individual significance, while carefully mitigating the influence of highly correlated signals. This strategic weighting methodology ensures an unbiased and comprehensive representation of market sentiment, eliminating dominance by any single indicator.
Key Features and Benefits:
1. Comprehensive Market Analysis: The Ultimate Balance Oscillator provides a comprehensive view of market conditions, enabling traders to discern price trends, evaluate momentum shifts, identify overbought or oversold levels, and gauge the strength of prevailing trends. This holistic perspective empowers traders to make well-informed decisions based on a thorough understanding of the market.
2. Enhanced Signal Accuracy: With its refined weighting approach, the Ultimate Balance Oscillator filters out noise and emphasizes the most relevant information. This results in heightened signal accuracy, providing traders with a distinct advantage in identifying optimal entry and exit points. Say goodbye to unreliable signals and welcome a more precise and dependable trading experience.
3. Adaptability to Various Trading Scenarios: The Ultimate Balance Oscillator transcends the constraints of specific markets or timeframes. It seamlessly adapts to diverse trading scenarios, accommodating both short-term trades and long-term investments. Traders can customize this indicator to suit their preferred trading style and effortlessly navigate ever-changing market conditions.
4. Simplicity and Ease of Use: The Ultimate Balance Oscillator simplifies trading analysis by providing a single line on the chart. Its straightforward interpretation and seamless integration into trading strategies make decision-making effortless. By observing bullish or bearish crossovers with the moving average, recognizing overbought or oversold levels, and tracking the overall trend of the oscillator, traders can make well-informed decisions with confidence.
5. Real-time Alerts: Stay ahead of the game with the Ultimate Balance Oscillator's customizable alert system. Traders can set up personalized alerts for bullish or bearish crossovers, breaches of overbought or oversold thresholds, or any specific events that align with their trading strategy. Real-time notifications enable timely action, ensuring traders never miss lucrative trading opportunities.
The Ultimate Balance Oscillator is a robust trading companion, empowering traders to make shrewd and calculated decisions. Embrace its power and elevate your trading endeavors to new heights of precision and success. Discover the potential of the Ultimate Balance Oscillator and unlock a world of trading possibilities.

David Varadi Intermediate OscillatorThe David Varadi Intermediate Oscillator (DVI) is a composite momentum oscillator designed to generate trading signals based on two key factors: the magnitude of returns over different time windows and the stretch, which measures the relative number of up versus down days. By combining these factors, the DVI aims to provide a reliable and objective assessment of market trends and momentum.
Methodology:
To calculate the DVI, a specific formula is applied. The magnitude component involves averaging smoothed returns over various lengths, weighted according to user-defined parameters. This calculation helps determine the magnitude of price changes. The stretch component follows a similar process, averaging smoothed returns over different lengths to gauge market momentum. Users have the flexibility to adjust the weights and lengths to suit their trading preferences and styles.
Utility:
The DVI offers versatility in its applications. It can be used for both momentum trading and trend analysis due to its smooth and consistent signals. Unlike some other oscillators, the DVI provides longer and uncorrelated signals, allowing traders to effectively combine trend-following and mean-reversion strategies. For example, the DVI is adept at identifying overbought levels above the 200-day moving average, serving as a useful tool for determining exit points during price strength and even potential shorting opportunities. Traders can develop simple trading systems based on the DVI, buying above the 200-day moving average and selling when the DVI exceeds a specified threshold. Conversely, they can consider short positions below the 200-day moving average and cover when the DVI falls below a specific threshold. The DVI's objective approach to analyzing market momentum makes it a valuable resource for traders seeking to identify trading opportunities.
Key Features:
Bar coloring: based on Trend, Extremeties or Reversions
Reversions: Potential reversal points marked with triangles above\below oscillator
Extremity Hues: Highlighting oxcillator reaching traditional OB\OS levels
Example Charts:
