Gann S9 Bursa MalaysiaGann Square of 9 created based on the table to make easy for everyone use it especially Intraday.
The Price starting from 0.250 to 10.090
Gann table widely use in Bursa Malaysia Intraday.
This Indicator is to help for viewing the Gann Price line with same color as the actual Gann Square of 9 table.
-Fiez-
Bursamalaysia

Indices Sector SigmaSpikes█ OVERVIEW
“The benchmark Dow Jones Industrial Average is off nearly 300 points as of midday today...”
“So what? Is that a lot or a little? Should we care?”
-Adam H Grimes-
This screener aims to provide Bird-Eye view across sector indices, to find which sector is having significant or 'out-of-norm' move in either direction.
The significance of the move is measured based on Sigma Spikes, a method proposed by Adam H. Grimes, where Standard Deviation of returns used as a baseline.
*You can google his blog or read his book, got some gold in there, especially on how he use indicators for trading
█ Understanding Sigma Spikes
As described by Grimes, moves in markets are only meaningful when we consider what “normal” is for that market.
Without that baseline, the daily change number, and even the percent change on the day doesn’t really mean much.
To overcome that problem, Sigma Spikes, as a measure of volatility, attempt to put todays change in price (aka return) in context of the standard deviation of 20 days daily's return.
Refer chart below:
1. The blue bars refer to each days return
2. The orange line is 1 time standard deviation of past 20days daily's return (today not included)
3. The red line is 2 time standard deviation of past 20days daily's return (today not included)
Using the ratio of today's return over the Std Deviation, determining your threshold (1,2,3,etc) will be the key that tells if today's move is significant or not.
*Threshold referring to times standard deviation, and different market may require different threshold.
*20 Days period are based on the Lookback Period, adjustable from user input window.
█ Features
- Scan up to 13 symbols at a time (Bursa (MYX) indices are defaulted, but you may change to any symbols/index from the user input setting)
█ Limitation
- Due to multiple use of security() function required to call other symbols, expect the screener to be slow at certain times
- Custom Timeframe currently accept only Daily and Weekly. I'll try to include lower timeframe in the next update
█ Disclaimer
Past performance is not an indicator of future results.
My opinions and research are my own and do not constitute financial advice in any way whatsoever.
Nothing published by me constitutes an investment recommendation, nor should any data or Content published by me be relied upon for any investment/trading activities.
I strongly recommends that you perform your own independent research and/or speak with a qualified investment professional before making any financial decisions.
Any ideas to further improve this indicator are welcome :)

HuD Bursa Strength IndexHuD Bursa Strength Index
- is a RSI oscilator for Malaysia Index Sector
- it will display RSI of selected Index sector such as Technology and compare it with current counter's chart
The purpose is to see the "relationship" between the counter and selected Index's RSI .
Setting :
- Default setting for RSI is 14, source is close
- Index sector includes :
"FBMKLCI", "TECHNOLOGY","ENERGY","PLANTATION", "PROPERTIES", "CONSUMER", "FINANCE", "CONSTRUCTN", "IND-PROD", "HEALTH", "TRANSPORTATION", "TELECOMMUNICATIONS" dan "UTILITIES"
// BM //
- RSI utk sektor-sektor indeks di Bursa Malaysa
Tujuan indicator :
- untuk bandingkan carta kaunter pilihan dengan RSI indeks berkaitan seperti KLCI, Teknology dan lain-lain
- Boleh lihat "relationship" kaunter dengan indeks
- Mungkin boleh mencari timing yang sesuai untuk entry atau exit bersesuaian dengan kekuatan indeks yang berkaitan
- Trader boleh pilih indeks-indeks dari option setting :
"FBMKLCI", "TECHNOLOGY","ENERGY","PLANTATION", "PROPERTIES", "CONSUMER", "FINANCE", "CONSTRUCTN", "IND-PROD", "HEALTH", "TRANSPORTATION", "TELECOMMUNICATIONS" dan "UTILITIES"

HuD AQV BursaPersonal Experiment
Indicator based on Donchian Channel and ATR
Blue Dot = Entry Point
Red Dot = Stop Loss
Green Dot = Breakout Candle
Orange Triangle = Uptrend Confirmation
Entry
- only entry if it suit your risk
- Entry at the beginning of uptrend is a good entry
Stop Loss
- Stop Loss calculation are based on 100 lot shares
- Risk calculation at Info panel
Take Profit (TP)
- TP calculation as followed :
Range = Close Price - Stop Loss
TP1 = Close Price + ( 1 x Range )
TP2 = Close Price + ( 2 x Range )
TP3 = Close Price + ( 3 x Range )
Note :
EP = Entry price / Trigger price
CP = Close Price
SL = Stop Loss
Risiko = ( CP - SL ) x 100 lot

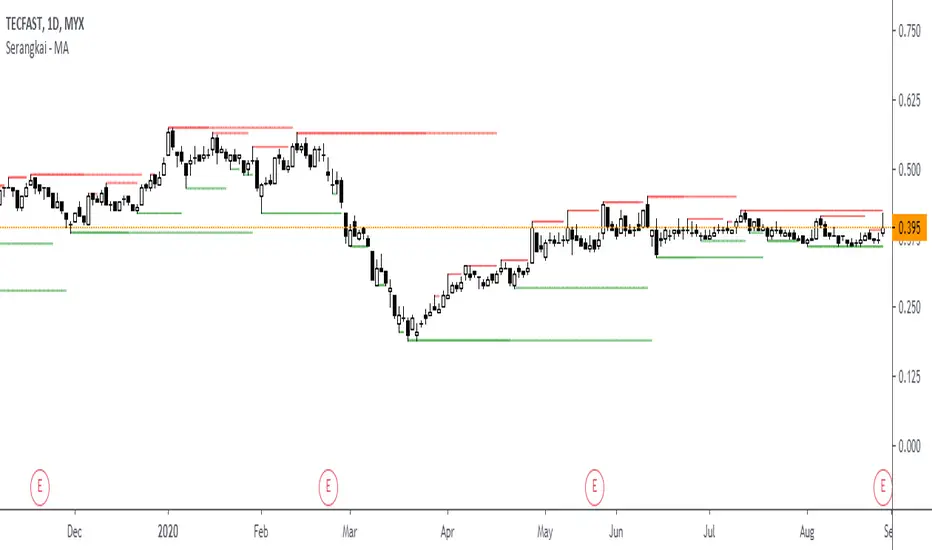
Gann Square 9 for Bursa Malaysia"The Square of nine or Gann Square or Master Chart is also known as the square root calculator and finds it basis from Gann's methods which is squaring price and time. The square of 9 is a spiral of numbers with the initial value "1" starting off at the center. Starting from this central value, the number is increased as we move in a spiral form and in a clockwise direction. According some experts, each cell in Gann’s square of nine represents a point of vibration" - from iSaham website
- Based on Gann Square 9 Table
- Lines act as Support and Resistance
- Lines can also be used as guide for Take Profit or Cut Loss level
- Indicator will plot 8 nearest lines at current price.
Generally, trade will refer :
- Red Line - Stronger Support and Resistance
- Blue Line - Support and Resistance
Notes :
Only suitable for Bursa Malaysia stocks
Currently lines only cover price below RM5
Please pm me if you interested to use :)

HuD IntradayConsist of :
- standard Bollinger Band (BB) - MA20 and 2 dev
- EMA ( default 9,20,50 and 200)
- WMA ( 5 and 10 )
- Donchian Channel
Suitable for intraday trading - 15min, 30 min or 1 hour timeframe
Trading Strategy :
1. Enter trade only when
- band is Green
- line EMA20 above EMA50 and line EMA50 above EMA200 ( black > purple > red )
- RSI (default setting 14) is above level 50 and trend is positive (RSI line moving upward)
2. Possible Entry point ( 3 options )
i Breakout candle and candle still below lower BB
ii Retracement/Pullback - after Breakout and candle still inside green band. RSI still above 50
iii. Buy on Weakness (BOW) - Blue diamond icon
3. Stop Loss :
- Select "Show Stop Loss" - to display stop loss line
- Based on ATR
- adjustable depend on trader risk
Other option for stop loss :
- WMA Area ( Dark green ) - candle cross under WMA, can consider to exit trade
- EMA20 - candle cross under EMA20, can consider to exit trade.
4. Alert
Therea are 3 alerts availabe
i. Breakout signal
ii. Sell signal - candle break trailing Stop
iii. BOW - Buy on weakness signal
Note :
- This indicator only suitable for Bursa Malaysia
- Do PM me if you interested

FBMACE-TrackerWhat is FBMACE Tracker?
FBMACE Tracker is created with the idea to track the performance of the Malaysia ACE Market known as FBMACE. This script is useful for traders who are trading individual stocks listed under FBMACE index.
By using this script, we can see how the ACE market is performing as compared to the individual stock we are trading (under FBMACE index). By comparing the stock price vs FBMACE tracker, we can find out the support and resistance level and time our entry and exit properly.

KiraKira : Position Sizing Bursa MalaysiaPosition Sizing Calculator :
1. Only for Bursa Malaysia
2. User Input :
- Capital
- Entry (EP)
- Stop (SL)
- % Risk
- Risk Reward Ratio
* Overall - still "work in progress"
* Profit value only Gross Profit ( not included brokerage fees etc)
-------------------------------------
- * harap boleh cuba dan boleh bagi feedback utk sy improve - TQ :)

MA 10,20,50,200Indicator consist of moving averages (MA).
This indicator make it easier for me to switch between few MA lines.
1. MA10
- used for intraday.
2. MA50 and Ichimoku
- to analyze swing trend
- display only MA50 and ichimoku cloud
3. MA20, MA50 and MA200
- to analyze the trend
- for swing trade
4. Lines 52 Week High / Low
- display both lines as guide when trading
Gann Bursa Malaysia Ver1Gann Square of 9 is a spiral of numbers starting with the number one in the center.
The numbers spiral around the center in a clockwise manner to the number 9, which completes the first cycle around the center.
Square of 9 Wheel is one of the popular market tools of legendary trader W.D. Gann
Based on Gann Square of 9, this indicator automatically plot the lines which act as support and resistance .
Red Line - very strong support/resistance
Blue Line - strong support/resistance
Notes :
These indicator only suitable for Bursa Malaysia.
Currently Only Cover Price Range( RM ) from 0.020 - 2.50
