BOSS Smooth Stochastic-RSI And RSI Oscillators With Alerts THE BEST FOREX, BINARY OPTIONS, STOCK AND CRYPTO INDICATORS FOR TRADINGVIEW.COM
Our Smooth Stochastic RSI indicator and our RSI indicator all combined in one!
BACKGROUND AND BAR COLOR
Green=BULLISH
Yellow= NEUTRAL/TRANSITIONAL
Red= BEARISH
ALERTS
GET ALERTS FOR BULLISH AND BEARISH CROSSOVERS ON STOCHASTIC RSI
GET ALERTS WHEN RSI LINE IS GREEN AND RED
Formacje wzrostowe

SMA 50 collectorHello traders
The SMA 50 is known to define a trend. If price is closing above, trend is bullish, if below, trend is bearish.
That's why I like to have all of them on my chart :)
Enjoy
David

💸 Divergence Finder v1.0 by Cryptothythms💸 Divergence Finder v1.0 by Cryptothythms
Intro
This indicator is meant as a quantitative look at divergences. Special thanks to RicardoSantos (legend!) for his divergence detection script which was used as a basis to construct this.
Usage
Lime Green = Regular Bullish Divergence
Dark Green = Hidden Bullish Divergence
Red = Regular Bearish Divergence
Maroon = Hidden Bearish Divergence
Remember... divergences do not have a high probability success overall. So to mitigate that this is an attempt to source many "opinions" on the state of divergence from many different classes of indicators.
Leading indicators - Lead price action, but have a higher probability of false signals
Real time indicators - Track price action, momentum, etc in a tick by tick state. Generally a 1-3 bars lag can be present.
Lagging indicators - Lag price action a little, but offer more in terms of confirmation of the divergence
Volume indicators - Look at volume flow in different fashions and give an added dimension to divergence finding. Remember volume divergences interact with price independently. For instance volume can be going down, but price going up. Be sure to understand the relationship of volume and price action when considering these readings.
👍 Enjoying this indicator or find it useful? Please give me a like and follow! I post crypto analysis, price action strategies and free indicators regularly.
💬 Questions? Comments? Want to get access to an entire suite of proven trading indicators? Come visit us on telegram and chat, or just soak up some knowledge. We make timely posts about the market, news, and strategy everyday. Our community isn't open only to subscribers - everyone is welcome to join.
For Trialers & Chat: t.me/cryptorhythms

24/9 EMA with Bias & SignalsThis is a simple indicator that plots the 24 & 9 EMAs.
It also highlights the potential bias of the market (bull or bear) based on if the 9 EMA is above or below the 24 EMA.
In addition there are signal crosses that you can use for alerts.
This indicator is best used to confirm a particular underlying bias on the 5m, 15M, 1HR, 4HR, and Daily timeframes.
It's important to note on lower timeframes that the bias can be counter trend bias of the overall larger momentum of the instrument you are trading.
For clarity this means that many retraces get going when the 9 crosses the 24. But ultimately the larger timeframe bias will continue after this counter trend retraces.
Combining this indicator with value channels and ATR is what I recommend.

Turbo TriggerSome Words
This indicator is a collaboration between me and Himeyuri, i encourage you to check her profile and follow her www.tradingview.com
Introduction
A lot of indicators include a "trigger" line, it can be a smoothed version of another input, in this case the trigger will generate signals from his crosses with the input. The purpose of this indicator is to provide a fast trigger line to generate earlier signals as well as avoiding some whipsaw.
The Indicator
There are two lines, a bull line (blue) and the trigger (orange) , when the trigger cross over the bull line a buy signal is generated, when the trigger cross under the bull line a sell signal is generated. The trigger is made from the smoothed difference between the bull and bear line.
smooth control the smoothness of the output. The Bull/Bear Mode is an idea proposed by Himeyuri that involve plotting the bear line instead of the trigger.
Bull/Bear Mode, the lines are somewhat asymmetrical from each others.
Conclusion
We have showcased a new indicator who use a really fast trigger line to generate earlier signals, if some are way to earlier you can still increase smooth in order to correct reactivity. I hope you find a use to it.
Thanks for reading !
A big thanks to Himeyuri who is a great student and great pinescripter.

Trader Set - Volume TrendThis is a little GIFT from me to the community.
It uses one of the volume candle subtype formulas to define if there is a trend in the market or not.
Keep in mind that this script uses security on 60 minute (hourly) time frame, so, fundamentally it can have little repaint but as long as you don't update your charts, there shouldn't be any problem and even with chart update and refreshing, the chance for a repaint is really small.
Also, because this uses 60 minute time frame to determine if there is a trend or not, you can't use it on time frames higher than hourly charts, even on hourly chart it's not acceptable for most conditions. but on minute charts, it should be a nice helper to show "possible" direction of the market.
Remember, as many indicators, this just INDICATES a suggestion and it's not written on hard stone.
Bearish Candlestick PatternsDoji
Black Spinning Top
White Spinning Top
Bearish Abandoned Baby
Bearish Advance Block
Bearish Below The Stomach
Bearish Belt Hold
Bearish Breakaway
Bearish Counter Attack Lines
Bearish Dark Cloud Cover
Bearish Deliberation Blok
Bearish Descending Hawk
Bearish Doji Star
Bearish Downside Gap Three Methods
Bearish Downside Tasuki Gap
Bearish Dragonfly Doji
Bearish Engulfing
Bearish Evening Doji Star
Bearish Evening Star
Bearish Falling Three Methods
Bearish Falling Window
Bearish Gravestone Doji
Bearish Hanging Man
Bearish Harami
Bearish Harami Cross
Bearish Hook Reversal
Bearish Identical Three Crows
Bearish In Neck
Bearish Island Reversal
Bearish Kicking
Bearish Ladder Top
Bearish Last Engulfing Top
Bearish Low Price Gapping Play
Bearish Mat Hold
Bearish Matching High
Bearish Meeting Line
Bearish On Neck
Bearish One Black Crow
Bearish Separating Lines
Bearish Shooting Star
Bearish Side by side White Lines
Bearish Three Black Crows
Bearish Three Gap Up
Bearish Three Inside Down
Bearish Three Line Strike
Bearish Three Outside Down
Bearish Three Stars in the North
Bearish Thrusting Line During Dowtrend
Bearish Tower Top
Bearish Tristar
Bearish Tweezers Top
Bearish Two Black Gapping
Bearish Two Crows
Bearish Upside Gap Two Crows
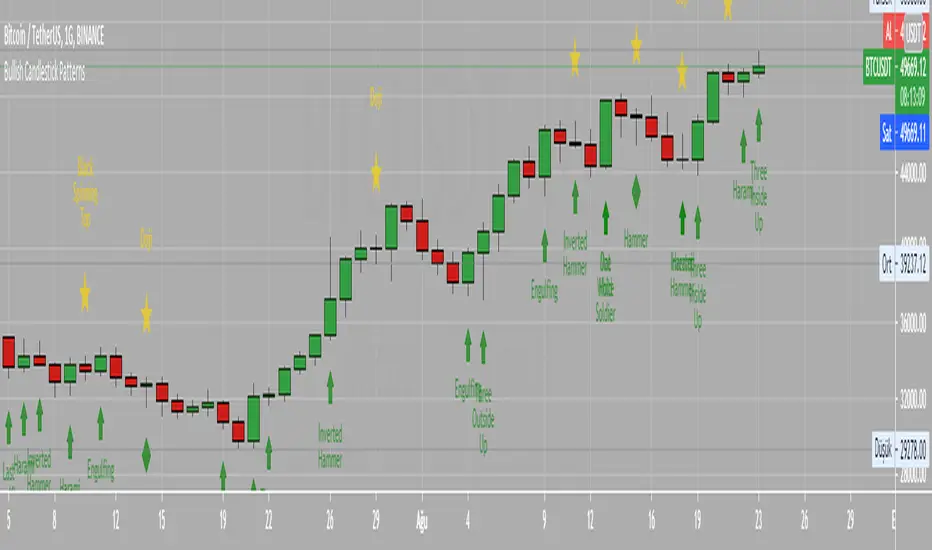
Bullish Candlestick PatternsBullish Abandone Baby
Bullish Above The Stomach
Bullish Belt Hold
Bullish Breakaway
Bullish Concealing Baby Swallow
Bullish Counterattack Lines
Bullish Deliberation Block
Bullish Descent Block
Bullish Doji Star
Bullish Downside Gap Two Rabbits
Bullish Dragonfly Doji
Bullish Engulfing
Bullish Hammer
Bullish Harami
Bullish Harami Cross
Bullish High Price Gapping Play
Bullish Homing Pigeon
Bullish Hook Reversal
Bullish Inverted Hammer
Bullish Island Reversal
Bullish Kicking
Bullish Ladder Bottom
Bullish Last Engulfing Bottom
Bullish Mat Hold
Bullish Matching Low
Bullish Meeting Line
Bullish Morning Doji Star
Bullish Morning Star
Bullish On Neck
Bullish One White Soldier
Bullish Piercing Line
Bullish Rising Three Methods
Bullish Rising Window
Bullish Separating Lines
Bullish Side by Side White Lines
Bullish Stick Sandwich
Bullish Takuri Line
Bullish Three Gap Downs
Bullish Three Inside Up
Bullish Three Line Strike
Bullish Three Outside Up
Bullish Three Stars in the South
Bullish Three White Soldiers
Bullish Thrusting Line During Uptrend
Bullish Tower Bottom
Bullish Tristar
Bullish Tweezers Bottom
Bullish Two Rabbits
Bullish Unique Three River Bottom
Bullish Upside Gap Three Methods
Bullish Upside Tasuki Gap
2019- BITCOIN - BTFD -BANDS-60minAs long as BTC is in this uptrend,
We have identified the BTFD bands.
They are on the chart and part of this indicator.
When the Dip happens, turn on this indicator,
Use it on the hourly chart.
BTFD will appear when price is rejected by our BTFD Band.
This strategy indicator has worked since the beginning of BTC bullish turn in February
This indicator is set to expire in December 2019
ONCE BTC closes below our Green line on the hourly, this strategy can be deemed DEAD!
Thanks, BTFD Safely
Like this indicator?
Join our Discord, link in my Bio!

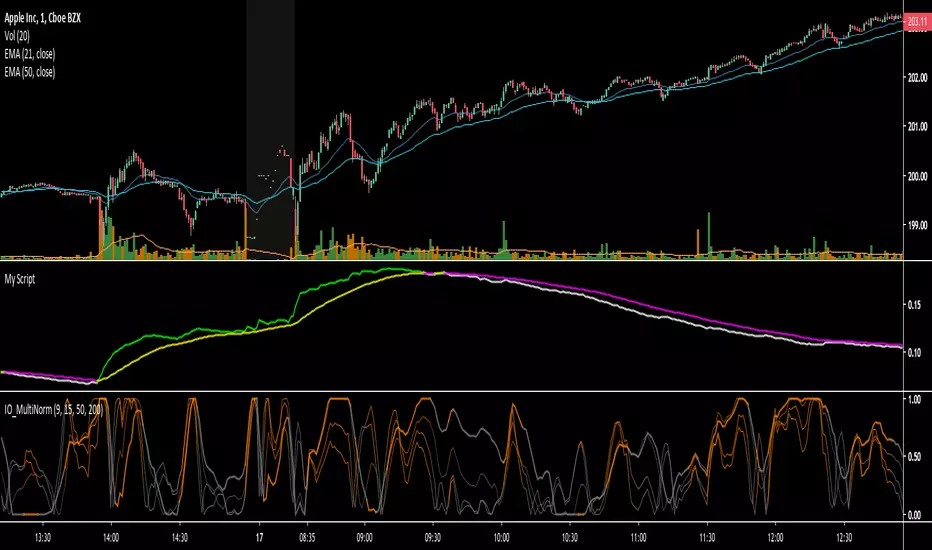
IO_MultiNormMultiNorm is an oscillator used for trend and volatility analysis.
Original Idea by Invsto.
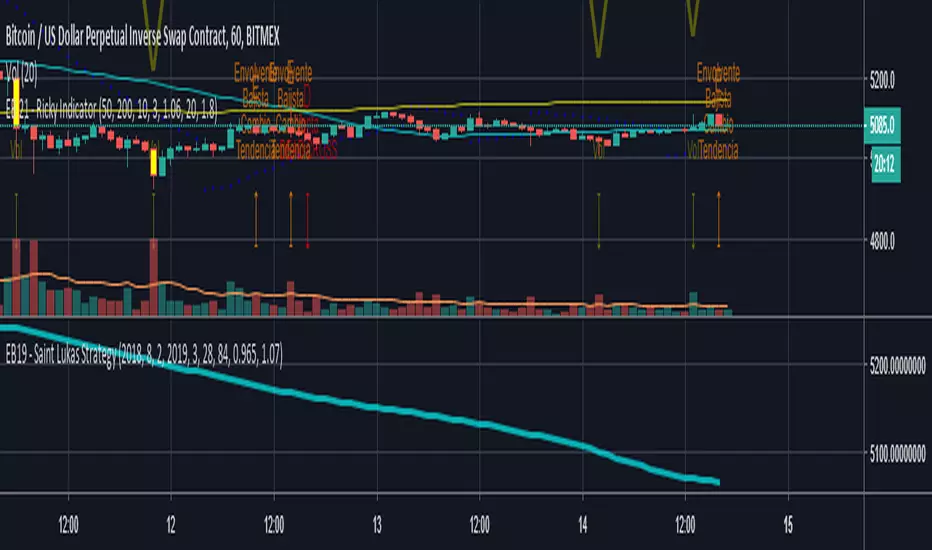
EB 21 - Ricky IndicatorIndicates multiple signals:
SAR
2 SMA
MAST Detector
Bullish Engulfing
Bear Engulfing
Gold and Dead Cross
Volume Increment
LST Crash Detector SystemDesigned for use on major stock market indices.
Select a weekly timeframe
Green Indicates Bull Market
Red Indicates Potential Crash
Shock Alert Indicates Serious Volatility Suggesting Change Of Trend.

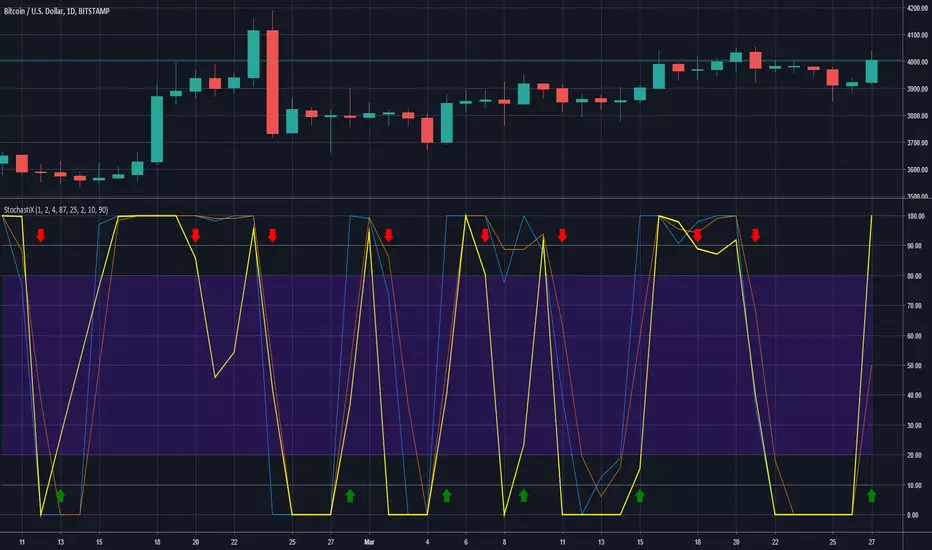
StochastiXThere ya go!!! You actually came to the best indicator there is out there. I hope you enjoy it. If you have any questions just hit me on the chat and i will answer you the best i can. Have a good one ;)
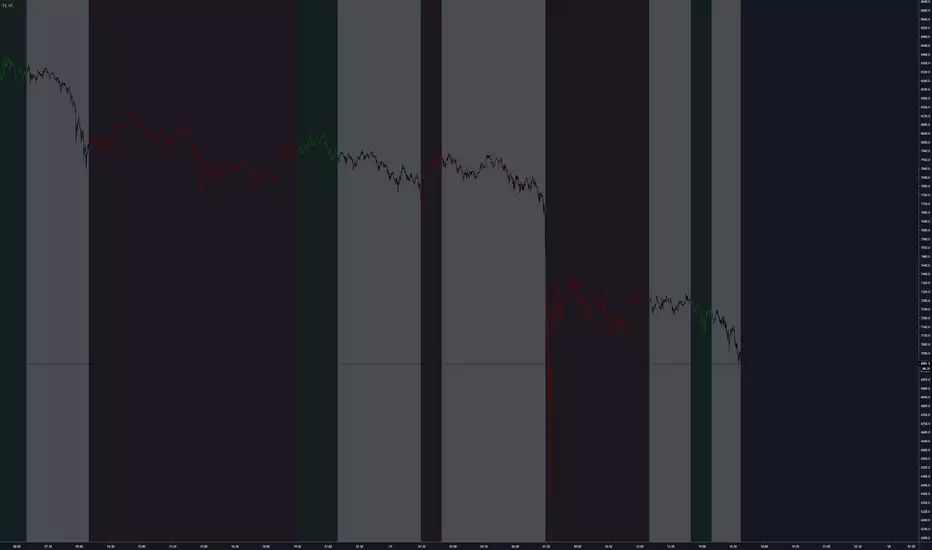
AG Market QualityGiven that we are primarily focussed on trend-following, we built this indicator in a quest to assess the "quality" of a market. It was adapted primarily from methods that trading coach Dr. Van Tharp popularised, namely to do with his SQN.
This indicator has 5 zones that act to classify the market:
Strong Bull - Dark Green
Bull - Green
Neutral - Grey
Bear - Red
Strong Bear - Dark Red
The black line is an SMA(20) of Market Quality (indicating average quality over a period).
The simplistic theory is to look for long trades when the quality is indicating bull or strong bull conditions (green or dark green), and look for short trades when the quality is indicating bear or strong bear conditions (red or dark red). When the quality is in neutral territory (grey bars), the market is choppy/sideways/rangebound, and it's generally best to stay out in these conditions (for trend-followers).
We like to look for long trades when the quality is bull or strong bull, and above the average quality (black line), and look for short trades when the quality is bear or strong bear, and below the average quality.
So, not only does this indicator help you decide when to get in the market, it also tells you when to stay out of the market - really handy!
You can change the periods of the Market Quality, and also the SMA measuring average quality.

Ultimate BiasThis indicator is meant to be used by our private trading group.
It allows you to plot complex Market Bias criteria, and it generates a context for the market state and fires Entry/Exit signals.
It includes customized alerts to ease its use in algo trading.

9 Seasons Rainbow Indicator DEMO [GO8686]Having good pattern recognition? Use this indicator to test and practice it.
Market is full of life, with seasons.
9 Seasons Rainbow Indicator displays 9 seasons of any trading instrument in multiple time frames, helping traders and investors understand the flow of price.
The combination of seasons in different time dimensions may give perfect trading signals, for instance: overbought in both small time frame and big time frame has high success probability of shorting trade.
Please install the indicator: Demo, PRO or STANDARD Version. Apply the indicator to your favorites trading instruments: indices, stocks, futures, forex or crypto currencies. Find your patterns that make money.
---------- 9 Seasons ----------
Bull(Green), evolves into BullRest, OverBought, Bear, or Neutral
Bull Rest(Light Green): a pullback or retracement, evolves into Bull or Bear
OverBought(Yellow): may have defined a top or resistance, can happen in range, evolves into CrazyBought or Bear
CrazyBought(Lime): going up in a high volatility, evolves into Bear, OverBought, or BullRest
Neutral(White): a wandering season without direction, evolves into Bull or Bear
Bear(Red), evolves into BearRest, OverSold, Bull or Neutral
Bear Rest(Light Red): a bounce, evolves into Bear or Bull
OverSold(Blue): may have defined a bottom or support, can happen in range, evolves into CrazySold or Bull
CrazySold(Fuchsia): going down in a high volatility, evolves into Bull, OverSold, or BearRest
---------- Some important evolutions of seasons ----------
OverBought -> CrazyBought: can happen with a breakout
CrazyBought -> OverBought or Bear: could mean fading of a breakout
CrazyBought -> BullRest: can happen after rising over a new level
OverSold -> CrazySold: can happen with a breakdown
CrazySold -> OverSold or Bear: could mean fading of a breakdown
CrazySold -> BearRest: can happen after dropping to a new level
---------- Rainbow Ribbons for multiple time frames ----------
Each ribbon of the rainbow represents a time frame,
The difference between two frames is 1.4142 fold (square root of 2), if level 1 is 15 M, level 2 is 15 * (square root of 2) M. level 3 is 15*2 M, level 4 is 30 * (square root of 2) M, level 5 is 30 * 2 m etc.
The uppermost ribbon represents the smallest time frame - current time period of the chart.
The lower ribbons represent bigger time frames, which work as context.
Examples for time frame rainbow:
For DEMO in 30M: 30M - 42M - 60M(1H) - 85M - 120M(2H) - 170M - 240M(4H) - 339M
For STANDARD in 15M: 15M - 21M - 30M - 42M - 60M(1H) - 85M - 120M(2H) - 170M
For PRO in 15M: 15M - 21M - 30M - 42M - 60M(1H) - 85M - 120M(2H) - 170M - 240M(4H) - 339M - 480M(8H) - 679M
---------- Versions Description ----------
The features may change later, please refer to latest update.
DEMO:
This is DEMO of Standard version for trial purpose, having most the functions except alert preset conditions.
It is applicable to a list of trading instruments and specific time periods(30m-1D), which may change later. please refer to latest updates.
---List of tickers applicable for Demo version.
Currency Index:AXY,BXY,CXY,DXY,EXY,JXY,SXY,ZXY,
Stock Index:SPX,TSX,DAX,NI225,KOSPI,399001,SHCOMP,HSI,XJO,TAIEX,SX5E,
Crypto:BTCUSD
Commodity:BCOUSD,GOLD
STANDARD:
STANDARD version of 9 Seasons Rainbow Indicator is invite-only, with the following advanced features:
8 Ribbon Rainbow lets you discover trading opportunities hidden in the 1.4142 fold time dimension while monitoring market conditions spanning 11 times.
Advanced alert sets allows you set alerts for Overbought, Crazybought, OverSold, CrazySold on upper and lower time frames.
Broad time periods access allows you to watch the market on popular time dimensions from 15M - 1D,2D,3D,4D,5D,6D,1W.
More new features in updates.
PRO:
PRO version of 9 Seasons Rainbow Indicator is invite-only, with the following advanced features:
12 Ribbon Rainbow lets you discover trading opportunities hidden in the 1.4142 fold time dimension while monitoring market conditions spanning 45 times.
Advanced alert sets allows you set alerts for Overbought, Crazybought, OverSold, CrazySold on low, medium, and high time frames.
Option to input different trading instrument to compare with the current ticker.
Full time periods access allows you to watch the market on broadest time dimensions.
More new features in updates.
---------- Access to Indicators ----------
Please contact the author for access to PRO or Standard versions.
---------- About Loading Time ----------
It may take up to 2 minutes for your browser to load a new setting, depending on the your computer and network speed.
---------- List of the author's Indicators ----------
www.tradingview.com
---------- Disclaim ----------
By using or requesting access to this indicator, you acknowledge that you have read and accepted that this indicator is for study purposes only and it does NOT guarantee you will make money.
I am not financial adviser and I am NOT responsible for any profits or losses you may incur by using this indicator!
Users should make their own decisions, carefully assess risks and be responsible for investment and trading activities.
The latest updates override the previous description. Please check the updates.
9季彩虹指标 演示版
具备优秀的模式识别能力吗? 9季彩虹指标检验,提升您的模式识别能力。
市场充满生机。
9季彩虹指标在多个时间维度上显示任何交易品种的9个季节交替,帮助交易者和投资者了解价格流动。
不同时间维度的季节组合可以给出完美的交易信号,例如:在小时间框架和大时间框架上同时出现超买具有很高的卖空交易成功概率。
请安装指标:Demo,STANDARD 或者 PRO 版本. 应用指标到您的交易品种:证券,期货,外汇或者加密货币。找到属于您的盈利模式。
---------- 季节的定义 ----------
牛(绿色),可以演变到牛市回调,超买,熊 或者 中性
牛市回调(淡绿色):可以演变到牛或者熊
超买(黄色),可能刚刚定义了一个头部或者阻力区,可以发生在盘整期,可以演变到狂买或者熊
狂买(亮绿色):高波动性上涨,可以演变到熊,超买或者牛市回调
中性(白色): 没有方向的徘徊期,可以演变到牛或者熊
熊(红色),可以演变到熊市反弹,超卖,牛 或者 中性
熊市反弹(淡红色),可以演变到熊或者牛
超卖(蓝色),可能刚刚定义了一个底部或者支撑,可以发生在盘整期,可以演变到狂卖或者牛
狂卖(紫红色),高波动性下跌,可以演变到牛,超卖 或者熊市反弹
一些重要的季节交替
超买 -> 狂买:可能发生在向上突破时
狂买 -> 熊 或者 超买:可能发生在突破失败时
狂买 -> 牛市回调: 可能发生在上平台后
超卖 -> 狂卖:可能发生在向下突破时
狂卖 -> 牛 或者 超卖:可能发生在突破失败时
狂卖 -> 熊市回调: 可能发生在下平台后
---------- 色带彩虹所代表的时间维度 ----------
每条色带代表一个时间维度。
色带间隔1.4142倍(2的开方),如果第一维度是15分钟,第二维度是15*1.4142=21分钟,第三维度是15*2=30分钟,以此类推。
最上面的色带代表最小的时间维度,也就是目前图表的时间维度
最下面的色带代表最大的时间维度。
例子:
演示版: 30m-42m-60m(1H)-85m-120m(2H)-170m-240m(4H)-339m
标准版: 15m-21m-30m-42m-60m(1H)-85m-120m(2H)-170m
专业版: 15m-21m-30m-42m-60m(1H)-85m-120m(2H)-170m-240m(4H)-339m-480m(8H)-679m
---------- 不同版本功能描述 ----------
这些特征及功能可能会发生变化,以更新为准。
--演示版DEMO
演示版用于标准版的演示和试用,适用于特定的资产列表和时间维度(30M-1D),后续可能调整.
适用的品种列表
AXY,BXY,CXY,DXY,EXY,JXY,SXY,ZXY,
SPX,TSX,DAX,NI225,KOSPI,399001,SHCOMP,HSI,XJO,TAIEX,SX5E,
BTCUSD,BCOUSD,GOLD
---标准版STANDARD特征
8色带彩虹让您发现隐藏在1.4142时间维度的交易机会,同时监控时间跨度达十一倍的市场状态
高级警报功能:允许您在低,高时间层级上设置超买,狂买,超卖,狂卖的警报。
宽时间维度(15分钟到日线级别)让您从更宽阔的视角观察市场
更新中的更多新功能。
---专业版PRO高级特征
12色带彩虹让您发现隐藏在1.4142时间维度的交易机会,同时监控时间跨度达四十五倍的市场状态
高级警报功能:允许您在低,中,高时间帧上设置超买,狂买,超卖,狂卖的警报。
可以输入不同的交易品种用于指标,便于与当前交易品种进行比较。
全时间维度(分钟到日线级别)给您全视角观察市场
更新中的更多新功能。
---------- 获得使用权 ----------
联系指标开发者以取得标准版和专业版的使用权
---------- 开发者的指标列表 ----------
www.tradingview.com
---------- 加载时间 ----------
可能需要2分钟,取决于网络和电脑配置。
---------- 免责声明 ----------
在要求获得本指标使用权之前以及在使用本指标之前,用户认可已经完全了解和接受:本指标仅供教育和研究目的, 它不提供任何赢利的可能性。
本指标的开发者并非专业投资顾问,因此不对用户的任何赢亏负责。
用户应独立判断,审慎评估并自负投资和交易风险!
最近的更新会覆盖之前的说明。 请参阅更新来查看指标的新特征和功能。

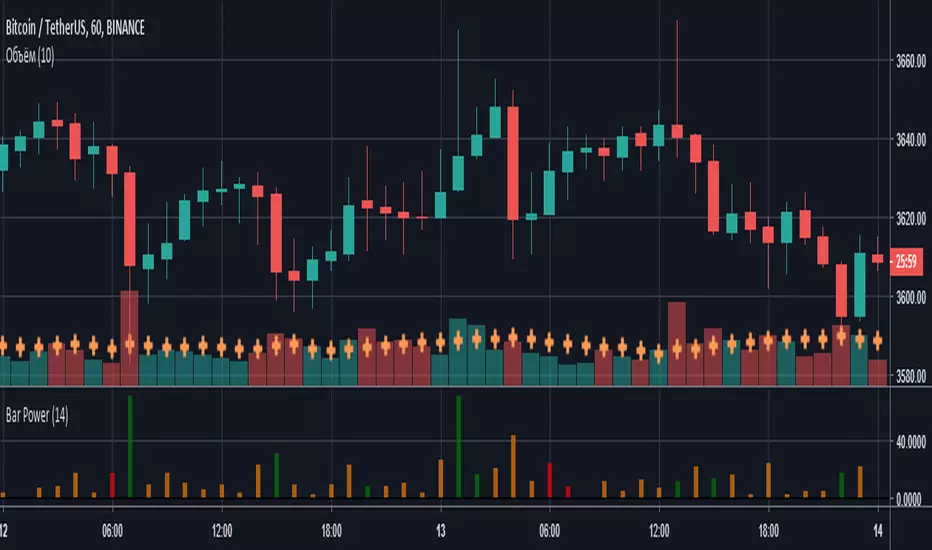
Bar PowerВысота столбцов характеризует силу (то, на сколько быки/медведи были активнее) сформированной свечи, а цвет - количество затраченной на это энергии (объем).
- Красный - маленький объем;
- Оранжевый - средний объем;
- Зеленый - высокий объем.
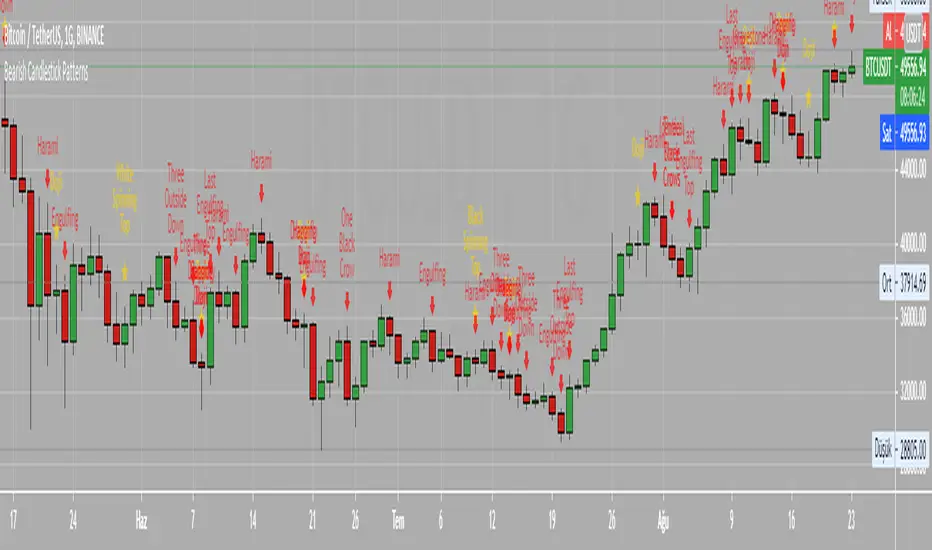
BH - Candlestick Pattern DetectionThis is a script to help the beginners locate the candle patterns. It has a nice code that can be used in other scripts too. Easy to use with separated functions, simple patterns and complex patterns detections.
I have done some updates at the Candlestick Patterns Identified script by @repo32. Was a good start of my ideia. Tks for sharing repo.
It will be always under constant development but I want to share this first version to know what can be done to get better, improve, get more desired patterns, know what are you guys using that could be helpful.
I still need to check if all patterns are correct.
Any comments, help and suggestions will be appreciated.
Marcos Issler @ Isslerman

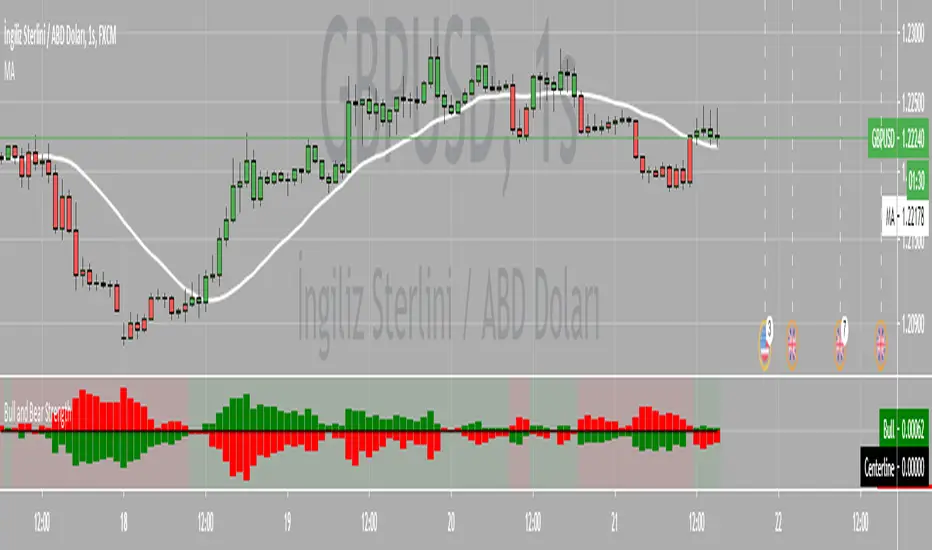
Bitfinex Sentiment Index [Long-Short]BSI provides two attractive graphs that breakdown the long (green area) and short (red area) positions ratio for the all Bitfinex margin cryptocurrency pairs only .
It is a quantitative measure of the bullishness or bearishness that can be used as a trading rule or in a trading system entries or exits. Included slow stochastic oscillator.

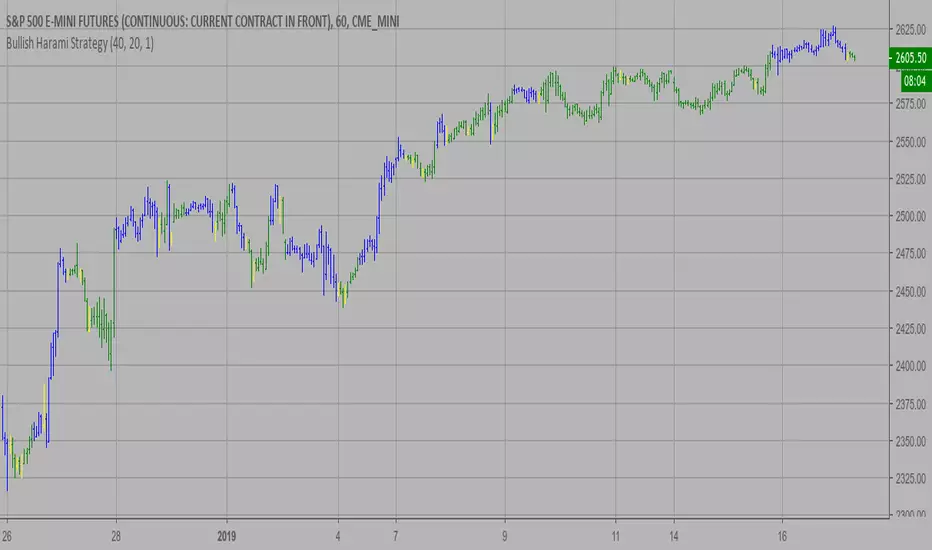
Bullish Harami Strategy This is a bullish reversal pattern formed by two candlesticks in which a small
real body is contained within the prior session's unusually large real body.
Usually the second real body is the opposite color of the first real body.
The Harami pattern is the reverse of the Engulfing pattern.
WARNING:
- This script to change bars colors.
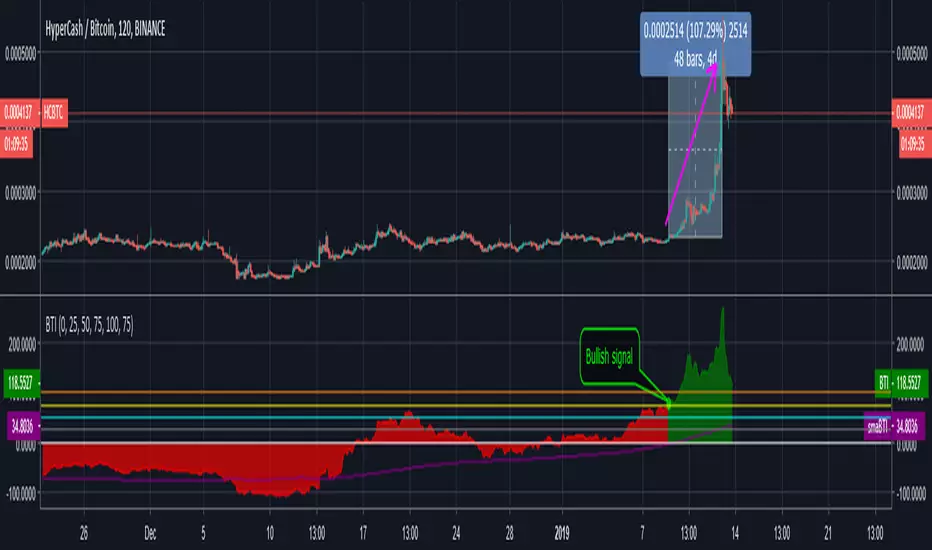
Bull Trend Indicator for HypercashCheck out this new indicator called Bull Trend Indicator . Predicts the start of BULL TRENDS. Checking this for Hypercash(HC), bullish signal was triggered on 9 Jan. 3 days later break out and increased 100%. Today Hypercash is the daily top coin at Binance, up 25% today.
How to use:
1. Green dot signal the start of bull trend, red dot for bear trend.
2. Bullish when the indicator crossed over the bull level (default = 75), green area
2. End of Bull trend when the indicator has peaked
3. Bearish in the red area (default = below 75 to be conservative)
This indicator successfully signalled end of bull trend for Bitcoin on early 2018 (I will post later).
Message me to start your 7 day free trial access, hit like if you like it.
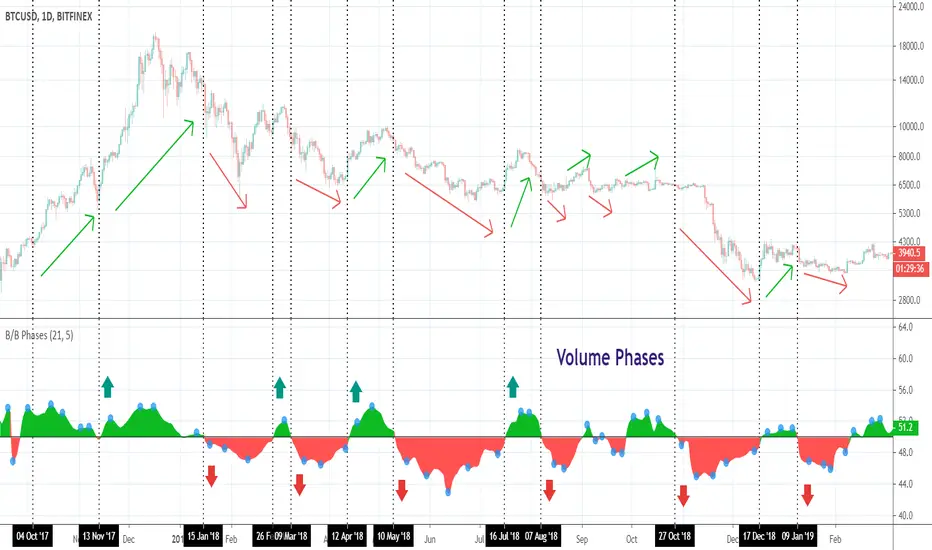
Bullish/Bearish PhasesHello traders!
This indicator shows you bullish or bearish dominance during the specified period and is based on the volume calculations. Why? Volume acts as an excellent confirmation tool of the price movements and is used to determine if an instrument is gaining or losing momentum.
Bullish/Bearish Phases can be used to find out divergences with the price. It will work on ANY instrument that has available volume data.
NOTE : The blue circles appear on the local peaks.
I attached some screenshots to show you how it works with other instruments.
Happy Trading!