Smart Money Support/Resistance - LiteSmart Money Support/Resistance — Lite
Overview & Methodology
This indicator identifies support and resistance as zones derived from concentrated buying and selling pressure, rather than relying solely on traditional swing highs/lows. Its design focuses on transparency: how data is sourced, how zones are computed, and how the on‑chart display should be interpreted.
Lower‑Timeframe (LTF) Data
The script requests Up Volume, Down Volume, and Volume Delta from a lower timeframe to expose intrabar order‑flow structure that the chart’s native timeframe cannot show. In practical terms, this lets you see where buyers or sellers briefly dominated inside the body of a higher‑timeframe bar.
bool use_custom_tf_input = input.bool(true, title="Use custom lower timeframe", tooltip="Override the automatically chosen lower timeframe for volume calculations.", group=grpVolume)
string custom_tf_input = input. Timeframe("1", title="Lower timeframe", tooltip="Lower timeframe used for up/down volume calculations (default 5 seconds).", group=grpVolume)
import TradingView/ta/10 as tvta
resolve_lower_tf(useCustom, customTF) =>
useCustom ? customTF :
timeframe.isseconds ? "1S" :
timeframe.isintraday ? "1" :
timeframe.isdaily ? "5" : "60"
get_up_down_volume(lowerTf) =>
= tvta.requestUpAndDownVolume(lowerTf)
var float upVolume = na
var float downVolume = na
var float deltaVolume = na
string lower_tf = resolve_lower_tf(use_custom_tf_input, custom_tf_input)
= get_up_down_volume(lower_tf)
upVolume := u_tmp
downVolume := d_tmp
deltaVolume := dl_tmp
• Data source: TradingView’s ta.requestUpAndDownVolume(lowerTf) via the official TA library.
• Plan capabilities: higher‑tier subscriptions unlock seconds‑based charts and allow more historical bars per chart. This expands both the temporal depth of LTF data and the precision of short‑horizon analysis, while base tiers provide minute‑level data suitable for day/short‑swing studies.
• Coverage clarity: a small on‑chart Coverage Panel reports the active lower timeframe, the number of bars covered, and the latest computed support/resistance ranges so you always know the bounds of valid LTF input.
Core Method
1) Data acquisition (LTF)
The script retrieves three series from the chosen lower timeframe:
– Up Volume (buyers)
– Down Volume (sellers)
– Delta (Up – Down)
2) Rolling window & extrema
Over a user‑defined lookback (Global Volume Period), the algorithm builds rolling arrays of completed bars and scans for extrema:
– Buyers_max / Buyers_min from Up Volume
– Sellers_max / Sellers_min from Down Volume
Only completed bars are considered; the current bar is excluded for stability.
3) Price mapping
The extrema are mapped back to their source candles to obtain price bounds:
– For “maximum” roles the algorithm uses the relevant candle highs.
– For “minimum” roles it uses the relevant candle lows.
These pairs define candidate resistance (max‑based) and support (min‑based) zones or vice versa.
4) Zone construction & minimum width
To ensure practicality on all symbols, zones enforce a minimum vertical thickness of two ticks. This prevents visually invisible or overly thin ranges on instruments with tight ticks.
5) Vertical role resolution
When both max‑ and min‑based zones exist, the script compares their midpoints. If, due to local price structure, the min‑based zone sits above the max‑based zone, display roles are swapped so the higher zone is labeled Resistance and the lower zone Support. Colors/widths are updated accordingly to keep the visual legend consistent.
6) Rendering & panel
Two horizontal lines and a filled box represent each active zone. The Coverage Panel (bottom‑right by default) prints:
– Lower‑timeframe in use
– Number of bars covered by LTF data
– Current Support and Resistance ranges
If the two zones overlap, an additional “Range Market” note is shown.
Key Inputs
• Global Volume Period: shared lookback window for the extrema search.
• Lower timeframe: user‑selectable override of the automatically resolved lower timeframe.
• Visualization toggles: independent show/hide controls and colors for maximum (resistance) and minimum (support) zones.
• Coverage Panel: enable/disable the single‑cell table and its readout.
Operational Notes
• The algorithm aligns all lookups to completed bars (no peeking). Price references are shifted appropriately to avoid using the still‑forming bar in calculations.
• Second‑based lower timeframes improve granularity for scalping and very short‑term entries. Minute‑based lower timeframes provide broader coverage for intraday and short‑swing contexts.
• Use the Coverage Panel to confirm the true extent of available LTF history on your symbol/plan before drawing conclusions from very deep lookbacks.
Visual Walkthrough
A step‑by‑step image sequence accompanies this description. Each figure demonstrates how the indicator reads LTF volume, locates extrema, builds price‑mapped zones, and updates labels/colors when vertical order requires it.
Chart Interpretation
This chart illustrates two distinct perspectives of the Smart Money Support/Resistance — Lite indicator, each derived from different lookback horizons and lower-timeframe (LTF) resolutions.
1- Short-term view (43 bars, 10-second LTF)
Using the most recent 43 completed bars with 10-second intrabar data, the algorithm detects that both maximum and minimum volume extrema fall within a narrow range. The result is a clearly identified range market: resistance between 178.15–184.55 and support between 175.02–179.38.
The Coverage Panel (bottom-right) confirms the scope of valid input: the lower timeframe used, number of bars covered, and the resulting zones. This short-term scan highlights how the indicator adapts to limited data depth, flagging sideways structure where neither side dominates.
2 - Long-term view (120 bars, 30-second LTF)
Over a wider 120-bar lookback with higher-granularity 30-second data, broader supply and demand zones emerge.
– The long-term resistance zone captures the concentration of buyers and sellers at the upper boundary of recent price history.
– The long-term support zone anchors to the opposite side of the distribution, derived from maxima and minima of both buying and selling pressure.
These zones reflect deeper structural levels where market participants previously committed significant volume.
Combined Perspective
By aligning the short-term and long-term outputs, the chart shows how the indicator distinguishes immediate consolidation (range market) from more durable support and resistance levels derived from extended history. This dual resolution approach makes clear that support and resistance are not static lines but dynamic zones, dependent on both timeframe depth and the resolution of intrabar volume data.
Btcusdanalysis

Ralph Indicator - ZaraTrust Smart MoneyThe Ralph Indicator – ZaraTrust Smart Money is a powerful yet simple Smart Money Concepts (SMC) based tool designed for traders who want to trade like institutions. It auto-detects high-probability Buy/Sell zones, Support/Resistance levels, and Demand/Supply areas on the chart — giving you clear, visual, and actionable signals without the clutter.
⸻
🔍 Key Features:
✅ Smart Money Structure
• Uses pivot-based logic to identify potential structure points
• Helps you understand market flow (e.g., BOS, CHoCH simplified logic)
✅ Automatic Support & Resistance
• Plots major levels based on significant highs and lows
• Helps catch key reversal or breakout zones
✅ Demand & Supply Zones
• Visually shows areas where price may react strongly
• Based on smart pivot detection from recent swings
✅ Buy/Sell Trade Signals
• Highlights buy when price breaks resistance (possible bullish shift)
• Highlights sell when price breaks support (possible bearish shift)
✅ Clean & Easy UI
• Toggle features on/off from settings panel
• Labels and shapes are plotted clearly on the chart for instant reading
⸻
🛠️ Recommended Use:
• Use on 15min to 4H timeframe for intraday or swing trading
• Combine with price action (e.g., confirmation candles, liquidity grab)
• Works best when paired with institutional logic (OBs, FVG, liquidity)
⸻
⚠️ Disclaimer:
This indicator is a tool, not a signal service.
It does not guarantee 98% accuracy, but it’s designed to highlight smart money zones and high-probability areas. Always do your own risk management and backtest before using on a live account.

Bull Momentum GaugeBull Momentum Gauge
The Bull Momentum Gauge is a powerful momentum oscillator designed to identify the underlying strength and sustainability of major market trends. Instead of trying to predict tops and bottoms, this indicator helps traders and investors ride long-term bull markets by signaling when momentum is building and when it is starting to fade.
What it Does
At its core, this tool measures how statistically "stretched" or "compressed" an asset's price is relative to its long-term (1-year) trend. It does this by:
Calculating the price's deviation from its 365-day moving average.
Normalizing this deviation into a Z-score to measure its statistical significance.
Comparing the inverted Z-score to its own 200-day moving average to gauge the momentum of the trend itself.
The result is a single, smooth line that oscillates around a zero value.
How to Use It
The signals are simple and based on the indicator's relationship to the zero line:
Green Line (Gauge below 0): This indicates that the price has been compressed relative to its long-term trend and is now showing signs of building upward momentum. A cross into the green zone can be interpreted as a potential entry signal for a new bull run.
Red Line (Gauge above 0): This suggests that the price has become over-extended or "stretched" and the upward momentum is beginning to weaken. A cross into the red zone can be used as a potential exit signal, indicating it may be time to take profits and wait for the next cycle.
This indicator is designed to work across multiple timeframes (Daily, Weekly, Monthly) and provides a clear, data-driven framework for navigating major market cycles.

Super Arma Institucional PRO v6.3Super Arma Institucional PRO v6.3
Description
Super Arma Institucional PRO v6.3 is a multifunctional indicator designed for traders looking for a clear and objective analysis of the market, focusing on trends, key price levels and high liquidity zones. It combines three essential elements: moving averages (EMA 20, SMA 50, EMA 200), dynamic support and resistance, and volume-based liquidity zones. This integration offers an institutional view of the market, ideal for identifying strategic entry and exit points.
How it Works
Moving Averages:
EMA 20 (orange): Sensitive to short-term movements, ideal for capturing fast trends.
SMA 50 (blue): Represents the medium-term trend, smoothing out fluctuations.
EMA 200 (red): Indicates the long-term trend, used as a reference for the general market bias.
Support and Resistance: Calculated based on the highest and lowest prices over a defined period (default: 20 bars). These dynamic levels help identify zones where the price may encounter barriers or supports.
Liquidity Zones: Purple rectangles are drawn in areas of significantly above-average volume, indicating regions where large market participants (institutional) may be active. These zones are useful for anticipating price movements or order absorption.
Purpose
The indicator was developed to provide a clean and institutional view of the market, combining classic tools (moving averages and support/resistance) with modern liquidity analysis. It is ideal for traders operating swing trading or position trading strategies, allowing to identify:
Short, medium and long-term trends.
Key support and resistance levels to plan entries and exits.
High liquidity zones where institutional orders can influence the price.
Settings
Show EMA 20 (true): Enables/disables the 20-period EMA.
Show SMA 50 (true): Enables/disables the 50-period SMA.
Show EMA 200 (true): Enables/disables the 200-period EMA.
Support/Resistance Period (20): Sets the period for calculating support and resistance levels.
Liquidity Sensitivity (20): Period for calculating the average volume.
Minimum Liquidity Factor (1.5): Multiplier of the average volume to identify high liquidity zones.
How to Use
Moving Averages:
Crossovers between the EMA 20 and SMA 50 may indicate short/medium-term trend changes.
The EMA 200 serves as a reference for the long-term bias (above = bullish, below = bearish).
Support and Resistance: Use the red (resistance) and green (support) lines to identify reversal or consolidation zones.
Liquidity Zones: The purple rectangles highlight areas of high volume, where the price may react (reversal or breakout). Consider these zones to place orders or manage risks.
Adjust the parameters according to the asset and timeframe to optimize the analysis.
Notes
The chart should be configured only with this indicator to ensure clarity.
Use on timeframes such as 1 hour, 4 hours or daily for better visualization of liquidity zones and support/resistance levels.
Avoid adding other indicators to the chart to keep the script output easily identifiable.
The indicator is designed to be clean, without explicit buy/sell signals, following an institutional approach.
This indicator is perfect for traders who want a visually clear and powerful tool to trade based on trends, key levels and institutional behavior.

MestreDoFOMO MACD VisualMasterDoFOMO MACD Visual
Description
MasterDoFOMO MACD Visual is a custom indicator that combines a unique approach to MACD with stochastic logic and simulated Renko-based direction signals. It is designed to help traders identify entry and exit opportunities based on market momentum and trend changes, with a clear and intuitive visualization.
How It Works
Stylized MACD with Stochastic: The indicator calculates the MACD using EMAs (exponential moving averages) normalized by stochastic logic. This is done by subtracting the lowest price (lowest low) from a defined period and dividing by the range between the highest and lowest price (highest high - lowest low). The result is a MACD that is more sensitive to market conditions, magnified by a factor of 10 for better visualization.
Signal Line: An EMA of the MACD is plotted as a signal line, allowing you to identify crossovers that indicate potential trend reversals or continuations.
Histogram: The difference between the MACD and the signal line is displayed as a histogram, with distinct colors (fuchsia for positive, purple for negative) to make momentum easier to read.
Simulated Renko Direction: Uses ATR (Average True Range) to calculate the size of Renko "bricks", generating signals of change in direction (bullish or bearish). These signals are displayed as arrows on the chart, helping to identify trend reversals.
Purpose
The indicator combines the sensitivity of the Stochastic MACD with the robustness of Renko signals to provide a versatile tool. It is ideal for traders looking to capture momentum-based market movements (using the MACD and histogram) while confirming trend changes with Renko signals. This combination reduces false signals and improves accuracy in volatile markets.
Settings
Stochastic Period (45): Sets the period for calculating the Stochastic range (highest high - lowest low).
Fast EMA Period (12): Period of the fast EMA used in the MACD.
Slow EMA Period (26): Period of the slow EMA used in the MACD.
Signal Line Period (9): Period of the EMA of the signal line.
Overbought/Oversold Levels (1.0/-1.0): Thresholds for identifying extreme conditions in the MACD.
ATR Period (14): Period for calculating the Renko brick size.
ATR Multiplier (1.0): Adjusts the Renko brick size.
Show Histogram: Enables/disables the histogram.
Show Renko Markers: Enables/disables the Renko direction arrows.
How to Use
MACD Crossovers: A MACD crossover above the signal line indicates potential bullishness, while below suggests bearishness.
Histogram: Fuchsia bars indicate bullish momentum; purple bars indicate bearish momentum.
Renko Arrows: Green arrows (upward triangle) signal a change to an uptrend; red arrows (downward triangle) signal a downtrend.
Overbought/Oversold Levels: Use the levels to identify potential reversals when the MACD reaches extreme values.
Notes
The chart should be set up with this indicator in isolation for better clarity.
Adjust the periods and ATR multiplier according to the asset and timeframe used.
Use the built-in alerts ("Renko Up Signal" and "Renko Down Signal") to set up notifications of direction changes.
This indicator is ideal for day traders and swing traders who want a visually clear and functional tool for trading based on momentum and trends.

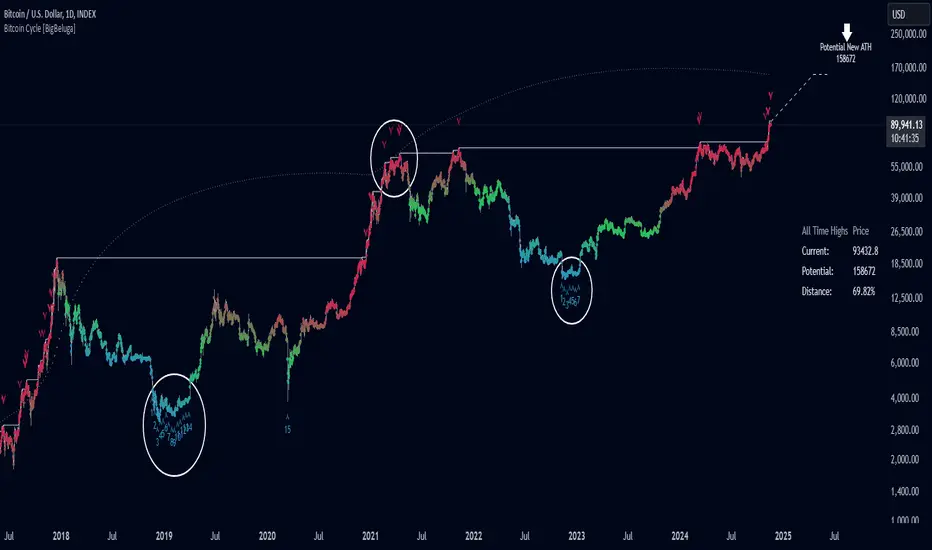
Bitcoin Cycle [BigBeluga]Bitcoin Cycle Indicator is designed exclusively for analyzing Bitcoin’s long-term market cycles, working only on the 1D BTC chart . This indicator provides an in-depth view of potential cycle tops and bottoms, assisting traders in identifying key phases in Bitcoin’s market evolution.
🔵 Key Features:
Heatmap Cycle Phases: The indicator colors each cycle from blue to red , reflecting Bitcoin’s market cycle progression. Cooler colors (blue/green) signal potential accumulation or early growth phases, while warmer colors (yellow/red) indicate maturation and potential top regions.
All-Time High (ATH) and Future ATH Projection: Tracks the current ATH in real-time, while applying a linear regression model to project a possible new ATH in the future. This projection aims to provide insights into the next major cycle peak for long-term strategy.
Dashboard Overview: Displays the current ATH, potential new ATH, and the percentage distance between them. This helps users assess how far the current price is from the projected target.
Top & Bottom Cycle Signals: Red down arrows mark significant price peaks, potentially indicating cycle tops. Up arrows, numbered sequentially (inside each cycle), denote possible bottom signals for strategic DCA (Dollar Cost Averaging) entries.
1D BTC Chart Only: Built solely for the 1D BTC timeframe. Switching to any other timeframe or asset will trigger a warning message: " BTC 1D Only ." This ensures accuracy in analyzing Bitcoin’s unique cyclical behavior.
🔵 When to Use:
Ideal for long-term Bitcoin investors and cycle analysts, the Bitcoin Cycle Indicator empowers users to:
Identify key accumulation and distribution phases.
Track Bitcoin’s cyclical highs and lows with visual heatmap cues.
Estimate future potential highs based on historical patterns.
Strategize long-term positions by monitoring cycle tops and possible accumulation zones.
By visualizing Bitcoin’s cycles with color-coded clarity and top/bottom markers, this indicator is an essential tool for any BTC analyst aiming to navigate market cycles effectively.
Relative volume zone + Smart Order Flow Dynamic S/ROverview:
The Relative Volume Zone + Smart Order Flow with Dynamic S/R indicator is designed to help traders identify key trading opportunities by combining multiple technical components. This script integrates relative volume analysis, order flow detection, VWAP, RSI filtering, and dynamic support and resistance levels to offer a comprehensive view of the market conditions. It is particularly effective on shorter timeframes (M5, M15), making it suitable for scalping and day trading strategies.
Key Components:
1. Relative Volume Zones:
• The script calculates the relative volume by comparing the current volume with the average volume over a defined lookback period (volLookback). When the relative volume exceeds a specified multiplier (volMultiplier), it indicates a high volume zone, signaling potential accumulation or distribution areas.
• Purpose: Identifies high-volume trading zones that may act as significant support or resistance, indicating possible entry or exit points.
2. Smart Order Flow Analysis:
• The indicator uses Volume Delta (the difference between buying and selling volume) and a Cumulative Delta to detect order imbalances in the market.
• Order Imbalance is identified using a moving average of the Volume Delta (orderImbalance), which helps highlight hidden buying or selling pressure.
• Purpose: Reveals market sentiment by showing whether buyers or sellers dominate the market, aiding in the identification of trend reversals or continuations.
3. VWAP (Volume Weighted Average Price):
• VWAP is calculated over a default daily length (vwapLength) to show the average price a security has traded at throughout the day, based on both volume and price.
• Purpose: Provides insight into the fair value of the asset, indicating whether the market is in an accumulation or distribution phase.
4. RSI (Relative Strength Index) Filter:
• RSI is used to filter buy and sell signals, preventing trades in overbought or oversold conditions. It is calculated using a specified period (rsiPeriod).
• Purpose: Reduces false signals and improves trade accuracy by only allowing trades when RSI conditions align with volume and order flow signals.
5. Dynamic Support and Resistance Levels:
• The script dynamically plots support and resistance levels based on recent swing highs and lows (swingLookback).
• Purpose: Identifies potential reversal zones where price action may change direction, allowing for more precise entry and exit points.
How It Works:
• Buy Signal:
A buy signal is generated when:
• The price enters a high-volume zone.
• The price crosses above a 5-period moving average.
• The cumulative delta shows more buying pressure (cumulativeDelta > SMA of cumulativeDelta).
• The RSI is below 70 (not in overbought conditions).
• Sell Signal:
A sell signal is generated when:
• The price enters a high-volume zone.
• The price crosses below a 5-period moving average.
• The cumulative delta shows more selling pressure (cumulativeDelta < SMA of cumulativeDelta).
• The RSI is above 30 (not in oversold conditions).
• Dynamic Support and Resistance Lines:
Drawn based on recent swing highs and lows, these lines provide context for potential price reversals or breakouts.
• VWAP and Order Imbalance Lines:
Plotted to show the average traded price and highlight order flow shifts, helping to validate buy/sell signals.
How to Use:
1. Apply the Indicator:
Add the script to your chart and adjust the settings to match your trading style and preferred timeframe (optimized for M5/M15).
2. Interpret the Signals:
Use the buy and sell signals in conjunction with dynamic support/resistance, VWAP, and order imbalance lines to identify high-probability trade setups.
3. Monitor Alerts:
Set alerts for significant order flow events to receive notifications when there is a positive or negative order imbalance, indicating potential market shifts.
What Makes It Unique:
This script is unique because it combines multiple market analysis tools — relative volume zones, smart order flow, VWAP, RSI filtering, and dynamic support/resistance — to provide a well-rounded, multi-dimensional view of the market. This integration allows traders to make more informed decisions by validating signals across various indicators, enhancing overall trading accuracy and effectiveness.

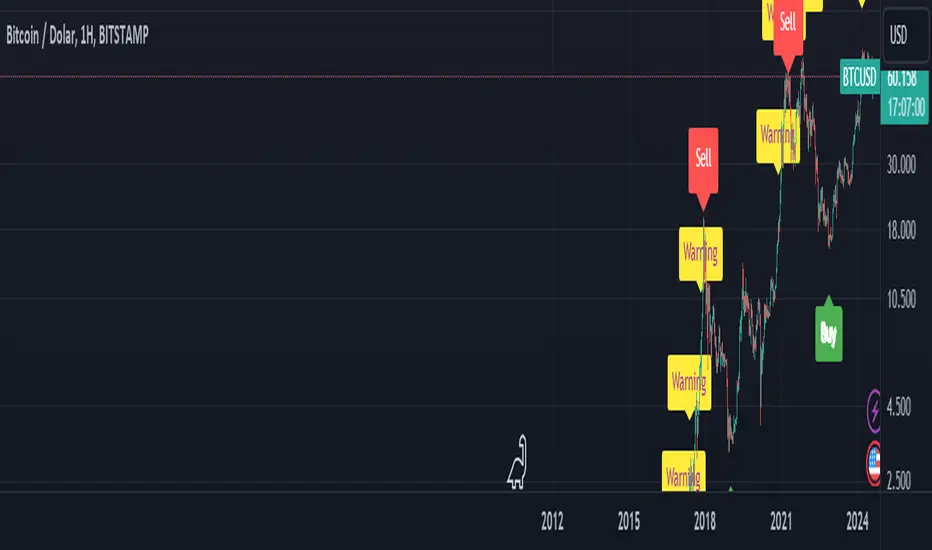
BTC Arcturus IndicatorBTC Arcturus Indicator: This indicator is designed to create buy and sell signals based on the market value of Bitcoin. It also predicts potential market tops with the Pi Cycle Top indicator.
How Does It Work?
1. MVRVZ (Market Value to Realized Value-Z Score) Calculation:
MC: Bitcoin's market cap (Market Cap) is pulled daily from Glassnode data.
MCR: Realized Market Cap of Bitcoin is taken daily from Coinmetrics data.
MVRVZ: It is calculated by dividing the difference between Bitcoin's market value and realized market value by one standard deviation. This value indicates whether the market is overvalued or undervalued.
2. Reception and Warning Signals:
Buy Signal: When MVRVZ falls below the -0.255 threshold value, the indicator gives a "Buy" signal. This indicates that Bitcoin is undervalued and may be a buying opportunity.
Warning Signal: A warning signal turns on when MVRVZ exceeds the threshold value of 2.765. This indicates that the market is approaching saturation and caution is warranted.
3. Tracking the Highest MVRVZ Value:
The indicator records the highest MVRVZ value in the last 10 candlesticks. This value is used to determine whether the market has reached its highest risk levels.
4. Warning Display:
If the MVRVZ value matches the highest value in the last 10 bars and this warning has not been displayed before, a "Warning" signal is displayed.
Once the warning signal is shown, no further warnings are shown for 10 candles.
5. Pi Cycle Top Indicator:
Pi Cycle Top: This indicator predicts Bitcoin tops by comparing two moving averages (350-day and 111-day). If the short-term moving average falls below the long-term moving average, this is considered a sell signal.
The indicator displays this signal with the label "Sell", indicating a potential market top.
User Guide:
Green Buy Signal: It means Bitcoin is cheap and offers a buying opportunity.
Yellow Warning Signal: Indicates that Bitcoin has reached possible profit taking points and caution should be exercised.
Red Sell Signal: Indicates that Bitcoin has reached market saturation and it may be appropriate to sell.
Heat Map SeasonsHeat Map Seasons indicator
Indicator offers traders a unique perspective on market dynamics by visualizing seasonal trends and deviations from typical price behavior. By blending regression analysis with a color-coded heat map, this indicator highlights periods of heightened volatility and helps identify potential shifts in market sentiment.
Summer:
In the context of the indicator, "summer" represents a period of heightened volatility and upward price momentum in the market. This is analogous to the warmer months of the year when activities are typically more vibrant and energetic. During the "summer" phase indicated by the indicator, traders may observe strong bullish trends, increased trading volumes, and larger price movements. It suggests a favorable environment for bullish strategies, such as trend following or momentum trading. However, traders should exercise caution as heightened volatility can also lead to increased risk and potential drawdowns.
Winter:
Conversely, "winter" signifies a period of decreased volatility and potentially sideways or bearish price action in the market. Similar to the colder months of the year when activities tend to slow down, the "winter" phase in the indicator suggests a quieter market environment with subdued price movements and lower trading volumes. During this phase, traders may encounter choppy price action, consolidation patterns, or even downtrends. It indicates a challenging environment for trend-following strategies and may require a more cautious approach, such as range-bound or mean-reversion trading strategies.
In summary, the "summer" and "winter" phases in the "Heat Map Seasons" indicator provide traders with valuable insights into the prevailing market sentiment and can help inform their trading decisions based on the observed levels of volatility and price momentum.
How to Use:
Watch for price bars that deviate significantly from the regression line , as these may signal potential trading opportunities.
Use the seasonal gauge to gauge the current market sentiment and adjust trading strategies accordingly.
Experiment with different settings for Length and Heat Sensitivity to customize the indicator to your trading style and preferences.
The "Heat Map Seasons" indicator can potentially identify overheated market tops and bottoms on a weekly timeframe by detecting significant deviations from the regression line and observing extreme color gradients in the heat map. Here's how it can be used for this purpose:
Observing Extreme Color Gradients:
When the market is overheated and reaches a potential top, you may observe extremely warm colors (e.g., deep red) in the heat map section of the indicator.
Traders can interpret this as a warning sign of a potential market top, indicating that bullish momentum may be reaching unsustainable levels.
Conversely, when prices deviate too far below the regression line, it may indicate oversold conditions and a potential bottom.
Potential Tops and Bottoms:
User Inputs:
Length: Determines the length of the regression analysis period.
Heat Sensitivity: Controls the sensitivity of the heat map to deviations from the regression line.
Show Regression Line: Option to display or hide the regression line on the chart
Note: This indicator is best used in conjunction with other technical analysis tools and should not be relied upon as the sole basis for trading decisions.

BTC Valuation
The BTC Valuation indicator
is a powerful tool designed to assist traders and analysts in evaluating the current state of Bitcoin's market valuation. By leveraging key moving averages and a logarithmic trendline, this indicator offers valuable insights into potential buying or selling opportunities based on historical price value.
Key Features:
200MA/P (200-day Moving Average to Price Ratio):
Provides a perspective on Bitcoin's long-term trend by comparing the current price to its 200-day Simple Moving Average (SMA).
A positive value suggests potential undervaluation, while a negative value may indicate overvaluation.
50MA/P (50-day Moving Average to Price Ratio):
Focuses on short-term trends, offering insights into the relationship between Bitcoin's current price and its 50-day SMA.
Helps traders identify potential bullish or bearish trends in the near term.
LTL/P (Logarithmic TrendLine to Price Ratio):
Incorporates a logarithmic trendline, considering Bitcoin's historical age in days.
Assists in evaluating whether the current price aligns with the long-term logarithmic trend, signaling potential overvaluation or undervaluation.
How to Use:
Z Score Indicator Integration:
The BTC Valuation indicator leverages the Z Score Indicator to score the ratios in a statistical way.
Statistical scoring provides a standardized measure of how far each ratio deviates from the mean, aiding in a more nuanced and objective evaluation.
Z Score Indicator
This BTC Valuation indicator provides a comprehensive view of Bitcoin's valuation dynamics, allowing traders to make informed decisions.
While indicators like BTC Valuation provide valuable insights, it's crucial to remember that no indicator guarantees market predictions.
Traders should use indicators as part of a comprehensive strategy and consider multiple factors before making trading decisions.
Historical performance is not indicative of future results. Exercise caution and continually refine your approach based on market dynamics.

Highest-Lowest Trend𝙃𝙄𝙂𝙃𝙀𝙎𝙏-𝙇𝙊𝙒𝙀𝙎𝙏 𝙏𝙍𝙀𝙉𝘿 𝙄𝙉𝘿𝙄𝘾𝘼𝙏𝙊𝙍
Overview:
The "Highest-Lowest Trend" indicator helps traders identify trends based on the highest and lowest values within a specified period. It provides visual cues to understand potential trend changes, making it a valuable tool for technical analysis.
Settings:
Length and Offset: Adjust the length and offset parameters to customize the sensitivity of the indicator.
Source: Determines whether to use the high and low prices or the closing price and others for calculations.
Visual Settings:
Bar Color: Enables or disables the coloring of bars based on the trend direction.
Up Color: Specifies the color for upward trends.
Down Color: Specifies the color for downward trends.
Indicator Calculation:
The indicator calculates the highest and lowest values within the defined length and offset.
The current trend is determined based on whether the closing price is above or below these values.
When the source crossed above highest indicator changes trend to upside and start to use lowest value and vice versa.
/// 𝙄𝙉𝘿𝙄𝘾𝘼𝙏𝙊𝙍 𝘾𝘼𝙇𝘾𝙐𝙇𝘼𝙏𝙄𝙊𝙉 ///
var series float hlt = 0.0
series float upper = ta.highest(Use_High_and_Low ? high : src, length)
series float lower = ta.lowest( Use_High_and_Low ? high : src, length)
hlt := src > upper ?
lower : src < lower ?
upper : nz(hlt)
Usage:
Trend Identification: Watch for price to be above Trend Indicator crosses for up trend and below for down trend.
Length and Offset: Adjust the length and offset parameters to customize the sensitivity of the indicator.
Color, color bars: Change color of trends and bars for your taste
Note:
Trading involves inherent risks, and it is essential to exercise caution and employ multiple tools and indicators for comprehensive analysis. While the "Highest-Lowest Trend" indicator provides valuable insights into potential trend changes, relying solely on one tool for trading decisions is not recommended. Market conditions can be dynamic, and using a combination of indicators can enhance your overall analysis, providing a more robust foundation for decision-making. Always consider the broader market context, risk management strategies, and other relevant factors before executing trades.
EMA Power BandsHello!
Today, I am delighted to introduce you to the "EMA Power Bands" indicator, designed to assist in identifying buying and selling points for assets moving in the markets.
Key Features of the Indicator:
EMA Bands: "EMA Power Bands" utilizes Exponential Moving Average (EMA) to create trend lines. These bands automatically expand or contract based on the price trend, adapting to market conditions.
ATR-Based Volatility: The indicator measures price volatility using the Average True Range (ATR) indicator, adjusting the width of the EMA bands accordingly. As a result, wider bands form during periods of increased volatility, while they narrow during lower volatility.
RSI-Based Buy-Sell Signals: "EMA Power Bands" uses the Relative Strength Index (RSI) to identify overbought and oversold zones. Entering the overbought zone generates a sell signal, while entering the oversold zone produces a buy signal.
Trend Direction Identification: The indicator assists in determining the price trend direction by analyzing the slope of the EMA bands. This allows you to identify periods of uptrends and downtrends.
Visualization of Buy-Sell Signals: "EMA Power Bands" visually marks the buy and sell signals:
- When RSI enters the overbought zone, it displays a sell signal (🪫).
- When RSI enters the oversold zone, it indicates a buy signal (🔋).
- When a candle closes above the emaup line, it displays a bearish signal (🔨).
- When a candle closes below the emadw line, it indicates a bullish signal (🚀).
By using the "EMA Power Bands" (EMA Güç Bantları) indicator, especially in trend-following strategies and periods of volatility, you can make more informed and disciplined trading decisions. However, I recommend using it in conjunction with other technical analysis tools and fundamental data.
*You can also use it with CCI as an example.
With this indicator, you can identify potential trend reversals in advance and strengthen your risk management strategies.
So, go ahead and try the "EMA Power Bands" (EMA Güç Bantları) indicator to enhance your technical analysis skills and make more informed trading decisions!

BTC Longs & Shorts Profile WHAT DOES THIS INDICATOR DO?
I started with the idea of creating another premium indicator with a bunch of features and add it to the bundle. However, the more complex the code was becoming, the less helpful the indicator actually was. So I started from scratch and made BTC Longs & Shorts Profile super simple (as you can see in the code).
The advantage over other similar indicators is that this one has a drop-down menu and allows you to select whether you want to see Longs, Shorts, Ratio, or Difference. Having Longs and Shorts at the same time is a bit confusing because Longs pretty much dwarf the Shorts and the ups and downs are not clearly visible. Also, you can configure the colors for each visible line.
My suggestion is to add this indicator to your BTC chart, save it as a template from the top menu on TradingView and stop switching between BTC, Bitfinex Longs and Shorts. You have everything in one simple window (that's especially the case if you are not a pro or premium member and can't have more than 2 screens simultaneously).
ANYTHING ELSE ?
On a side note, if you are planning on working on a similar indicator, let me tell you what I've tried so far and it didn't work for me:
- RSI calculations including Longs and Shorts as a base
- Longs and Shorts in relation to BTC itself and a relationship with the volume
- Directional Movement Index, where Longs are DM+ and Shorts are DM-
- Smoothing both Longs and Shorts and trying to find a relationship (including some pseudo MACD lookalikes)
Anyway, if you have any ideas or suggestions on improving this indicator, please let me know. Thanks!
