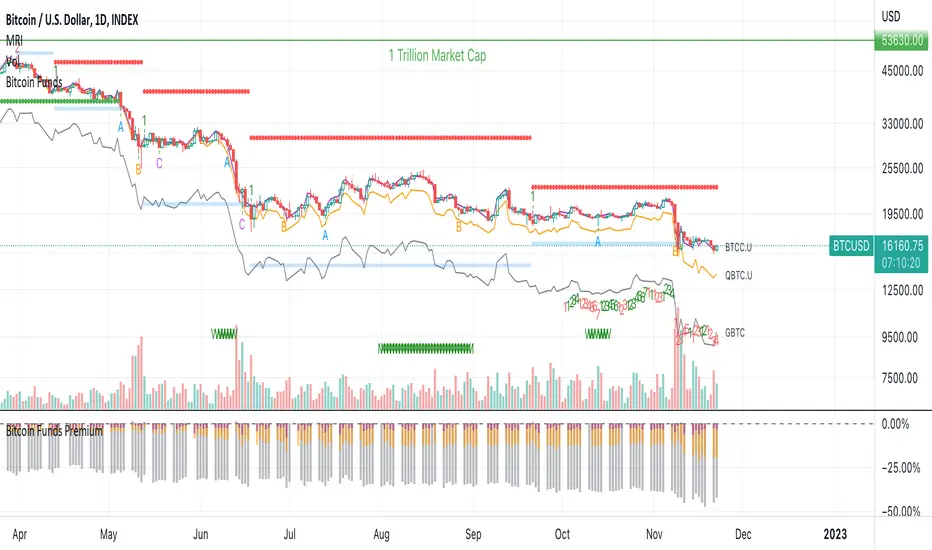
Bitcoin Funds PremiumDisplay the % premium of 4 different Bitcoin Funds relative to the price of Bitcoin in your current chart.
BTCC ETF
QBTC Fund
GBTC Trust
VBTC ETN
This indicator uses the metrics from the fund management websites to calculate the "Net Asset Value per Unit (NAVPU)" to calculate the true underlying value of the fund.
The difference is then compared to the price of Bitcoin in the chart you have open.
Note that the metrics change and therefore the graph is not accurate for long past timeframes.
If TradingView would expand their script language in a way to ingest CSV data from the funds website then this could be improved.
You can update the metrics for each fund in the settings dialogue.
The script will autodetect the currency pairs of your current graph and only display compatible funds:
BTC / USD will show BTCC.U, QBTC.U and GBTC
BTC / CAD will show BTCC and QBTC
BTC / EUR will show VBTC
The script should not show in other currency pairs so it will not mess up other charts you might switch to.
If you find bugs with this logic, please comment below so I can fix them.
Due to TradingViews "no-links in description" policy, you need to google each funds website yourself to find the current metrics. These search terms should help:
BTCC search "Purpose Bitcoin ETF"
QBTC search "3iq The Bitcoin Fund (QBTC)"
GBTC search "Grayscale® Bitcoin Trust"
VBTC search "VanEck Vectors Bitcoin ETN"
BTCEUR
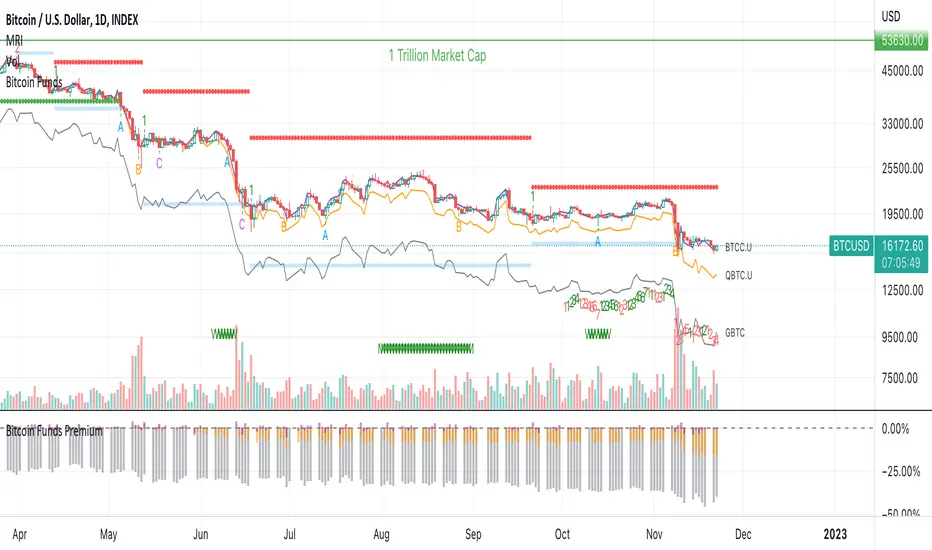
Bitcoin Funds OverlayOverlay the Net Asset Value per Unit (NAVPU) of 4 different Bitcoin Funds on your Bitcoin chart.
BTCC ETF
QBTC Fund
GBTC Trust
VBTC ETN
This indicator uses the metrics from the fund management websites to calculate the "Net Asset Value per Unit (NAVPU)" to display the true underlying value of the fund.
Note that the metrics can change and therefore the graph is not accurate for long past timeframes.
You can update the metrics for each fund in the settings dialogue.
The script will autodetect the currency pairs of your current graph and only display compatible funds:
BTC / USD will show BTCC.U, QBTC.U and GBTC
BTC / CAD will show BTCC and QBTC
BTC / EUR will show VBTC
The script should not show in other currency pairs so it will not mess up other charts you might switch to.
If you find bugs with this logic, please comment below so I can fix them.
Due to TradingViews "no-links in description" policy, you need to google each funds website yourself to find the current metrics. These search terms should help:
BTCC search "Purpose Bitcoin ETF"
QBTC search "3iq The Bitcoin Fund (QBTC)"
GBTC search "Grayscale® Bitcoin Trust"
VBTC search "VanEck Vectors Bitcoin ETN"
Heikin Ashi + Price Action Crypto LONG StrategyThis is a simple and efficient crypto strategy, designed for big timeframes like 12/24h.
On history it beats buy and hold strategy in many ocasions, and because of a low DD, pyramid can be used to elevate our winnings while still keeping a low DD < 40% avg.
For the purpose of this example, I used 100% of the capital on each trades, together with a comission of 0.1%
Warning : THERE IS NO STOP LOSS ON THIS STRATEGY ,USE IT AT YOUR OWN RISK
This strategy is made with inside Heikin Ashi candles , together with some price actions logics like for long Close > High and green candle and High > High .
We exit when we have a red candle and the current close is lower than the previous Low
If you have any questions, message me in private !

Crypto Long only Strategy 3h+ timeframeToday I bring another crypto strategy that works greatly with pairs like BTCEUR, ETHEUR, for 3h+ time frames.
Its a risky strategy because we have a hard stop loss of 25% of our capital which can be modified.
The idea behind its simple, we have a candle which is made from open+high+low+close / 4 , and we make the decision based on this one.
We only go long with this strategy .
For entry: if we have 5 ascending candles we enter, and we exit when we have 4 descending candles.
For this example, I used 100% of the initial capital(1000 EUR/USD), with a commission of 0.1% per each deal.
At the same time, the max capital that can be lost in a trade is going to be the equity risk, in this example 25% .
Overall we can see that's more or less around the same level as buy and hold strategy

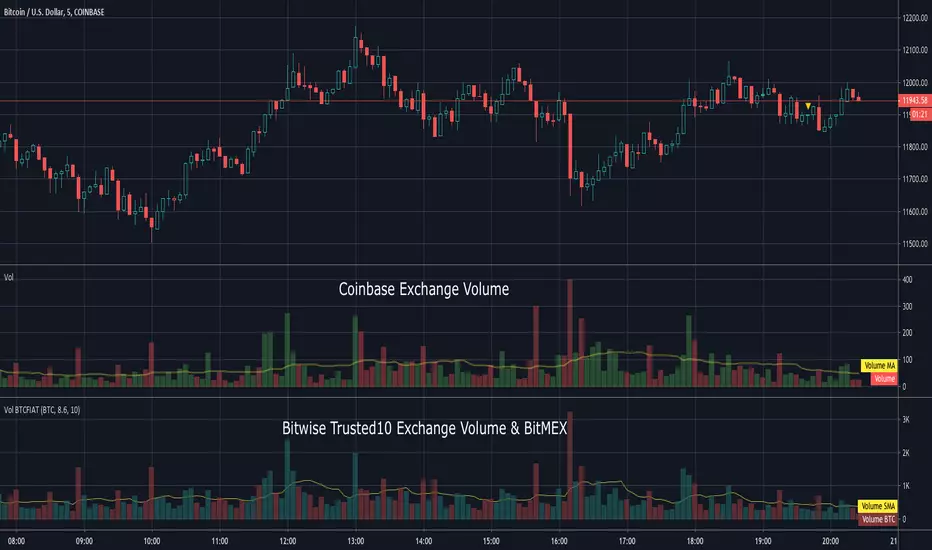
Volume BTCFIATThis indicator shows the aggregated volume of BTCFIAT of the Bitwise "Trusted 10" Exchanges that are available on TradingView.
I did not include every currency or stable coin available on these exchanges due to some being inconsequential in volume .
I also included option to show BitMEX deleveraged amount. Recent report suggests average leverage used there is 8.6X.
Volume can be shown in BTC or USD amounts. The moving average can be adjusted and if set to 0 will hide it.
Due to the number of lookups please be patient while loading. It will take a moment to display.
To load search Indicators for "Volume BTCFIAT" and click to load.
This indicator does not require access from me.
Bitcoin Fat Volume IndicatorBitcoin Fat Volume Indicator
The script displays aggregate sums of Bitcoin dollar and Tether market volumes separately as follows:
USD markets (blue): gemini, coinbase, okcoin, kraken, bitfinex, bitstamp, btce, mtgox
Tether markets (orange): huobi, binance, bittrex, poloniex, hitbtc
The indicator should work on all time frames on any chart so long as volume data exists. Obviously for full history use Bitcoin Liquid Index.
The indicator is slow that's why I'm not including other stable coins or fiat markets at present.
Use settings to turn off Tether or USD bars as desired.

VolumeChart BTC Volume Powered by BotBoys [v09/11/2018]Btc global volume by volumeChart team (BotBoys).
Takes volumes of all exchanges with BTC.
It includes Europe, EEUU, Asia and South-America.

DepthHouse BTC MO Backtest [Strategy]NOTE: Only works on BTC
All testing was done on 1hr Timeframe.
Past performance Is no guarantee of future results.
This is a experimental indicator - use at your own risk.
This is an experimental backtest strategy for the original DepthHouse BTC Momentum Oscillator
The idea of this is to aid traders in finding the best indicators settings to match their trading style.
---BTC MO SIgnals---
Signal Line: Generally, if the Signal Line is greater than 0, then there is more bullish momentum in the market
Tops & Bottoms: Signals used to help spot where BTC 0.96% momentum may have topped or bottomed out
Possible Divergences: Used to help spot possible reversals on continuous trends
---oh92's Preset Setting---
Scalper: (20,11,17,6) Very reactive settings that I use while day trading. However, faster settings generally increase the chance of false signals(20,11,17,6)
Swing Trader: (5,25,55,10) Greatly reduces noise for my longer time trades. Generally makes 'tops' and 'bottoms' more accurate. Which can be a huge advantsge in spoting an earnly trend reversal
Custom: Allows user adjustments of all settings
Displayed: (17,32,45,7)
Try this indicator for FREE! Just leave a comment, or feel free to send me a PM
Link to the original DepthHouse BTC Momentum Oscillator :

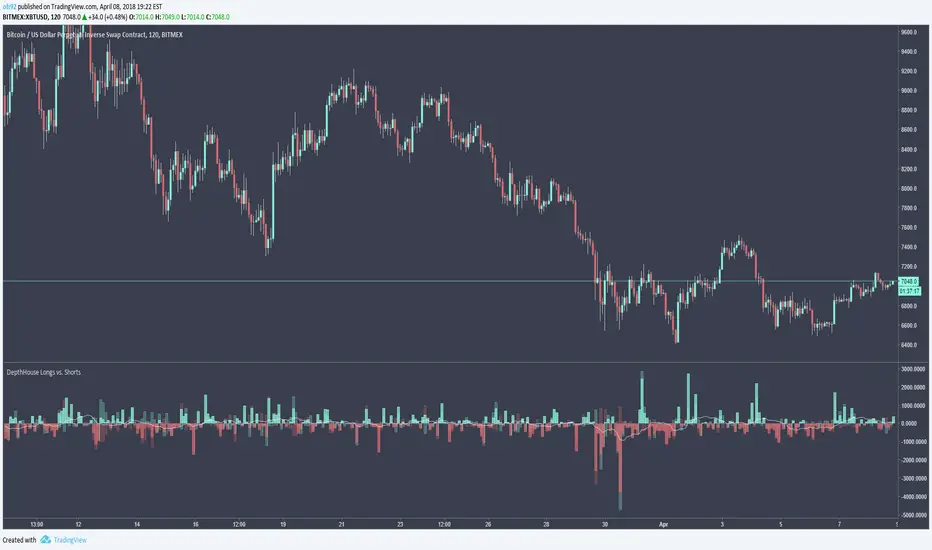
Bitfinex Longs vs. ShortsBitfinex Long vs. Short indicator takes the current bar value of Bitfinex longs and shorts and calculates the difference between the two.
The shadow bars shown behind the difference bars represent the actual amount of longs and shorts added or removed from the market.
This could be a tool used to help determine current market sentiment.
Note: the amount of shorts added/removed market is actually inverted to help get a better sense of possible market direction.
My original Bitfinex Longs vs. Shorts Indicator:
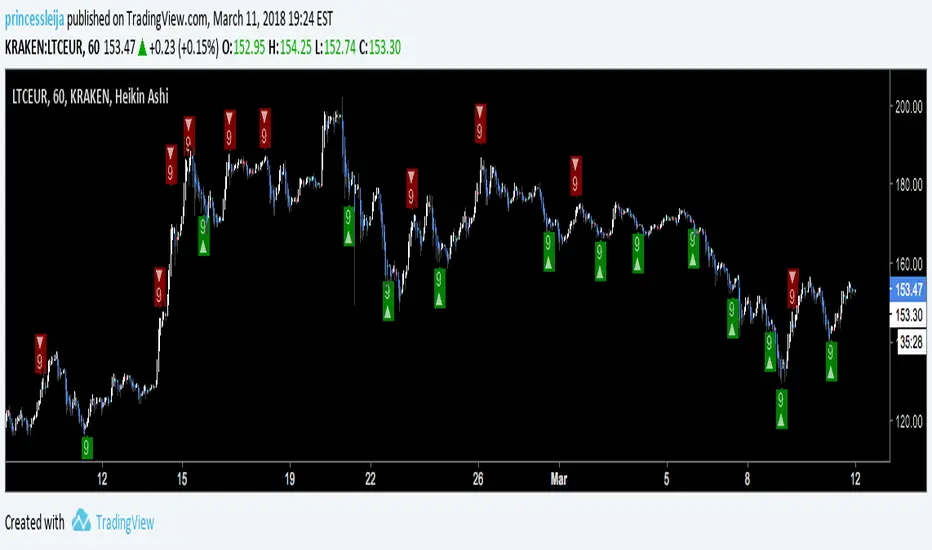
PRINCESSLEIJAS TDSSDue to several requests I'm going to give you temporary access to my TDSS script once again. In this version you can add the signals to your alerts (just right-click on a green/red signal and choose "Add Alert"). Please remember just to buy under a solid base and just use these signals as an indicator to catch highs/lows.
ALWAYS USE HEIKIN ASHI
May the force be with you,
-princessleija-