Horizontal Lines [White]The Horizontal Lines indicator is a simple yet powerful visual tool designed for traders in forex, options, and other financial markets. It allows users to mark and track key price levels directly on their chart with clear, bright yellow lines.
Wskaźniki rozpiętości rynku

Horizontal Lines [Yellow]The Horizontal Lines indicator is a simple yet powerful visual tool designed for traders in forex, options, and other financial markets. It allows users to mark and track key price levels directly on their chart with clear, bright yellow lines.

fartbombLinReg fit (history): solid line showing the best-fit linear trend over the last len bars.
Projected offset (visual): same line shifted h bars right so you can see direction.
Future projection (segments): the actual next-h forecast, drawn from the last bar.
Forecast made h bars ago: circle at each bar’s target showing what was predicted h bars earlier.
H / X markers: a hit if that earlier forecast fell inside the bar’s high–low range.

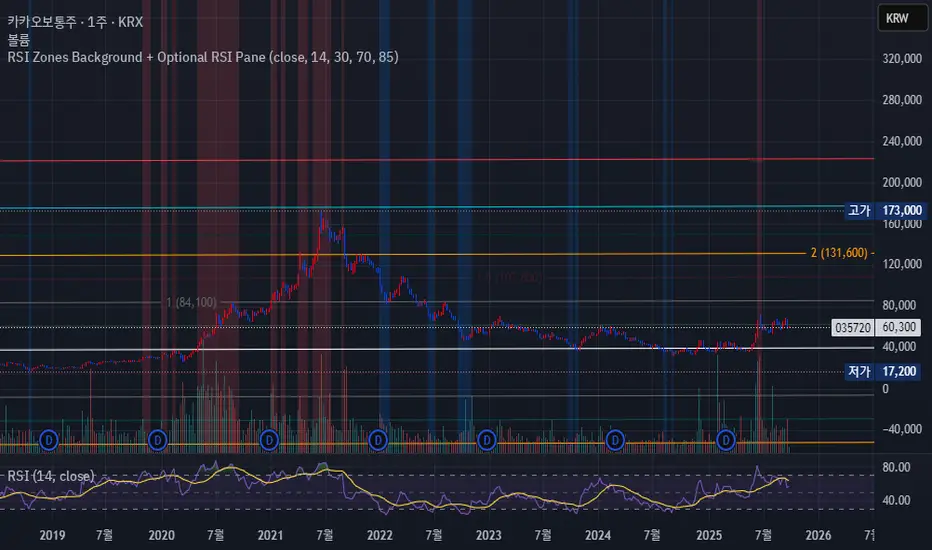
RSI Zones Background + Optional RSI PaneOverview
This Pine Script indicator does two things at once:
Colors the background of the main price chart whenever the RSI value is below a lower threshold (default 30) or above an upper threshold (default 70). This highlights oversold and overbought zones directly on the price chart itself.
Optionally displays a separate RSI panel with the RSI line and shaded region between the two threshold levels for reference.
The indicator is fully customizable through the settings panel—color choices, transparency, and whether to show the separate RSI pane can all be adjusted.
Key Parts of the Code
1. Inputs
src: The source price series for RSI calculation.
len: RSI lookback length (default 14).
lowerThr and upperThr: The lower and upper thresholds (defaults: 30 and 70).
lowColor and highColor: Colors for the background when RSI is below or above the thresholds.
bgTrans: Transparency level for the background shading.
showRSI: Boolean to toggle the optional RSI pane on or off.
2. RSI Calculation
rsi = ta.rsi(src, len)
This computes the RSI from the chosen price source.
3. Background Coloring on the Price Chart
bgCol = rsi <= lowerThr ? color.new(lowColor,bgTrans) :
rsi >= upperThr ? color.new(highColor,bgTrans) :
na
bgcolor(bgCol)
If RSI ≤ lower threshold: background turns lowColor (oversold zone).
If RSI ≥ upper threshold: background turns highColor (overbought zone).
Otherwise, no background color.
4. Optional RSI Pane
plot(showRSI ? rsi : na, display=display.pane)
Plots the RSI line in a separate pane when showRSI is true; otherwise hides it.
5. Horizontal Lines for Thresholds
hLower = hline(lowerThr, ...)
hUpper = hline(upperThr, ...)
Two horizontal lines at the lower and upper thresholds.
Because hline() can’t be wrapped inside if blocks, the script always creates them but makes them transparent (using na color) when the pane is hidden.
6. Filling Between Threshold Lines
fill(hLower, hUpper, color=showRSI ? color.new(color.gray,95) : na)
When the RSI pane is visible, the area between the two threshold lines is shaded in gray to create a “mid-zone” effect. This fill also switches off (becomes na) if the pane is hidden.
7. Alerts
The script also includes two alert conditions:
When RSI crosses below the lower threshold.
When RSI crosses above the upper threshold.
How It Works in Practice
On the price chart, you’ll see the background turn blue (or your chosen color) when RSI is ≤30, and red when RSI is ≥70.
If you enable “Show RSI” in the settings, a separate RSI pane will appear below the price chart, plotting the RSI line with two threshold lines and a shaded region in between.
You can fully adjust transparency and colors to suit your chart style.
Benefits
Quickly visualize overbought and oversold conditions without opening a separate RSI window.
Optional RSI pane provides context when needed.
Customizable colors and transparency make it easy to integrate with any chart theme.
Alerts give you automatic notifications when RSI crosses key levels.
------------------------------------------------------------------------------------------------------------------
개요
이 지표는 두 가지 기능을 동시에 수행합니다.
가격 차트 뒤 배경에 색상 표시
RSI 값이 설정한 하단 임계값(기본 30) 이하이거나 상단 임계값(기본 70) 이상일 때, 가격 차트 뒤쪽에 과매도·과매수 구간을 색으로 표시해줍니다.
선택적으로 RSI 보조창 표시
옵션을 켜면 별도의 RSI 패널이 나타나서 RSI 라인과 두 임계값(30, 70)을 연결한 구간을 음영 처리하여 보여줍니다.
설정 창에서 색상·투명도·보조창 표시 여부를 전부 조정할 수 있습니다.
코드 핵심 설명
1. 입력값
src: RSI 계산에 사용할 가격 소스(기본 종가).
len: RSI 기간(기본 14).
lowerThr / upperThr: RSI 하단·상단 임계값(기본 30, 70).
lowColor / highColor: RSI가 각각 하단 이하·상단 이상일 때 배경 색상.
bgTrans: 배경 투명도(0=불투명, 100=투명).
showRSI: RSI 보조창을 켜고 끌 수 있는 스위치.
2. RSI 계산
rsi = ta.rsi(src, len)
지정한 가격 소스를 기반으로 RSI를 계산합니다.
3. 가격 차트 배경 색칠
bgCol = rsi <= lowerThr ? color.new(lowColor,bgTrans) :
rsi >= upperThr ? color.new(highColor,bgTrans) :
na
bgcolor(bgCol)
RSI ≤ 하단 임계값 → lowColor(과매도 색)
RSI ≥ 상단 임계값 → highColor(과매수 색)
나머지 구간은 색상 없음.
4. 선택적 RSI 보조창
plot(showRSI ? rsi : na, display=display.pane)
showRSI가 켜져 있으면 RSI 라인을 보조창에 표시하고, 꺼져 있으면 숨깁니다.
5. 임계값 가로선
hLower = hline(lowerThr, ...)
hUpper = hline(upperThr, ...)
하단·상단 임계값을 가로선으로 표시합니다.
hline은 if 블록 안에서 쓸 수 없기 때문에 항상 그려지지만, 보조창이 꺼지면 색을 na로 처리해 안 보이게 합니다.
6. 임계값 사이 영역 음영 처리
fill(hLower, hUpper, color=showRSI ? color.new(color.gray,95) : na)
보조창이 켜져 있을 때만 두 가로선 사이를 회색으로 채워 “중립 구간”을 강조합니다.
7. 알림 조건
RSI가 하단 임계값을 아래로 돌파할 때 알림.
RSI가 상단 임계값을 위로 돌파할 때 알림.
실제 작동 모습
가격 차트 뒤쪽에 RSI ≤30이면 파란색, RSI ≥70이면 빨간색 배경이 나타납니다(색상은 설정에서 변경 가능).
RSI 보조창을 켜면, RSI 라인과 임계값 가로선, 그리고 그 사이 음영 영역이 함께 나타납니다.
투명도를 높이거나 낮추어 강조 정도를 조절할 수 있습니다.
장점
별도의 RSI창을 열지 않고도 가격 차트 배경만으로 과매수·과매도 상태를 직관적으로 확인 가능.
필요하면 보조창으로 RSI를 직접 확인하면서 임계값 가이드와 음영 영역을 함께 볼 수 있음.
색상·투명도를 자유롭게 조절할 수 있어 차트 스타일에 맞게 커스터마이징 가능.
RSI가 임계값을 돌파할 때 자동 알림을 받을 수 있음.
Alerte Croisement EMA9 & SMA12 (Zone remplie)📊 Moving Average 1
Period: 9 → The average is calculated over the last 9 candles (or time periods).
Shift: 0 → No shift; the average is aligned with the current data.
Method: Exponential → Uses an Exponential Moving Average (EMA), which gives more weight to recent data.
Apply to: Close → The average is based on the closing price of each candle.
📊 Moving Average 2
Period: 12 → Calculated over the last 12 periods.
Shift: 0 → No shift.
Method: Simple → Uses a Simple Moving Average (SMA), which gives equal weight to each period.
Apply to: Close → Based on closing prices.

Combined MOST + ATR MOST + ATR Combined indicator. This is published by interesting idea for my dad he tought that he combination of these two indicators gives a good result

Investorjordann - Script I have developed a script for the BTC pair. I'm currently trialing this...it is using multiple indicators and timeframes to trigger a trade. So far it seems very profitable across many timeframes, but I am still trailing.

OBV Cloud v1.0 [PriceBlance]🌐 English
OBV Cloud v1.0 – Free & Open-Source
OBV Cloud v1.0 integrates On-Balance Volume (OBV) with a Cloud model and enhanced trend filters.
It helps traders quickly identify:
Money Flow Trend: OBV Cloud acts as a dynamic support/resistance zone.
Trend Filters: EMA9 (short-term) and WMA45 (medium-term) directly applied on OBV.
OBV–Price Divergence: Detects both regular and hidden bullish/bearish divergences.
Trend Strength: Measured with ADX calculated on OBV.
OBV Cloud is suitable for both swing and day trading, allowing traders to spot breakouts, reversals, or sustained trends through volume-based analysis.

SCTI - D14SCTI - D14 Comprehensive Technical Analysis Suite
English Description
SCTI D14 is an advanced multi-component technical analysis indicator designed for professional traders and analysts. This comprehensive suite combines multiple analytical tools into a single, powerful indicator that provides deep market insights across various timeframes and methodologies.
Core Components:
1. EMA System (Exponential Moving Averages)
13 customizable EMA lines with periods ranging from 8 to 2584
Fibonacci-based periods (8, 13, 21, 34, 55, 89, 144, 233, 377, 610, 987, 1597, 2584)
Color-coded visualization for easy trend identification
Individual toggle controls for each EMA line
2. TFMA (Multi-Timeframe Moving Averages)
Cross-timeframe analysis with 3 independent EMA calculations
Real-time labels showing trend direction and price relationships
Customizable timeframes for each moving average
Percentage deviation display from current price
3. PMA (Precision Moving Average Cloud)
7-layer moving average system with customizable periods
Fill areas between moving averages for trend visualization
Support and resistance zone identification
Dynamic color-coded trend clouds
4. VWAP (Volume Weighted Average Price)
Multiple anchor points (Session, Week, Month, Quarter, Year, Earnings, Dividends, Splits)
Standard deviation bands for volatility analysis
Automatic session detection and anchoring
Statistical price level identification
5. Advanced Divergence Detector
12 technical indicators for divergence analysis (MACD, RSI, Stochastic, CCI, Williams %R, Bias, Momentum, OBV, VW-MACD, CMF, MFI, External)
Regular and hidden divergences detection
Bullish and bearish signals with visual confirmation
Customizable sensitivity and filtering options
Real-time alerts for divergence formations
6. Volume Profile & Node Analysis
Comprehensive volume distribution analysis
Point of Control (POC) identification
Value Area High/Low (VAH/VAL) calculations
Volume peaks and troughs detection
Support and resistance levels based on volume
7. Smart Money Concepts
Market structure analysis with Break of Structure (BOS) and Change of Character (CHoCH)
Internal and swing structure detection
Equal highs and lows identification
Fair Value Gaps (FVG) detection and visualization
Liquidity zones and institutional flow analysis
8. Trading Sessions
9 major trading sessions (Asia, Sydney, Tokyo, Shanghai, Hong Kong, Europe, London, New York, NYSE)
Real-time session status and countdown timers
Session volume and performance tracking
Customizable session boxes and labels
Statistical session analysis table
Key Features:
Modular Design: Enable/disable any component independently
Real-time Analysis: Live updates with market data
Multi-timeframe Support: Works across all chart timeframes
Customizable Alerts: Set alerts for any detected pattern or signal
Professional Visualization: Clean, organized display with customizable colors
Performance Optimized: Efficient code for smooth chart performance
Use Cases:
Trend Analysis: Identify market direction using multiple EMA systems
Entry/Exit Points: Use divergences and structure breaks for timing
Risk Management: Utilize volume profiles and session analysis for better positioning
Multi-timeframe Analysis: Confirm signals across different timeframes
Institutional Analysis: Track smart money flows and market structure
Perfect For:
Day traders seeking comprehensive market analysis
Swing traders needing multi-timeframe confirmation
Professional analysts requiring detailed market structure insights
Algorithmic traders looking for systematic signal generation
---
中文描述
SCTI - D14是一个先进的多组件技术分析指标,专为专业交易者和分析师设计。这个综合套件将多种分析工具整合到一个强大的指标中,在各种时间框架和方法论中提供深度市场洞察。
核心组件:
1. EMA系统(指数移动平均线)
13条可定制EMA线,周期从8到2584
基于斐波那契的周期(8, 13, 21, 34, 55, 89, 144, 233, 377, 610, 987, 1597, 2584)
颜色编码可视化,便于趋势识别
每条EMA线的独立切换控制
2. TFMA(多时间框架移动平均线)
跨时间框架分析,包含3个独立的EMA计算
实时标签显示趋势方向和价格关系
每个移动平均线的可定制时间框架
显示与当前价格的百分比偏差
3. PMA(精密移动平均云)
7层移动平均系统,周期可定制
移动平均线间填充区域用于趋势可视化
支撑阻力区域识别
动态颜色编码趋势云
4. VWAP(成交量加权平均价格)
多个锚点(交易时段、周、月、季、年、财报、分红、拆股)
标准差带用于波动性分析
自动时段检测和锚定
统计价格水平识别
5. 高级背离检测器
12个技术指标用于背离分析(MACD、RSI、随机指标、CCI、威廉姆斯%R、Bias、动量、OBV、VW-MACD、CMF、MFI、外部指标)
常规和隐藏背离检测
看涨看跌信号配视觉确认
可定制敏感度和过滤选项
背离形成的实时警报
6. 成交量分布与节点分析
全面的成交量分布分析
控制点(POC)识别
价值区域高/低点(VAH/VAL)计算
成交量峰值和低谷检测
基于成交量的支撑阻力水平
7. 聪明钱概念
市场结构分析,包括结构突破(BOS)和结构转变(CHoCH)
内部和摆动结构检测
等高等低识别
公允价值缺口(FVG)检测和可视化
流动性区域和机构资金流分析
8. 交易时区
9个主要交易时段(亚洲、悉尼、东京、上海、香港、欧洲、伦敦、纽约、纽交所)
实时时段状态和倒计时器
时段成交量和表现跟踪
可定制时段框和标签
统计时段分析表格
主要特性:
模块化设计:可独立启用/禁用任何组件
实时分析:随市场数据实时更新
多时间框架支持:适用于所有图表时间框架
可定制警报:为任何检测到的模式或信号设置警报
专业可视化:清洁、有序的显示界面,颜色可定制
性能优化:高效代码确保图表流畅运行
使用场景:
趋势分析:使用多重EMA系统识别市场方向
入场/出场点:利用背离和结构突破进行时机选择
风险管理:利用成交量分布和时段分析进行更好定位
多时间框架分析:在不同时间框架间确认信号
机构分析:跟踪聪明钱流向和市场结构
适用于:
寻求全面市场分析的日内交易者
需要多时间框架确认的摆动交易者
需要详细市场结构洞察的专业分析师
寻求系统化信号生成的算法交易者

Custom MACD (Normalized by ATR)This is a modified version of the classic MACD indicator.
Instead of using just the difference between EMA(12) and EMA(26), this version normalizes the MACD line by ATR(26) and scales it by 100:
* 100
This adjustment makes the MACD relative to market volatility, allowing for easier comparison across assets and timeframes.
The idea of normalizing MACD with ATR comes from Alex Spioglou, who suggested this improvement to enhance signal consistency in volatile markets.
Plots include the ATR-normalized MACD line, the signal line, and the histogram, with rising/falling color cues and built-in alert conditions.

XAUUSD CSI+RSI+Delta (15m)XAUUSD 15m
Candle Stability Index: 0.4
RSI Index: 80
Candle Delta Length: 6
Disable Repeating Signals: Enabled

RSI ROC Signals with Price Action# RSI ROC Signals with Price Action
## Overview
The RSI ROC (Rate of Change) Signals indicator is an advanced momentum-based trading system that combines RSI velocity analysis with price action confirmation to generate high-probability buy and sell signals. This indicator goes beyond traditional RSI analysis by measuring the speed of RSI changes and requiring price confirmation before triggering signals.
## Core Concept: RSI Rate of Change (ROC)
### What is RSI ROC?
RSI ROC measures the **velocity** or **acceleration** of the RSI indicator, providing insights into momentum shifts before they become apparent in traditional RSI readings.
**Formula**: `RSI ROC = ((Current RSI - Previous RSI) / Previous RSI) × 100`
### Why RSI ROC is Superior to Standard RSI:
1. **Early Momentum Detection**: Identifies momentum shifts before RSI reaches traditional overbought/oversold levels
2. **Velocity Analysis**: Measures the speed of momentum changes, not just absolute levels
3. **Reduced False Signals**: Filters out weak momentum moves that don't sustain
4. **Dynamic Thresholds**: Adapts to market volatility rather than using fixed RSI levels
5. **Leading Indicator**: Provides earlier signals compared to traditional RSI crossovers
## Signal Generation Logic
### 🟢 Buy Signal Process (3-Stage System):
#### Stage 1: Trigger Activation
- **RSI ROC** > threshold (default 7%) - RSI accelerating upward
- **Price ROC** > 0 - Price moving higher
- Records the **trigger high** (highest point during trigger)
#### Stage 2: Invalidation Check
- Signal invalidated if **RSI ROC** drops below negative threshold
- Prevents false signals during momentum reversals
#### Stage 3: Confirmation
- **Price breaks above trigger high** - Price action confirmation
- **Current candle is green** (close > open) - Bullish price action
- **State alternation** - Ensures no consecutive duplicate signals
### 🔴 Sell Signal Process (3-Stage System):
#### Stage 1: Trigger Activation
- **RSI ROC** < negative threshold (default -7%) - RSI accelerating downward
- **Price ROC** < 0 - Price moving lower
- Records the **trigger low** (lowest point during trigger)
#### Stage 2: Invalidation Check
- Signal invalidated if **RSI ROC** rises above positive threshold
- Prevents false signals during momentum reversals
#### Stage 3: Confirmation
- **Price breaks below trigger low** - Price action confirmation
- **Current candle is red** (close < open) - Bearish price action
- **State alternation** - Ensures no consecutive duplicate signals
## Key Features
### 🎯 **Smart Signal Management**
- **State Alternation**: Prevents signal clustering by alternating between buy/sell states
- **Trigger Invalidation**: Automatically cancels weak signals that lose momentum
- **Price Confirmation**: Requires actual price breakouts, not just momentum shifts
- **No Repainting**: Signals are confirmed and won't disappear or change
### ⚙️ **Customizable Parameters**
#### **RSI Length (Default: 14)**
- Standard RSI calculation period
- Shorter periods = more sensitive to price changes
- Longer periods = smoother, less noisy signals
#### **Lookback Period (Default: 1)**
- Period for ROC calculations
- 1 = compares to previous bar (most responsive)
- Higher values = smoother momentum detection
#### **RSI ROC Threshold (Default: 7%)**
- Minimum RSI velocity required for signal trigger
- Lower values = more signals, potentially more noise
- Higher values = fewer but higher-quality signals
### 📊 **Visual Signals**
- **Green Arrow Up**: Buy signal below price bar
- **Red Arrow Down**: Sell signal above price bar
- **Clean Chart**: No additional lines or oscillators cluttering the view
- **Size Options**: Customizable arrow sizes for visibility preferences
## Advantages Over Traditional Indicators
### vs. Standard RSI:
✅ **Earlier Signals**: Detects momentum changes before RSI reaches extremes
✅ **Dynamic Thresholds**: Adapts to market conditions vs. fixed 30/70 levels
✅ **Velocity Focus**: Measures momentum speed, not just position
✅ **Better Timing**: Combines momentum with price action confirmation
### vs. Moving Average Crossovers:
✅ **Leading vs. Lagging**: RSI ROC is forward-looking vs. backward-looking MAs
✅ **Volatility Adaptive**: Automatically adjusts to market volatility
✅ **Fewer Whipsaws**: Built-in invalidation logic reduces false signals
✅ **Momentum Focus**: Captures acceleration, not just direction changes
### vs. MACD:
✅ **Price-Normalized**: RSI ROC works consistently across different price ranges
✅ **Simpler Logic**: Clear trigger/confirmation process vs. complex crossovers
✅ **Built-in Filters**: Automatic signal quality control
✅ **State Management**: Prevents over-trading through alternation logic
## Trading Applications
### 📈 **Trend Following**
- Use in trending markets to catch momentum continuations
- Combine with trend filters for directional bias
- Excellent for breakout strategies
### 🔄 **Swing Trading**
- Ideal timeframes: 4H, Daily, Weekly
- Captures major momentum shifts
- Perfect for position entries/exits
### ⚡ **Scalping (Advanced Users)**
- Lower timeframes: 1m, 5m, 15m
- Reduce threshold for more frequent signals
- Combine with volume confirmation
### 🎯 **Momentum Strategies**
- Perfect for momentum-based trading systems
- Identifies acceleration phases in trends
- Complements breakout and continuation patterns
## Optimization Guidelines
### **Conservative Settings (Lower Risk)**
- RSI Length: 21
- ROC Threshold: 10%
- Lookback: 2
### **Standard Settings (Balanced)**
- RSI Length: 14 (default)
- ROC Threshold: 7% (default)
- Lookback: 1 (default)
### **Aggressive Settings (Higher Frequency)**
- RSI Length: 7
- ROC Threshold: 5%
- Lookback: 1
## Best Practices
### 🎯 **Entry Strategy**
1. Wait for signal arrow confirmation
2. Consider market context (trend, support/resistance)
3. Use proper position sizing based on volatility
4. Set stop-loss below/above trigger levels
### 🛡️ **Risk Management**
1. **Stop Loss**: Place beyond trigger high/low levels
2. **Position Sizing**: Use 1-2% risk per trade
3. **Market Context**: Avoid counter-trend signals in strong trends
4. **Time Filters**: Consider avoiding signals near major news events
### 📊 **Backtesting Recommendations**
1. Test on multiple timeframes and instruments
2. Analyze win rate vs. average win/loss ratio
3. Consider transaction costs in backtesting
4. Optimize threshold values for different market conditions
## Technical Specifications
- **Pine Script Version**: v6
- **Signal Type**: Non-repainting, confirmed signals
- **Calculation Basis**: RSI velocity with price action confirmation
- **Update Frequency**: Real-time on bar close
- **Memory Management**: Efficient state tracking with minimal resource usage
## Ideal For:
- **Momentum Traders**: Captures acceleration phases
- **Swing Traders**: Medium-term position entries/exits
- **Breakout Traders**: Confirms momentum behind breakouts
- **System Traders**: Mechanical signal generation with clear rules
This indicator represents a significant evolution in momentum analysis, combining the reliability of RSI with the precision of rate-of-change analysis and the confirmation of price action. It's designed for traders who want sophisticated momentum detection with built-in quality controls.

Bullish_1Hour_entry_Indicator with Alertsthis indicator consioders entry basis of EMAs convergence , VWAP & Multitime frame analysis

Ch Enhanced Buy Sell Volume// ========================================
// 📊 HOW TO READ THIS INDICATOR 📊
// ========================================
//
// 🟢 GREEN BARS (Above Zero) = BUY VOLUME
// 🔴 RED BARS (Below Zero) = SELL VOLUME
//
// 💡 BAR COLORS MEANING:
// • DARK GREEN = Strong buyer dominance (high conviction buying)
// • LIGHT GREEN = Weak buyer dominance (low conviction)
// • DARK RED = Strong seller dominance (high conviction selling)
// • LIGHT RED = Weak seller dominance (low conviction)
//
// 🎯 TRADING SIGNALS:
// • Tall dark green bars = Strong bullish momentum
// • Tall dark red bars = Strong bearish momentum
// • Light colored bars = Weak conviction, potential reversal
// • Green bars > Red bars = Buyers winning
// • Red bars > Green bars = Sellers winning
//
// 📈 BULLISH SIGNALS:
// • Buy% > 70% = Strong buying interest
// • Dark green bars with high delta = Professional buying
// • Buy volume above yellow MA line = Above average buying
//
// 📉 BEARISH SIGNALS:
// • Sell% > 70% = Strong selling pressure
// • Dark red bars with high delta = Professional selling
// • Sell volume below yellow MA line = Above average selling
//
// ⚠️ WARNING SIGNALS:
// • Price up + Red dominance = Bearish divergence
// • Price down + Green dominance = Bullish divergence
// • Low delta (<10%) = Market indecision
//
// 📊 INFO TABLE (Top-Right):
// • Buy%: Percentage of volume that was buying
// • Sell%: Percentage of volume that was selling
// • Delta%: Strength of dominance (difference between buy/sell)
// • Dom: Which side is currently dominant (BUYERS/SELLERS)
//
// 🟡 YELLOW LINES = Volume Moving Average
// • Upper line: Reference for buy volume (green bars)
// • Lower line: Reference for sell volume (red bars)
// • Above yellow = Higher than average volume
// • Below yellow = Lower than average volume

NOK Basket (Equal-Weighted)Measures the Norwegian crown's relative value to a basket of other currencies: EUR, USD, GBP, SEK AND DKK.

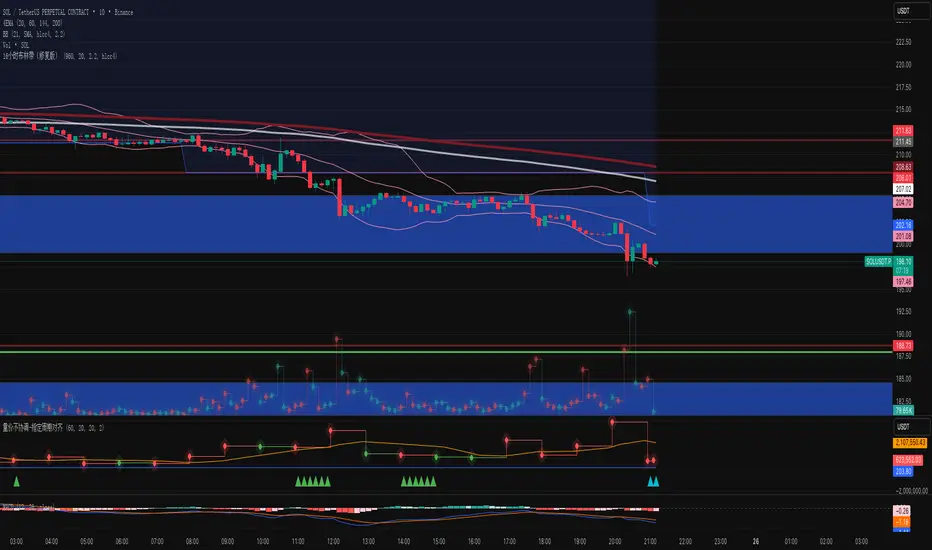
Long-short energy ratio /多空能量比值This indicator calculates the relative strength of bulls and bears by measuring the average candle body movement within a user-defined window (default: 50 bars).
Bull Energy = average percentage change of all bullish candles in the lookback period
Bear Energy = average percentage change of all bearish candles in the lookback period
Energy Ratio = Bull Energy ÷ Bear Energy
The ratio is plotted as a curve around the baseline of 1:
Ratio > 1 → Bull side shows stronger momentum
Ratio < 1 → Bear side shows stronger momentum
Ratio ≈ 1 → Balanced market conditions
This tool helps visualize short-term shifts in buying and selling pressure, offering a simple mean-reversion perspective or a confirmation of trend strength depending on the context.

EMA & HMA with ShadingA simple indicator you can use to shade the area between an EMA and HMA for easier visualization. Hope you find it useful in your trading.

Volume-Price Divergence Indicator V3Description:
This indicator helps you identify volume-price divergences and potential trend weakness across any specified timeframe.
Features:
Volume bars with moving average – green for bullish, red for bearish, with orange SMA to detect low-volume situations.
Custom OBV calculation with divergence detection – highlights when price makes new highs/lows but OBV does not.
VWAP deviation alerts – signals when price moves far from VWAP while volume remains low, indicating potential fake breakouts.
Fully configurable – select any reference timeframe, adjust volume MA, OBV period, and VWAP deviation threshold.
Visual markers – easily spot bullish/bearish divergences and volume-price mismatches directly on your chart.
Use case:
Spot early trend exhaustion points.
Identify fake breakouts or weak rallies/drops.
Combine with your existing trading strategy for more informed entries and exits.
Volume-Price Divergence Indicator V2Description:
This indicator helps you identify volume-price divergences and potential trend weakness across any specified timeframe.
Features:
Volume bars with moving average – green for bullish, red for bearish, with orange SMA to detect low-volume situations.
Custom OBV calculation with divergence detection – highlights when price makes new highs/lows but OBV does not.
VWAP deviation alerts – signals when price moves far from VWAP while volume remains low, indicating potential fake breakouts.
Fully configurable – select any reference timeframe, adjust volume MA, OBV period, and VWAP deviation threshold.
Visual markers – easily spot bullish/bearish divergences and volume-price mismatches directly on your chart.
Use case:
Spot early trend exhaustion points.
Identify fake breakouts or weak rallies/drops.
Combine with your existing trading strategy for more informed entries and exits.
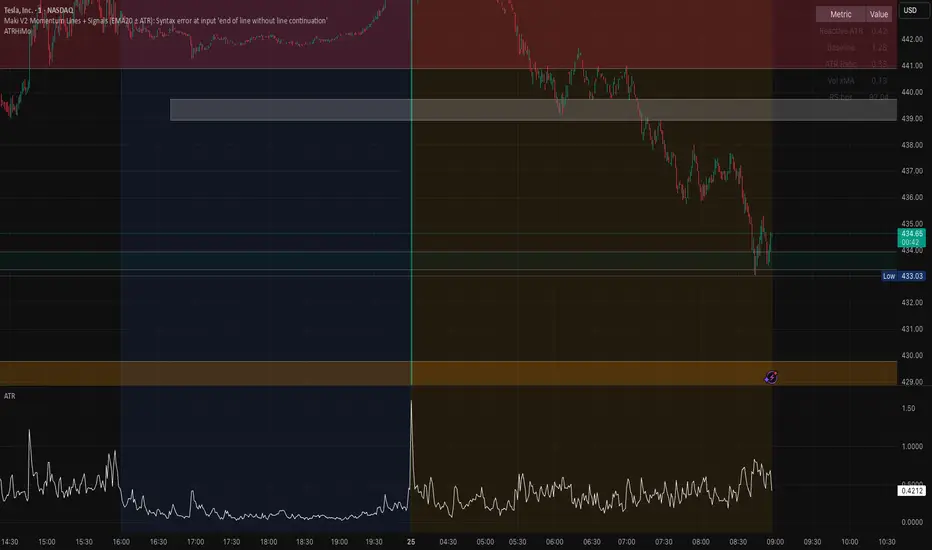
Opening ATR + High Momentum (10/30/60)this is a custom momentum indicator using atr
A fixed, compiling Pine v5 script is below with the three issues corrected: no plots in local scope, a ≤10-character shorttitle, and cleaned ternaries/formatting that remove the “end of line without line continuation” error.
MACD COM PONTOS//@version=5
indicator(title="MACD COM PONTOS", shorttitle="MACD COM PONTOS")
//Plot Inputs
res = input.timeframe("", "Indicator TimeFrame")
fast_length = input.int(title="Fast Length", defval=12)
slow_length = input.int(title="Slow Length", defval=26)
src = input.source(title="Source", defval=close)
signal_length = input.int(title="Signal Smoothing", minval = 1, maxval = 999, defval = 9)
sma_source = input.string(title="Oscillator MA Type", defval="EMA", options= )
sma_signal = input.string(title="Signal Line MA Type", defval="EMA", options= )
// Show Plots T/F
show_macd = input.bool(true, title="Show MACD Lines", group="Show Plots?", inline="SP10")
show_macd_LW = input.int(3, minval=0, maxval=5, title = "MACD Width", group="Show Plots?", inline="SP11")
show_signal_LW= input.int(2, minval=0, maxval=5, title = "Signal Width", group="Show Plots?", inline="SP11")
show_Hist = input.bool(true, title="Show Histogram", group="Show Plots?", inline="SP20")
show_hist_LW = input.int(5, minval=0, maxval=5, title = "-- Width", group="Show Plots?", inline="SP20")
show_trend = input.bool(true, title = "Show MACD Lines w/ Trend Color", group="Show Plots?", inline="SP30")
show_HB = input.bool(false, title="Show Highlight Price Bars", group="Show Plots?", inline="SP40")
show_cross = input.bool(false, title = "Show BackGround on Cross", group="Show Plots?", inline="SP50")
show_dots = input.bool(true, title = "Show Circle on Cross", group="Show Plots?", inline="SP60")
show_dots_LW = input.int(5, minval=0, maxval=5, title = "-- Width", group="Show Plots?", inline="SP60")
//show_trend = input(true, title = "Colors MACD Lines w/ Trend Color", group="Show Plots?", inline="SP5")
// MACD Lines colors
col_macd = input.color(#FF6D00, "MACD Line ", group="Color Settings", inline="CS1")
col_signal = input.color(#2962FF, "Signal Line ", group="Color Settings", inline="CS1")
col_trnd_Up = input.color(#4BAF4F, "Trend Up ", group="Color Settings", inline="CS2")
col_trnd_Dn = input.color(#B71D1C, "Trend Down ", group="Color Settings", inline="CS2")
// Histogram Colors
col_grow_above = input.color(#26A69A, "Above Grow", group="Histogram Colors", inline="Hist10")
col_fall_above = input.color(#B2DFDB, "Fall", group="Histogram Colors", inline="Hist10")
col_grow_below = input.color(#FF5252, "Below Grow", group="Histogram Colors",inline="Hist20")
col_fall_below = input.color(#FFCDD2, "Fall", group="Histogram Colors", inline="Hist20")
// Alerts T/F Inputs
alert_Long = input.bool(true, title = "MACD Cross Up", group = "Alerts", inline="Alert10")
alert_Short = input.bool(true, title = "MACD Cross Dn", group = "Alerts", inline="Alert10")
alert_Long_A = input.bool(false, title = "MACD Cross Up & > 0", group = "Alerts", inline="Alert20")
alert_Short_B = input.bool(false, title = "MACD Cross Dn & < 0", group = "Alerts", inline="Alert20")
// Calculating
fast_ma = request.security(syminfo.tickerid, res, sma_source == "SMA" ? ta.sma(src, fast_length) : ta.ema(src, fast_length))
slow_ma = request.security(syminfo.tickerid, res, sma_source == "SMA" ? ta.sma(src, slow_length) : ta.ema(src, slow_length))
macd = fast_ma - slow_ma
signal = request.security(syminfo.tickerid, res, sma_signal == "SMA" ? ta.sma(macd, signal_length) : ta.ema(macd, signal_length))
hist = macd - signal
// MACD Trend and Cross Up/Down conditions
trend_up = macd > signal
trend_dn = macd < signal
cross_UP = signal >= macd and signal < macd
cross_DN = signal <= macd and signal > macd
cross_UP_A = (signal >= macd and signal < macd) and macd > 0
cross_DN_B = (signal <= macd and signal > macd) and macd < 0
// Condition that changes Color of MACD Line if Show Trend is turned on..
trend_col = show_trend and trend_up ? col_trnd_Up : trend_up ? col_macd : show_trend and trend_dn ? col_trnd_Dn: trend_dn ? col_macd : na
//Var Statements for Histogram Color Change
var bool histA_IsUp = false
var bool histA_IsDown = false
var bool histB_IsDown = false
var bool histB_IsUp = false
histA_IsUp := hist == hist ? histA_IsUp : hist > hist and hist > 0
histA_IsDown := hist == hist ? histA_IsDown : hist < hist and hist > 0
histB_IsDown := hist == hist ? histB_IsDown : hist < hist and hist <= 0
histB_IsUp := hist == hist ? histB_IsUp : hist > hist and hist <= 0
hist_col = histA_IsUp ? col_grow_above : histA_IsDown ? col_fall_above : histB_IsDown ? col_grow_below : histB_IsUp ? col_fall_below :color.silver
// Plot Statements
//Background Color
bgcolor(show_cross and cross_UP ? col_trnd_Up : na, editable=false)
bgcolor(show_cross and cross_DN ? col_trnd_Dn : na, editable=false)
//Highlight Price Bars
barcolor(show_HB and trend_up ? col_trnd_Up : na, title="Trend Up", offset = 0, editable=false)
barcolor(show_HB and trend_dn ? col_trnd_Dn : na, title="Trend Dn", offset = 0, editable=false)
//Regular Plots
plot(show_Hist and hist ? hist : na, title="Histogram", style=plot.style_columns, color=color.new(hist_col ,0),linewidth=show_hist_LW)
plot(show_macd and signal ? signal : na, title="Signal", color=color.new(col_signal, 0), style=plot.style_line ,linewidth=show_signal_LW)
plot(show_macd and macd ? macd : na, title="MACD", color=color.new(trend_col, 0), style=plot.style_line ,linewidth=show_macd_LW)
hline(0, title="0 Line", color=color.new(color.gray, 0), linestyle=hline.style_dashed, linewidth=1, editable=false)
plot(show_dots and cross_UP ? macd : na, title="Dots", color=color.new(trend_col ,0), style=plot.style_circles, linewidth=show_dots_LW, editable=false)
plot(show_dots and cross_DN ? macd : na, title="Dots", color=color.new(trend_col ,0), style=plot.style_circles, linewidth=show_dots_LW, editable=false)
//Alerts
if alert_Long and cross_UP
alert("Symbol = (" + syminfo.tickerid + ") TimeFrame = (" + timeframe.period + ") Current Price (" + str.tostring(close) + ") MACD Crosses Up.", alert.freq_once_per_bar_close)
if alert_Short and cross_DN
alert("Symbol = (" + syminfo.tickerid + ") TimeFrame = (" + timeframe.period + ") Current Price (" + str.tostring(close) + ") MACD Crosses Down.", alert.freq_once_per_bar_close)
//Alerts - Stricter Condition - Only Alerts When MACD Crosses UP & MACD > 0 -- Crosses Down & MACD < 0
if alert_Long_A and cross_UP_A
alert("Symbol = (" + syminfo.tickerid + ") TimeFrame = (" + timeframe.period + ") Current Price (" + str.tostring(close) + ") MACD > 0 And Crosses Up.", alert.freq_once_per_bar_close)
if alert_Short_B and cross_DN_B
alert("Symbol = (" + syminfo.tickerid + ") TimeFrame = (" + timeframe.period + ") Current Price (" + str.tostring(close) + ") MACD < 0 And Crosses Down.", alert.freq_once_per_bar_close)
//End Code
