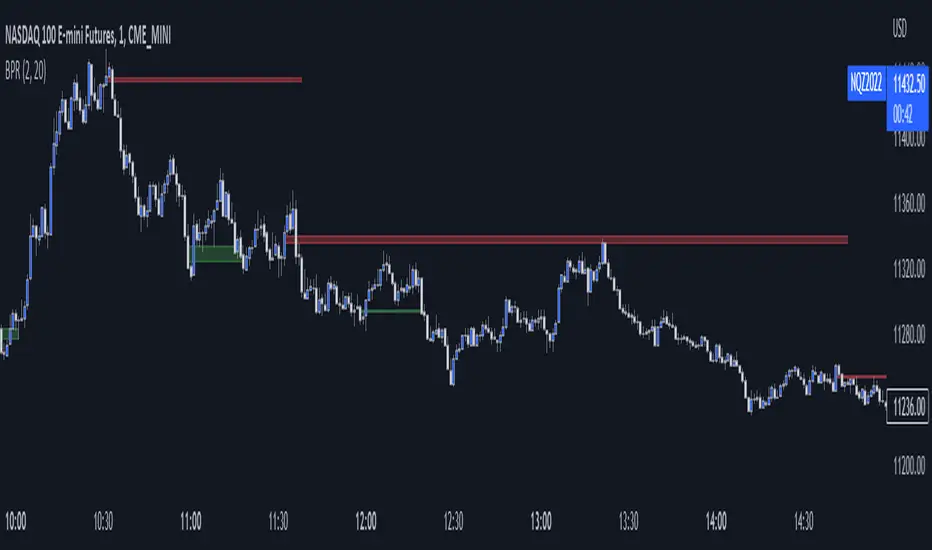
HTF Balanced Price RangeThis script is based off of TradeForOpp's BPR indicator, but I adapted it to work on higher timeframes
Bpr

BPR [Gold Group]✨ BPR Indicator – Gold Group
The BPR (Breakout–Pullback–Reversal) Indicator by Gold Group is a premium, research-based market tool designed to help traders identify high-probability trading opportunities with precision. Built on advanced price-action logic and institutional behavior analysis, this indicator highlights key market zones where smart-money activity is most likely to occur—allowing traders to enter the market with confidence and clarity.
🔍 What the BPR Indicator Does
Detects Breakout Zones where liquidity is taken and momentum shifts begin.
Marks Pullback Levels where the market retests institutional footprints.
Identifies Reversal Points with high accuracy for powerful entries.
Filters out market noise, showing only meaningful structure changes.
Works on all timeframes and all major assets such as Gold, Forex, NAS100, US30, Crypto.
🔥 Why This Indicator Is Important
Helps traders understand institutional price movement, not retail traps.
Reduces emotional decision-making by giving crystal-clear levels.
Increases trade accuracy by aligning entries with market structure shifts.
Saves time by automatically plotting areas where smart money reacts.
🎯 Why You Should Use It
Perfect for both beginners and professionals.
Suitable for scalping, intraday, and swing trading.
Developed and tested by Gold Group Research Team with proven performance.
Allows traders to stay ahead of manipulative moves and avoid fake breakouts

Balanced Price Range | Flux Charts💎 GENERAL OVERVIEW
Introducing our new Balanced Price Range (BPR) indicator! A Balanced Price Range is a trading concept used by price action traders. It is detected by finding overlapping area between two contrary Fair Value Gaps (FVGs). These areas can be used as entry points during market pullbacks. For more information about the process, please check the "HOW DOES IT WORK ?" section.
Balanced Price Range Features :
Balanced Price Range Detection : Identifies areas where bullish and bearish FVGs overlap, suggesting a zone of price equilibrium.
Customizable FVG & BPR Detection : You can fine-tune FVG detection and sensitivity for BPR detection to your liking.
Retest Labels : Bullish & Bearish retest labels will be rendered for BPRs.
Alerts : You can set alerts for Bullish & Bearish BPR detection and their retests.
🚩 UNIQUENESS
This indicator doesn't just detect standard FVGs but specifically looks for areas where bullish and bearish IFVGs (Invalidated Fair Value Gaps) overlap, defining a Balanced Price Range. It also actively manages and updates identified BPR zones, removing them when they are invalidated or remain untouched for a specified period. It highlights and alerts users to retests of established BPR zones, signaling potential trading opportunities. Users can tailor the appearance of the BPR zones and retest markers, as well as configure specific alerts for new BPR formations and retests.
📌 HOW DOES IT WORK ?
A Fair Value Gap generally occur when there is an imbalance in the market. They can be detected by specific formations within the chart. The indicator first detects bullish & bearish FVG zones according to their formations on chart. Then, they are dynamically tracked and flagged as invalidated if the price crosses them, turning them into IFVGs. When a FVG & IFVG of the same type overlaps, the indicator combines them into a single BPR of corresponding type. The detected BPR is updated as new data comes in, and renders retests labels as they occur. A bullish BPR can be used to find long trade entry opportunities, while a bearish BPR can be used to find short trade entry opportunities. Retests can also indicate potential movements in the corresponding direction of the BPR. Users can set-up alerts for BPR detection & BPR retests and will get notified as they occur.
⚙️ SETTINGS
Show Historic Zones: If enabled, invalidated or expired BPR zones will remain visible on the chart.
Balanced Price Range:
FVG Detection Method: Determines the criteria for the bar types forming the initial FVG.
Same: All three bars forming the FVG must be of the same type (all bullish or all bearish).
Mixed: The bar types must vary (a mix of bullish and bearish bars).
All: Bar types can vary or be the same.
FVG Invalidation Method: Determines which part of the candle (wick or close) invalidates the initial FVG.
BPR Invalidation Method: Determines which part of the candle (wick or close) invalidates the Balanced Price Range.
Sensitivity: Adjusts the sensitivity of FVG detection. Higher values may identify fewer, larger BPRs, while lower values may detect more, smaller BPRs.
Labels: Toggles the display of text labels on the identified zones.
Retests: Enables or disables the detection and visualization of BPR retests.

iFVG (BPR)
This indicator detects Fair Value Gaps (FVGs) and Inversion Zones (iFVGs) based concept from the ICT methodology.
An iFVG forms when a bullish and a bearish FVG overlap, creating a double imbalance zone. These are high-reaction points often targeted by smart money.
🔷 What It Detects
Bullish FVG: When the high of Candle 1 is lower than the low of Candle 3
Bearish FVG: When the low of Candle 1 is higher than the high of Candle 3
iFVG (or BPR): When a bullish and bearish FVG overlap, forming a double imbalance zone
🔷Mitigation Logic
An FVG or BPR becomes an iFVG when price closes against its original bias Once this happens, the zone is reclassified as a potential support or resistance (iFVG)
If price later mitigates the iFVG, all visual elements are automatically removed to keep the chart clean
🔷Visual Output
Standard FVGs: Customizable lines between Candle 1 and Candle 3
iFVGs (mitigated BPRs): Adjustable and highlighted rectangles to show the full zone
Mitigation Type: FVG or iFVG zones disappear when 50% of the zone is reached
🔷Custom Settings
Show Last Zones: Set how many recent zones to display on the chart (max 100)
Mitigation Type: Based on the percentage of zone coverage
Color & Style: Customize the appearance of FVG and iFVG zones
🔷 Use Case
This indicator is designed for real-time institutional analysis, helping traders identify:
Recent imbalances (FVGs)
Confluence zones (iFVGs = BPRs)
High-reaction points in the market
Ideal when combined with market structure, liquidity levels, and Kill Zones
Best used in combination with market structure, liquidity zones, and Kill Zone timing .

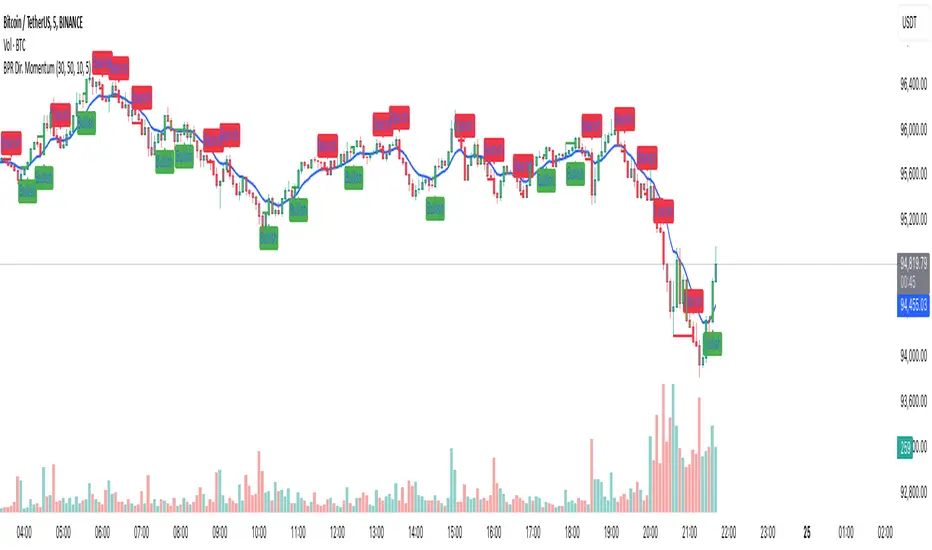
Balance Price Range (BPR) IndicatorOverview
The BPR with Directional Momentum-Filtered Breakouts indicator is designed to identify Balanced Price Ranges (BPR) and d etect high-probability breakouts and breakdowns with directional momentum confirmation . By leveraging historical BPR structures, EMA-based momentum filtering , and a trade cooldown mechanism , this script provides a structured approach to identifying potential trading opportunities while reducing false signals.
This invite-only indicator is ideal for traders who seek precise breakout confirmation, reduced noise, and trend-following logic while maintaining flexibility through adjustable parameters.
How It Works
The script follows a multi-step breakout detection process by integrating multiple key technical components:
1. Balanced Price Range (BPR) Detection:
• A Balanced Candle is identified when the price remains within a specific percentage of its range midpoint.
• These BPR zones represent areas of equilibrium , where a breakout or breakdown is likely to occur.
• The script historically tracks BPR levels across the entire chart to monitor price action around key areas.
2. Momentum-Filtered Breakout & Breakdown Logic:
• Bullish Breakout: Occurs when the price breaks above the historical BPR high with bullish momentum.
• Bearish Breakdown: Occurs when the price breaks below the historical BPR low with bearish momentum.
• Momentum Confirmation: Each breakout requires a strong directional move, measured against the Exponential Moving Average (EMA) .
• Only confirmed breakouts are marked, reducing the likelihood of false signals in choppy markets.
3. Candle-Based Background Visualization:
• Grey Background: Represents a Balanced Price Range (BPR), indicating potential breakout zones.
• Green Background: Indicates a Bullish Breakout when the price successfully breaks and holds above the BPR high.
• Red Background: Indicates a Bearish Breakdown when the price drops below the BPR low.
4. Trade Cooldown Mechanism:
• Prevents consecutive signals from triggering too frequently.
• Default cooldown period: 5 bars (adjustable).
• Ensures that trades are not clustered, improving signal quality.
5. EMA for Trend Direction & Confirmation:
• A 20-period EMA (default, adjustable) is used to confirm trade direction.
• Breakouts above the EMA align with uptrend continuation.
• Breakdowns below the EMA align with downtrend momentum.
Key Features
✔️ Historical BPR Detection – Tracks past BPR levels across the entire chart for structured breakout zones.
✔️ Momentum-Based Breakouts – Ensures breakouts are confirmed by directional price movement before generating signals.
✔️ Candle-Based Background Logic – Subtle candle highlights rather than full background fills, for better chart clarity.
✔️ Trade Cooldown Period – Prevents consecutive buy/sell signals within a defined period, improving signal efficiency.
✔️ Dynamic EMA Confirmation – Ensures trades align with the overall trend, reducing counter-trend trades.
✔️ Customizable Inputs – Adjust breakout thresholds, EMA length, and cooldown periods as per trading style.
✔️ Works Across Multiple Timeframes – Can be applied to intraday, swing, and positional trading strategies.
How to Use
1. Look for Balanced Price Ranges ( BPR )
• These zones highlight equilibrium areas where price is likely to break out.
• Grey-shaded candles indicate potential breakout zones.
2. Monitor for Bullish or Bearish Breakouts
• A green candle background signals a bullish breakout above BPR.
• A red candle background signals a bearish breakdown below BPR.
• The EMA filter helps confirm whether the breakout aligns with the prevailing trend.
3. Follow the Cooldown Logic
• After a breakout signal, wait for the cooldown period before another trade is allowed.
• This helps filter out noisy price action and prevents excessive trading.
4. Use Alongside Other Indicators
• Works well with volume analysis, support/resistance levels, and price action strategies.
• Can be combined with other momentum indicators for further trade confirmation.
Why This Combination?
Unlike generic breakout indicators, this script uniquely combines:
• BPR historical structures for defining potential breakout zones.
• Momentum-based breakout filtering using EMA confirmation.
• Trade cooldown logic to avoid excessive trading signals.
• Subtle candle-based highlights instead of cluttered full-background fills.
This structured approach makes the indicator more robust, adaptive, and reliable in different market conditions.
Why It’s Worth Using?
🔹 Avoid False Breakouts: Built-in momentum confirmation prevents weak or fake breakouts.
🔹 Clean Visualization: No excessive overlays—just precise, meaningful background coloring for breakouts.
🔹 Works in Any Market: Use on stocks, crypto, forex, indices, and commodities across different timeframes.
🔹 User-Friendly & Customizable: Fine-tune parameters to match individual trading styles.
⚠️ Note: This is an Invite-Only script. Access is granted to selected users.
✅ If you find it useful, consider incorporating it into your trend-following & breakout trading strategies.
🚀 Optimize your trading with structured breakout detection! 🚀
FVG Reversal Sentinel🔵 FVG Reversal Sentinel – Multi-Timeframe Fair Value Gap Indicator
The FVG Reversal Sentinel is a powerful TradingView indicator designed to help traders identify and track Fair Value Gaps (FVGs) across multiple timeframes, all within a single chart.
This tool allows you to select up to five separate timeframes, ensuring you never miss key market shifts, whether you are scalping, day trading, or swing trading. You can use this indicator in any asset (Cryptos, Futures, Indices, Forex Pairs, etc.).
🔵 - Key Features -
Multi-Timeframe FVG Tracking – Select and display up to five different timeframes on one chart, providing a comprehensive view of market structure.
Customizable Colors – Adjust bullish and bearish FVG colors to match your chart theme for a seamless trading experience.
Enhanced Market Context – Quickly identify key liquidity zones and refine your entries and exits with precision.
Hide the lower timeframes FVGs to get a clear view in a custom timeframe.
Show or hide mitigated FVGs to declutter the chart.
FVGs boxes are going to be displayed only when the candle bar closes
FVGs are going to be mitigated only when the body of the candle closes above or below the FVG area.
No repainting
Whether you're looking to fine-tune your entries or gain a broader market perspective, the FVG Reversal Sentinel indicator ensures you have the tools to stay ahead of price action and capitalize on market inefficiencies.
🔵 - Customization-
You can change the indicator settings as you see fit to achieve the best results for your use case.
TIMEFRAMES
This indicator provides the ability to select up to 5 timeframes. These timeframes are based on the trader's timeframes including any custom timeframes.
Select the desired timeframe from the options list.
Add the label text you would like to show for the selected timeframe.
Check or uncheck the box to display or hide the timeframe from your chart.
FVG SETTINGS
Length of boxes: allows you to select the length of the box that is going to be displayed for the FVGs.
Delete boxes after fill?: allows you to show or hide mitigated FVGs on your chart.
Hide FVGs lower than enabled timeframes?: allows you to show or hide lower timeframe FVGs on your chart. Example - You are in a 15 minutes timeframe chart, if you choose to hide lower timeframe FVGs you will not be able to see 5 minutes FVG defined in your Timeframes Settings, only 15 minutes or higher timeframe FVGs will be displayed on your chart.
BOX VISUALS
Bullish FVG box color: the color and opacity of the box for the bullish FVGs.
Bearish FVG box color: the color and opacity of the box for the bearish FVGs.
LABELS VISUALS
Bullish FVG labels color: the color for bullish labels.
Bearish FVG labels color: the color for bearish labels.
Labels size: the size of the text displayed in the labels.
Labels position: the position of the label inside the FVGs boxes (right, left or center).
BORDER VISUALS
Border width: the width of the border (the thickness).
Bullish FVG border color: the color and the opacity of the bullish box border.
Bearish FVG border color: the color and the opacity of the bearish box border.
🔵 - How to use the indicator -
Just add the indicator in your chart and click in the settings option to customize it.
Make sure you select the desired timeframes and set the colors and opacity for the FVGs boxes.
This indicator can be used in many trading strategies, such as:
SILVER BULLET
iFVG
iFVG RETEST
These strategies are based on the use of FVGs, this tool can help you analyze the market and make the right decision.
🔵 - How was the indicator designed? -
I have spent a lot of time testing other open source indicators from the community. All of these indicators do a great job, but they have a problem, they not only mitigate FVGs when a candle closes above or below the FVG, they also mitigate FVGs when the candle closes exactly to the tick (not above or below the FVG). This is a problem for many strategies that rely on FVGs mitigation.
What makes this indicator different is that it focuses on just mitigating imbalances at the right time for these strategies.
I have taken ideas and some pieces of code from many community indicator developers, such as:
@twingall
@tflab
@marktools
@nacho-fx
@pmk07
... and many other people, to whom I thank for their valuable work and have allowed me to create this tool by making modifications to their source code.
🔵 - Disclaimer -
This tool is intended solely for informational and educational purposes and should not be regarded as financial, investment, or trading advice. It's not designed to predict market movements or offer specific recommendations. Users should be aware that past performance is not indicative of future results and should not rely on any indicator for financial decisions.

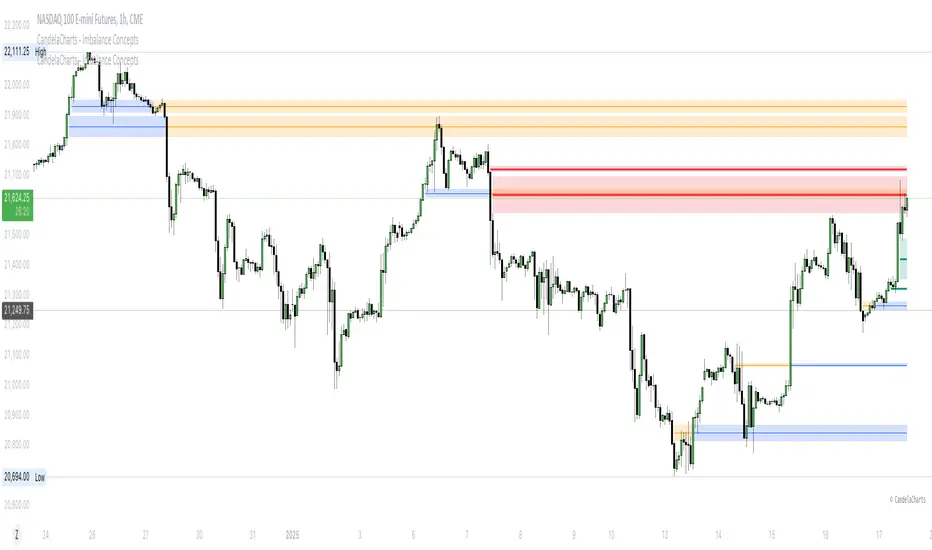
CandelaCharts - Imbalance Concepts 📝 Overview
Imbalance Concepts is an advanced toolkit rooted in ICT (Inner Circle Trader) principles, specifically designed to identify and highlight critical areas of support and resistance within financial markets. This toolkit focuses on detecting market imbalances that can indicate potential turning points or high-probability zones for price action.
The key components of the toolkit include:
Fair Value Gaps (FVG)
Inversion Fair Value Gaps (IFVG)
Balanced Price Range (BPR)
Volume Imbalances (VI)
Opening Gaps (OG)
The toolkit automatically detects these imbalances and visually marks them on charts, allowing traders to quickly identify key zones for analysis. This enables more informed decision-making, as these imbalances often signal the potential for major market shifts, reversals, or continuation patterns.
By integrating Imbalance Concepts, traders can focus on critical price areas that have a high likelihood of influencing future price action.
📦 Features
The Imbalance Concepts toolkit provides a robust set of features aimed at improving trading accuracy and decision-making. Key features include:
MTF
Mitigation
Consequent Encroachment
Threshold
Hide Overlap
Advanced Styling
⚙️ Settings
Show: Controls whether Imbalances are displayed on the chart.
Show Last: Sets the number of Imbalances you want to display.
Length: Determines the length of each Imbalance.
Mitigation: Highlights when an Imbalance has been touched, using a different color without marking it as invalid.
Timeframe: Specifies the timeframe used to detect Imbalances.
Threshold: Sets the minimum gap size required for Imbalance detection on the chart.
Show Mid-Line: Configures the midpoint line's width and style within the Imbalance. (Consequent Encroachment - CE)
Show Border: Defines the border width and line style of the Imbalance.
Hide Overlap: Removes overlapping Imbalances from view.
Extend: Extends the Imbalance length to the current candle.
Elongate: Fully extend the Imbalance length to the right side of the chart.
⚡️ Showcase
Fair Value Gaps (FVG)
Inversion Fair Value Gaps (IFVG)
Balanced Price Range (BPR)
Volume Imbalances (VI)
Opening Gaps (OG)
📒 Usage
The key components of trading imbalances include:
Step 1 – Identify Market Trend: Begin by determining the market trend for the asset, whether it is bullish or bearish.
Step 2 – Locate Premium and Discount Zones: In a bearish market, focus on identifying the premium Imbalance, while in a bullish market, look for the discount Imbalance.
Step 3 – Detect Liquidity Sweep: After identifying the trend, the next step is to spot a liquidity sweep, which often indicates a potential price reversal or continuation.
Step 4 – Detect Change In State of Delivery: Following the liquidity sweep, the next step is to recognize a CISD, which frequently serves as a confirmation of a potential price reversal.
Step 5 – Execute the Trade: In a bullish market, wait for the price to retrace and test the discount imbalance, aiming to balance the price movement before entering the trade.
NOTES:
You always short only on Premium, and long on Discount.
Fair Value Gaps (FVG)
Inversion Fair Value Gaps
Balanced Price Range
🚨 Alerts
The indicator provides the ability to set alerts for various significant market events related to its core features.
You can configure alerts for the following key events:
Fair Value Gaps Formation (+B/-B)
Inversion Fair Value Gaps Formation (+B/-B)
Balanced Price Range Formation (+B/-B)
Volume Imbalances Formation (+B/-B)
Opening Gaps Formation (+B/-B)
⚠️ Disclaimer
These tools are exclusively available on the TradingView platform.
Our charting tools are intended solely for informational and educational purposes and should not be regarded as financial, investment, or trading advice. They are not designed to predict market movements or offer specific recommendations. Users should be aware that past performance is not indicative of future results and should not rely on these tools for financial decisions. By using these charting tools, the purchaser agrees that the seller and creator hold no responsibility for any decisions made based on information provided by the tools. The purchaser assumes full responsibility and liability for any actions taken and their consequences, including potential financial losses or investment outcomes that may result from the use of these products.
By purchasing, the customer acknowledges and accepts that neither the seller nor the creator is liable for any undesired outcomes stemming from the development, sale, or use of these products. Additionally, the purchaser agrees to indemnify the seller from any liability. If invited through the Friends and Family Program, the purchaser understands that any provided discount code applies only to the initial purchase of Candela's subscription. The purchaser is responsible for canceling or requesting cancellation of their subscription if they choose not to continue at the full retail price. In the event the purchaser no longer wishes to use the products, they must unsubscribe from the membership service, if applicable.
We do not offer reimbursements, refunds, or chargebacks. Once these Terms are accepted at the time of purchase, no reimbursements, refunds, or chargebacks will be issued under any circumstances.
By continuing to use these charting tools, the user confirms their understanding and acceptance of these Terms as outlined in this disclaimer.
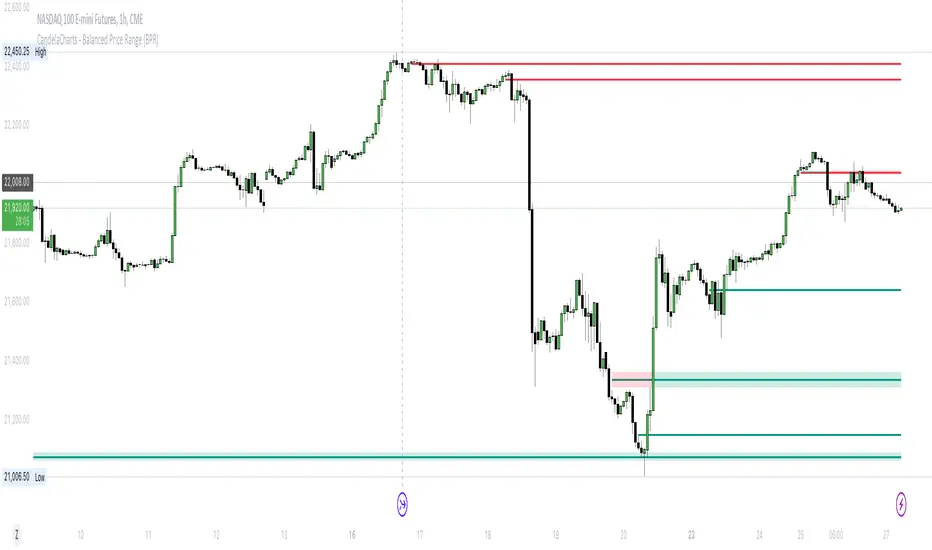
CandelaCharts - Balanced Price Range (BPR) 📝 Overview
ICT Balanced Price Range (BPR) is the area on the price chart where two opposite Fair Value Gaps overlap.
To identify a Balanced Price Range (BPR), mark a fair value gap (FVG) on the sell side of the price and another on the buy side. These FVGs should be directly opposite each other horizontally. The overlapping area between the two is the Balanced Price Range.
The significance of the ICT Balanced Price Range lies in its sensitivity to price movements. When the market approaches a BPR, it often triggers a rapid and notable price reaction.
This reaction occurs because the two opposing FVGs attract the attention of smart money traders—those with substantial capital capable of influencing market trends. As a key concept in the Inner Circle Trader (ICT) methodology, the BPR serves as an ideal entry point, frequently driving considerable market activity.
📦 Features
MTF
Mitigation
Consequent Encroachment (CE)
Threshold
Hide Overlap
Advanced Styling
⚙️ Settings
Show: Controls whether BPRs are displayed on the chart.
Show Last: Sets the number of BPRs you want to display.
Length: Determines the length of each BPR.
Mitigation: Highlights when an BPR has been touched, using a different color without marking it as invalid.
Timeframe: Specifies the timeframe used to detect BPRs.
Threshold: Sets the minimum gap size required for BPR detection on the chart.
Show Mid-Line: Configures the midpoint line's width and style within the BPR. (Consequent Encroachment - CE)
Show Border: Defines the border width and line style of the BPR.
Hide Overlap: Removes overlapping BPRs from view.
Extend: Extends the BPR length to the current candle.
Elongate: Fully extends the BPR length to the right side of the chart.
⚡️ Showcase
Simple
Mitigated
Bordered
Consequent Encroachment
Extended
🚨 Alerts
This script offers alert options for all signal types.
Bearish Signal
A bearish signal is generated when the price re-enters a bearish inversion zone and then reverses downward.
Bullish Signal
A bullish signal is generated when the price revisits a bullish inversion zone and then breaks upward through the top.
⚠️ Disclaimer
Trading involves significant risk, and many participants may incur losses. The content on this site is not intended as financial advice and should not be interpreted as such. Decisions to buy, sell, hold, or trade securities, commodities, or other financial instruments carry inherent risks and are best made with guidance from qualified financial professionals. Past performance is not indicative of future results.
ICT Balanced Price Range [TradingFinder] BPR | FVG + IFVG🔵 Introduction
The ICT Balanced Price Range (BPR) indicator is a valuable tool that helps traders identify key areas on price charts where a balance between buyers and sellers is established. These zones can serve as critical points for potential price reversals or continuations.
🟣 Bullish Balanced Price Range
A Bullish BPR forms when a buying pressure zone (Bullish FVG) overlaps with a Bullish Inversion FVG. This overlap indicates a high probability of price moving upwards, making it a crucial area for traders to consider.
🟣 Bearish Balanced Price Range
Similarly, a Bearish BPR is created when a selling pressure zone (Bearish FVG) overlaps with a Bearish Inversion FVG. This zone is often seen as a key area where the price is likely to move downward.
🔵 How to Use
🟣 Identifying the Balanced Price Range (BPR)
To identify the Balanced Price Range (BPR), you must first locate two Fair Value Gaps (FVGs) on the price chart. One FVG should be on the sell side, and the other on the buy side. When these two FVGs horizontally oppose each other, the area where they overlap is recognized as the Balanced Price Range (BPR).
This BPR zone is highly sensitive to price movements due to the combination of two FVGs, often leading to strong market reactions. As the price approaches this area, the likelihood of a significant market move increases, making it a prime target for professional traders.
🟣 Bullish Balanced Price Range (Bullish BPR)
To effectively trade using a Bullish BPR, begin by identifying a bullish market structure and searching for bullish Price Delivery Arrays (PD Arrays). Once the market structure shifts to bullish in a lower time frame, locate a Bullish FVG within the Discount Zone that overlaps with a Bearish FVG.
Mark this overlapping zone and wait for the price to test it before executing a buy trade. Alternatively, you can set a Buy Limit order with a stop loss below the recent swing low and target profits based on higher time frame liquidity draws.
🟣 Bearish Balanced Price Range (Bearish BPR)
For bearish trades, start by identifying a bearish market structure and look for bearish PD Arrays. After the market structure shifts to bearish in a lower time frame, identify a Bearish FVG within the Discount Zone that overlaps with a Bullish FVG. Mark this overlapping zone and execute a sell trade when the price tests it.
You can also use a Sell Limit order with a stop loss above the recent swing high and target profits according to higher time frame liquidity draws.
🔵 Settings
🟣 Global Settings
Show All Inversion FVG & IFVG : If disabled, only the most recent FVG & IFVG will be displayed.
FVG & IFVG Validity Period (Bar) : Determines the maximum duration (in number of candles) that the FVG and IFVG remain valid.
Switching Colors Theme Mode : Includes three modes: "Off", "Light", and "Dark". "Light" mode adjusts colors for light mode use, "Dark" mode adjusts colors for dark mode use, and "Off" disables color adjustments.
🟣 Display Settings
Show Bullish BPR : Toggles the display of demand-related boxes.
Show Bearish BPR : Toggles the display of supply-related boxes.
Mitigation Level BPR : Options include "Proximal", "Distal", or "50 % OB" modes, which you can choose based on your needs. The "50 % OB" line is the midpoint between distal and proximal.
Show Bullish IFVG : Toggles the display of demand-related boxes.
Show Bearish IFV G: Toggles the display of supply-related boxes.
Mitigation Level FVG and IFVG : Options include "Proximal", "Distal", or "50 % OB" modes, which you can choose based on your needs. The "50 % OB" line is the midpoint between distal and proximal.
🟣 Logic Settings
FVG Filter : This refines the number of identified FVG areas based on a specified algorithm to focus on higher quality signals and reduce noise.
Types of FVG filters :
Very Aggressive Filter : Adds a condition where, for an upward FVG, the last candle's highest price must exceed the middle candle's highest price, and for a downward FVG, the last candle's lowest price must be lower than the middle candle's lowest price. This minimally filters out FVGs.
Aggressive Filter : Builds on the Very Aggressive mode by ensuring the middle candle is not too small, filtering out more FVGs.
Defensive Filter : Adds criteria regarding the size and structure of the middle candle, requiring it to have a substantial body and specific polarity conditions, filtering out a significant number of FVGs.
Very Defensive Filte r: Further refines filtering by ensuring the first and third candles are not small-bodied doji candles, retaining only the highest quality signals.
🟣 Alert Settings
Alert Inversion FVG Mitigation : Enables alerts for Inversion FVG mitigation.
Message Frequency : Determines the frequency of alerts. Options include 'All' (every function call), 'Once Per Bar' (first call within the bar), and 'Once Per Bar Close' (final script execution of the real-time bar). Default is 'Once per Bar'.
Show Alert Time by Time Zone : Configures the time zone for alert messages. Default is 'UTC'.
Display More Info : Provides additional details in alert messages, including price range, date, hour, and minute. Set to 'Off' to exclude this information.
🔵 Conclusion
The ICT Balanced Price Range is a powerful and reliable tool for identifying key points on price charts. This strategy can be applied across various time frames and serves as a complementary tool alongside other indicators and technical analysis methods.
The most crucial aspect of utilizing this strategy effectively is correctly identifying FVGs and their overlapping areas, which comes with practice and experience.

Order Block Overlapping Drawing [TradingFinder]🔵 Introduction
Technical analysis is a fundamental tool in financial markets, helping traders identify key areas on price charts to make informed trading decisions. The ICT (Inner Circle Trader) style, developed by Michael Huddleston, is one of the most advanced methods in this field.
It enables traders to precisely identify and exploit critical zones such as Order Blocks, Breaker Blocks, Fair Value Gaps (FVGs), and Inversion Fair Value Gaps (IFVGs).
To streamline and simplify the use of these key areas, a library has been developed in Pine Script, the scripting language for the TradingView platform. This library allows you to automatically detect overlapping zones between Order Blocks and other similar areas, and visually display them on your chart.
This tool is particularly useful for creating indicators like Balanced Price Range (BPR) and ICT Unicorn Model.
🔵 How to Use
This section explains how to use the Pine Script library. This library assists you in easily identifying and analyzing overlapping areas between Order Blocks and other zones, such as Breaker Blocks and Fair Value Gaps.
To add "Order Block Overlapping Drawing", you must first add the following code to your script.
import TFlab/OrderBlockOverlappingDrawing/1
🟣 Inputs
The library includes the "OBOverlappingDrawing" function, which you can use to detect and display overlapping zones. This function identifies and draws overlapping zones based on the Order Block type, trigger conditions, previous and current prices, and other relevant parameters.
🟣 Parameters
OBOverlappingDrawing(OBType , TriggerConditionOrigin, distalPrice_Pre, proximalPrice_Pre , distalPrice_Curr, proximalPrice_Curr, Index_Curr , OBValidGlobal, OBValidDis, MitigationLvL, ShowAll, Show, ColorZone) =>
OBType (string)
TriggerConditionOrigin (bool)
distalPrice_Pre (float)
proximalPrice_Pre (float)
distalPrice_Curr (float)
proximalPrice_Curr (float)
Index_Curr (int)
OBValidGlobal (bool)
OBValidDis (int)
MitigationLvL (string)
ShowAll (bool)
Show (bool)
ColorZone (color)
In this example, various parameters are defined to detect overlapping zones and draw them on the chart. Based on these settings, the overlapping areas will be automatically drawn on the chart.
OBType : All order blocks are summarized into two types: "Supply" and "Demand." You should input your Current order block type in this parameter. Enter "Demand" for drawing demand zones and "Supply" for drawing supply zones.
TriggerConditionOrigin : Input the condition under which you want the Current order block to be drawn in this parameter.
distalPrice_Pre : Generally, if each zone is formed by two lines, the farthest line from the price is termed Pervious "Distal." This input receives the price of the "Distal" line.
proximalPrice_Pre : Generally, if each zone is formed by two lines, the nearest line to the price is termed Previous "Proximal" line.
distalPrice_Curr : Generally, if each zone is formed by two lines, the farthest line from the price is termed Current "Distal." This input receives the price of the "Distal" line.
proximalPrice_Curr : Generally, if each zone is formed by two lines, the nearest line to the price is termed Current "Proximal" line.
Index_Curr : This input receives the value of the "bar_index" at the beginning of the order block. You should store the "bar_index" value at the occurrence of the condition for the Current order block to be drawn and input it here.
OBValidGlobal : This parameter is a boolean in which you can enter the condition that you want to execute to stop drawing the block order. If you do not have a special condition, you should set it to True.
OBValidDis : Order blocks continue to be drawn until a new order block is drawn or the order block is "Mitigate." You can specify how many candles after their initiation order blocks should continue. If you want no limitation, enter the number 4998.
MitigationLvL : This parameter is a string. Its inputs are one of "Proximal", "Distal" or "50 % OB" modes, which you can enter according to your needs. The "50 % OB" line is the middle line between distal and proximal.
ShowAll : This is a boolean parameter, if it is "true" the entire order of blocks will be displayed, and if it is "false" only the last block order will be displayed.
Show : You may need to manage whether to display or hide order blocks. When this input is "On", order blocks are displayed, and when it's "Off", order blocks are not displayed.
ColorZone : You can input your preferred color for drawing order blocks.
🟣 Output
Mitigation Alerts : This library allows you to leverage Mitigation Alerts to detect specific conditions that could lead to trend reversals. These alerts help you react promptly in your trades, ensuring better management of market shifts.
🔵 Conclusion
The Pine Script library provided is a powerful tool for technical analysis, especially in the ICT style. It enables you to detect overlapping zones between Order Blocks and other significant areas like Breaker Blocks and Fair Value Gaps, improving your trading strategies. By utilizing this tool, you can perform more precise analysis and manage risks effectively in your trades.

Automatic Closest FVG with BPRFair Value Gaps are a hugely popular concept and because of that there are numerous indicators available. This one however, was designed to automate the process of actually using them in trading.
Designed with lower time frame entries in mind (though will work on HTF just as well), this indicator automatically draws the closest, non-mitigated FVG, to the current price, cutting out the work of looking for what FVG is relevant.
The indicator also has an option to show when the current nearest pair of FVGs form a BPR or 'balanced price range'.
There are various option for what counts as mitigation, including no mitigation at all, and when mitigated an FVG is no longer considered for proximity searching.

Balanced Price Range (BPR)This script finds BPR's, which some simply refer to as a "double Fair Value Gap" (FVG). In a BPR, there is an overlapping vertical area between a recent bullish and bearish FVG. You may tune the parameters to filter out smaller FVG's or BPR's, as well as how far back the indicator must look to find a matching pair.