Bayesian Trend Navigator [QuantAlgo]🟢 Overview
The Bayesian Trend Navigator uses Bayesian statistics to continuously update trend probabilities by combining long-term expectations (prior beliefs) and short-term observations (likelihood evidence), rather than relying solely on recent price data like many conventional indicators. This mathematical framework produces robust directional signals that naturally balance responsiveness with stability, making it suitable for traders and investors seeking statistically-grounded trend identification across diverse market environments and asset types.
🟢 How It Works
The indicator operates on Bayesian inference principles, a statistical method for updating beliefs when new evidence emerges. The system begins by establishing a prior belief - a long-term trend expectation calculated from historical price behavior. This represents the "baseline hypothesis" about market direction before considering recent developments.
Simultaneously, the algorithm collects recent market evidence through short-term trend analysis, representing the likelihood component. This captures what current price action suggests about directional momentum independent of historical context.
The core Bayesian engine then combines these elements using conjugate normal distributions and precision weighting. It calculates prior precision (inverse variance) and likelihood precision, combining them to determine a posterior precision. The resulting posterior mean represents the mathematically optimal trend estimate given both historical patterns and current reality. This posterior calculation includes intervals derived from the posterior variance, providing probabilistic confidence bounds around the trend estimate.
Finally, volatility-based standard deviation bands create adaptive boundaries around the Bayesian estimate. The trend line adjusts within these constraints, generating color transitions between bullish (green) and bearish (red) states when the posterior calculation crosses these probabilistic thresholds.
🟢 How to Use
Green/Bullish Trend Line: Posterior probability favoring upward momentum, indicating statistically favorable conditions for long positions (buy)
Red/Bearish Trend Line: Posterior probability favoring downward momentum, signaling mathematically supported timing for short positions (sell)
Rising Green Line: Strengthening bullish posterior as new evidence reinforces upward beliefs, showing increasing probabilistic confidence in trend continuation with favorable long entry conditions
Declining Red Line: Intensifying bearish posterior with accumulating downside evidence, indicating growing statistical certainty in downtrend persistence and optimal short positioning opportunities
Flattening Trends: Diminishing posterior confidence regardless of color suggests equilibrium between prior beliefs and contradictory evidence, potentially signaling consolidation or insufficient statistical clarity for high-conviction trades
🟢 Pro Tips for Trading and Investing
→ Preset Configuration Strategy: Deploy presets based on your trading horizon - Scalping preset maximizes evidence weight (0.8) for rapid Bayesian updates on 1-15 minute charts, Default preset balances prior and likelihood for general applications, while Swing Trading preset equalizes weights (0.5/0.5) for stable inference on hourly and daily timeframes.
→ Prior Weight Adjustment: Calibrate prior weight according to market regime - increase values (0.5-0.7) in stable trending markets where historical patterns remain predictive, decrease values (0.2-0.3) during regime changes or news-driven volatility when recent evidence should dominate the posterior calculation.
→ Evidence Period Tuning: Modify the evidence period based on information flow velocity. Use shorter periods (5-8 bars) for assets with continuous price discovery like cryptocurrencies, medium periods (10-15) for liquid stocks, and longer periods (15-20) for slower-moving markets to ensure adequate likelihood sample size.
→ Likelihood Weight Optimization: Adjust likelihood weight inversely to market noise levels. Higher values (0.7-0.8) work well in clean trending conditions where recent data is reliable, while lower values (0.4-0.6) help during choppy periods by maintaining stronger reliance on established prior beliefs.
→ Multi-Timeframe Bayesian Confluence: Apply the indicator across multiple timeframes, using higher timeframes (Daily/Weekly) to establish prior belief direction and lower timeframes (Hourly/15-minute) for likelihood-driven entry timing, ensuring posterior probabilities align across temporal scales for maximum statistical confidence.
→ Standard Deviation Multiplier Management: Adapt the multiplier to match current uncertainty levels. Use tighter multipliers (1.0-1.5) during low-volatility consolidations to capture early trend emergence, and wider multipliers (2.0-2.5) during high-volatility events to avoid premature signals caused by statistical noise rather than genuine posterior shifts.
→ Variance-Based Position Sizing: Monitor the implicit posterior variance through trend line stability - smooth consistent movements indicate low uncertainty warranting larger positions, while erratic fluctuations suggest high statistical uncertainty calling for reduced exposure until clearer probabilistic convergence emerges.
→ Alert-Based Probabilistic Execution: Utilize trend change alerts to capture every statistically significant posterior shift from bullish to bearish states or vice versa without constantly monitoring the charts.
Bayesian

Market Participation Index [PhenLabs]📊 Market Participation Index
Version: PineScript™ v6
📌 Description
Market Participation Index is a well-evolved statistical oscillator that constantly learns to develop by adapting to changing market behavior through the intricate mathematical modeling process. MPI combines different statistical approaches and Bayes’ probability theory of analysis to provide extensive insight into market participation and building momentum. MPI combines diverse statistical thinking principles of physics and information and marries them for subtle changes to occur in markets, levels to become influential as important price targets, and pattern divergences to unveil before it is visible by analytical methods in an old-fashioned methodology.
🚀 Points of Innovation:
Automatic market condition detection system with intelligent preset selection
Multi-statistical approach combining classical and advanced metrics
Fractal-based divergence system with quality scoring
Adaptive threshold calculation using statistical properties of current market
🚨 Important🚨
The ‘Auto’ mode intelligently selects the optimal preset based on real-time market conditions, if the visualization does not appear to the best of your liking then select the option in parenthesis next to the auto mode on the label in the oscillator in the settings panel.
🔧 Core Components
Statistical Foundation: Multiple statistical measures combined with weighted approach
Market Condition Analysis: Real-time detection of market states (trending, ranging, volatile)
Change Point Detection: Bayesian analysis for finding significant market structure shifts
Divergence System: Fractal-based pattern detection with quality assessment
Adaptive Visualization: Dynamic color schemes with context-appropriate settings
🔥 Key Features
The indicator provides comprehensive market analysis through:
Multi-statistical Oscillator: Combines Z-score, MAD, and fractal dimensions
Advanced Statistical Components: Includes skewness, kurtosis, and entropy analysis
Auto-preset System: Automatically selects optimal settings for current conditions
Fractal Divergence Analysis: Detects and grades quality of divergence patterns
Adaptive Thresholds: Dynamically adjusts overbought/oversold levels
🎨 Visualization
Color-coded Oscillator: Gradient-filled oscillator line showing intensity
Divergence Markings: Clear visualization of bullish and bearish divergences
Threshold Lines: Dynamic or fixed overbought/oversold levels
Preset Information: On-chart display of current market conditions
Multiple Color Schemes: Modern, Classic, Monochrome, and Neon themes
Classic
Modern
Monochrome
Neon
📖 Usage Guidelines
The indicator offers several customization options:
Market Condition Settings:
Preset Mode: Choose between Auto-detection or specific market condition presets
Color Theme: Select visual theme matching your chart style
Divergence Labels: Choose whether or not you’d like to see the divergence
✅ Best Use Cases:
Identify potential market reversals through statistical divergences
Detect changes in market structure before price confirmation
Filter trades based on current market condition (trending vs. ranging)
Find optimal entry and exit points using adaptive thresholds
Monitor shifts in market participation and momentum
⚠️ Limitations
Requires sufficient historical data for accurate statistical analysis
Auto-detection may lag during rapid market condition changes
Advanced statistical calculations have higher computational requirements
Manual preset selection may be required in certain transitional markets
💡 What Makes This Unique
Statistical Depth: Goes beyond traditional indicators with advanced statistical measures
Adaptive Intelligence: Automatically adjusts to current market conditions
Bayesian Analysis: Identifies statistically significant change points in market structure
Multi-factor Approach: Combines multiple statistical dimensions for confirmation
Fractal Divergence System: More robust than traditional divergence detection methods
🔬 How It Works
The indicator processes market data through four main components:
Market Condition Analysis:
Evaluates trend strength, volatility, and price patterns
Automatically selects optimal preset parameters
Adapts sensitivity based on current conditions
Statistical Oscillator:
Combines multiple statistical measures with weights
Normalizes values to consistent scale
Applies adaptive smoothing
Advanced Statistical Analysis:
Calculates higher-order statistical moments
Applies information-theoretic measures
Detects distribution anomalies
Divergence Detection:
Uses fractal theory to identify pivot points
Detects and scores divergence quality
Filters signals based on current market phase
💡 Note:
The Market Participation Index performs optimally when used across multiple timeframes for confirmation. Its statistical foundation makes it particularly valuable during market transitions and periods of changing volatility, where traditional indicators often fail to provide clear signals.

Bayesian TrendEnglish Description (primary)
1. Overview
This script implements a Naive Bayesian classifier to estimate the probability of an upcoming bullish, bearish, or neutral move. It combines multiple indicators—RSI, MACD histogram, EMA price difference in ATR units, ATR level vs. its average, and Volume vs. its average—to calculate likelihoods for each market direction. Each indicator is “binned” (categorized into discrete zones) and assigned conditional probabilities for bullish/bearish/neutral scenarios. The script then normalizes these probabilities and paints bars in green if bullish is most likely, red if bearish is most likely, or blue if neutral is most likely. A small table is also displayed in the top-right corner of the chart, showing real-time probabilities.
2. How it works
Indicator Calculations: The script calculates RSI, MACD (line and histogram), EMA, ATR, and Volume metrics.
Binning: Each metric is converted into a discrete category (e.g., low, medium, high). For example, RSI < 30 is binned as “low,” while RSI > 70 is binned as “high.”
Conditional Probabilities: User-defined tables specify the conditional probabilities of each bin under three hypotheses (Up, Down, Neutral).
Naive Bayesian Formula: The script multiplies the relevant conditional probabilities, normalizes them, and derives the final probabilities (Up, Down, or Neutral).
Visualization:
Bar Colors: Bars are green when the Up probability exceeds 50%, red for Down, and blue otherwise.
Table: Displays numeric probabilities of Up, Down, and Neutral in percentage terms.
3. How to use it
Add the script to your chart.
Observe the colored bars:
Green suggests a higher probability for bullish movement.
Red suggests a higher probability for bearish movement.
Blue indicates a higher probability of sideways or uncertain conditions.
Check the table in the top-right corner to see exact probabilities (Up/Down/Neutral).
Use the input settings to adjust thresholds (RSI, MACD, Volume, etc.), define alert conditions (e.g., when Up probability crosses 50%), and decide whether to trigger alerts on bar close or in real-time.
4. Originality and usefulness
Originality: This script uniquely applies a Naive Bayesian approach to a blend of classic and volume-based indicators. It demonstrates how different indicator “zones” can be combined to produce probabilistic insights.
Usefulness: Traders can interpret the probability breakdown to gauge the script’s bias. Unlike single indicators, this approach synthesizes several signals, potentially offering a more holistic perspective on market conditions.
5. Limitations
The conditional probabilities are manually assigned and may not reflect actual market behavior across all instruments or timeframes.
Results depend on the user’s choice of thresholds and indicator settings.
Like any indicator, past performance does not guarantee future results. Always confirm signals with additional analysis.
6. Disclaimer
This script is intended for educational and informational purposes only. It does not constitute financial advice. Trading involves significant risk, and you should make decisions based on your own analysis. Neither the script’s author nor TradingView is liable for any financial losses.
Русское описание (Russian translation, optional)
Этот индикатор реализует наивный Байесовский классификатор для оценки вероятности предстоящего роста (Up), падения (Down) или бокового движения (Neutral). Он комбинирует несколько индикаторов—RSI, гистограмму MACD, разницу цены и EMA в единицах ATR, уровень ATR относительно своего среднего значения и объём относительно своего среднего—чтобы вычислить вероятности для каждого направления рынка. Каждый индикатор делится на «зоны» (low, mid, high), которым приписаны условные вероятности для бычьего/медвежьего/нейтрального исхода. Скрипт нормирует эти вероятности и раскрашивает бары в зелёный, красный или синий цвет в зависимости от того, какая вероятность выше. Также в правом верхнем углу отображается таблица с текущими значениями вероятностей.

Naive Bayes Candlestick Pattern Classifier v1.1 BETAAn intermezzo on why i made this script publication..
A : Candlestick Pattern took hours to backtest, why not using Machine Learning techniques?
B : Machine Learning, no that's gonna be really heavy bro!
A : Not really, because we use Naive Bayes.
B : The simplest, yet powerful machine learning algorithm to separate (a.k.a classify) multivariate data.
----------------------------------------------------------------------------------------------------------------------
Hello, everyone!
After deep research in extracting meaningful information from the market, I ended up building this powerful machine learning indicator based on the evolution of Bayesian Statistics. This indicator not only leverages the simplicity of Naive Bayes but also extends its application to candlestick pattern analysis, making it an invaluable tool for traders who are looking to enhance their technical analysis without spending countless hours manually backtesting each pattern on each market!.
What most interesting part is actually after learning all of likely useless methods like fibonacci, supply and demand, volume profile, etc. We always ended up back to basic like support and resistance and candlestick patterns, but with a slight twist on strategy algorithm design and statistical approach. Thus, the only reason why i made this, because i exactly know that you guys will ended up in this position as time goes by.
The essence of this indicator lies in its ability to automate the recognition and statistical evaluation of various candlestick patterns. Traditionally, traders have relied on visual inspection and manual backtesting to determine the effectiveness of patterns like Bullish Engulfing, Bearish Engulfing, Harami variations, Hammer formations, and even more complex multi-candle patterns such as Three White Soldiers, Three Black Crows, Dark Cloud Cover, and Piercing Pattern. However, these conventional methods are both time-consuming and prone to subjective bias.
To address these challenges, I employed Naive Bayes—a probabilistic classifier that, despite its simplicity, offers robust performance in various domains. Naive Bayes assumes that each feature is independent of the others given the class label, which, although a strong assumption, works remarkably well in practice, especially when the dataset is large like market data and the feature space is high-dimensional. In our case, each candlestick pattern acts as a feature that can be statistically evaluated based on its historical performance. The indicator calculates a probability that a given pattern will lead to a price reversal, by comparing the pattern’s close price to the highest or lowest price achieved in a lookahead window.
One of the standout features of this script is its flexibility. Each candlestick pattern is not only coded into the system but also comes with individual toggles to enable or disable them based on your trading strategy. This means you can choose to focus on single-candle patterns like Bullish Engulfing or more complex multi-candle formations such as Three White Soldiers, without modifying the core code. The built-in customization options allow you to adjust colors and labels for each pattern, giving you the freedom to tailor the visual output to your preference. This level of customization ensures that the indicator integrates seamlessly into your existing TradingView setup.
Moreover, the indicator isn’t just about pattern recognition—it also incorporates outcome-based learning. Every time a pattern is detected, it looks ahead a predefined number of bars to evaluate if the expected reversal actually materialized. This outcome is then stored in arrays, and over time, the script dynamically calculates the probability of success for each pattern. These probabilities are presented in a real-time updating table on your chart, which shows not only the percentage probability but also the count of historical occurrences. With this information at your fingertips, you can quickly gauge the reliability of each pattern in your chosen market and timeframe.
Another significant advantage of this approach is its speed and efficiency. While more complex machine learning models like neural networks might require heavy computational resources and longer training times, the Naive Bayes classifier in this script is lightweight, instantaneous and can be updated on the fly with each new bar. This real-time capability is essential for modern traders who need to make quick decisions in fast-paced markets.
Furthermore, by automating the process of backtesting, the indicator frees up your time to focus on other aspects of trading strategy development. Instead of manually analyzing hundreds or even thousands of candles, you can rely on the statistical power of Naive Bayes to provide you with insights on which patterns are most likely to result in profitable moves. This not only enhances your efficiency but also helps to eliminate the cognitive biases that often plague manual analysis.
In summary, this indicator represents a fusion of traditional candlestick analysis with modern machine learning techniques. It harnesses the simplicity and effectiveness of Naive Bayes to deliver a dynamic, real-time evaluation of various candlestick patterns. Whether you are a seasoned trader looking to refine your technical analysis or a beginner eager to understand market dynamics, this tool offers a powerful, customizable, and efficient solution. Welcome to a new era where advanced statistical methods meet practical trading insights—happy trading and may your patterns always be in your favor!
Note : On this current released beta version, you must manually adjust reversal percentage move based on each market. Further updates may include automated best range detection and probability.

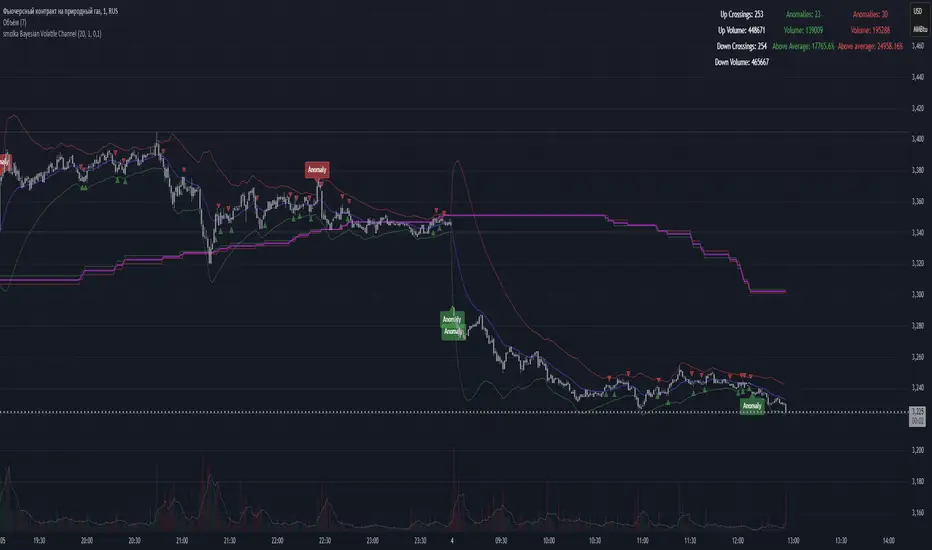
smolka Bayesian Volatile ChannelDescription in English and Russian.
Bayesian Volatile Channel
The script is a loose interpretation of Bayes' theorem, which allows calculating the probability of events given that another event related to it has occurred, the script analyzes volatility and detects anomalies in price charts using a Bayesian approach, updating the model parameters to accurately estimate market fluctuations and detect changes in trends.
How does it work?
1. The script sets the initial parameters (mean price and standard deviation), creating a "hypothesis" about the market behavior.
2. When a new price appears, the script calculates the probability of its compliance with previous expectations. If the new price differs from the forecast, the model parameters (mean and standard deviation) are updated.
3. After updating the model, the probability that the current price and volatility correspond to a normal distribution is calculated.
4. Based on the updated model, volatility channels are built (mean price ± two standard deviations). If the price goes beyond these limits, this signals a possible anomaly indicating changes in the market.
5. The moving averages in the script act as data smoothing and trend analysis, helping to identify the market direction and minimize the impact of random fluctuations. The script uses moving averages to identify uptrends and downtrends, and calculates the average between them to display the overall market balance. These moving averages make market analysis clearer and more resistant to short-term fluctuations.
******************************************************************
Описание на английском и русском языках.
Байесовский волатильный канал
Скрипт является вольной интерпретацией теоремы Байеса, которая позволяет расчитать вероятность событий при условии, что произошло связанное с ним другое событие, скрипт анализирует волатильность и обнаруживает аномалии в графиках цен, используя байесовский подход, обновляя параметры модели для точной оценки рыночных колебаний и обнаружения изменений в тенденциях.
Как это работает?
1. Скрипт устанавливает начальные параметры (среднюю цену и стандартное отклонение), создавая "гипотезу" о поведении рынка.
2. При появлении новой цены скрипт вычисляет вероятность её соответствия предыдущим ожиданиям. Если новая цена отличается от прогноза, параметры модели (среднее и стандартное отклонение) обновляются.
3. После обновления модели рассчитывается вероятность того, что текущая цена и волатильность соответствуют нормальному распределению.
4. На основе обновлённой модели строятся каналы волатильности (средняя цена ± два стандартных отклонения). Если цена выходит за эти пределы, это сигнализирует о возможной аномалии, указывающей на изменения на рынке.
5. Средние скользящие в скрипте выполняют роль сглаживания данных и анализа трендов, помогая выявить направление рынка и минимизировать влияние случайных колебаний. Скрипт использует скользящие средние для определения восходящего и нисходящего трендов, а также рассчитывает среднее значение между ними для отображения общего баланса рынка. Эти скользящие средние делают анализ рынка более чётким и устойчивым к краткосрочным флуктуациям.
Bayesian Trend Indicator [ChartPrime]Bayesian Trend Indicator
Overview:
In probability theory and statistics, Bayes' theorem (alternatively Bayes' law or Bayes' rule), named after Thomas Bayes, describes the probability of an event, based on prior knowledge of conditions that might be related to the event.
The "Bayesian Trend Indicator" is a sophisticated technical analysis tool designed to assess the direction of price trends in financial markets. It combines the principles of Bayesian probability theory with moving average analysis to provide traders with a comprehensive understanding of market sentiment and potential trend reversals.
At its core, the indicator utilizes multiple moving averages, including the Exponential Moving Average (EMA), Simple Moving Average (SMA), Double Exponential Moving Average (DEMA), and Volume Weighted Moving Average (VWMA) . These moving averages are calculated based on user-defined parameters such as length and gap length, allowing traders to customize the indicator to suit their trading strategies and preferences.
The indicator begins by calculating the trend for both fast and slow moving averages using a Smoothed Gradient Signal Function. This function assigns a numerical value to each data point based on its relationship with historical data, indicating the strength and direction of the trend.
// Smoothed Gradient Signal Function
sig(float src, gap)=>
ta.ema(source >= src ? 1 :
source >= src ? 0.9 :
source >= src ? 0.8 :
source >= src ? 0.7 :
source >= src ? 0.6 :
source >= src ? 0.5 :
source >= src ? 0.4 :
source >= src ? 0.3 :
source >= src ? 0.2 :
source >= src ? 0.1 :
0, 4)
Next, the indicator calculates prior probabilities using the trend information from the slow moving averages and likelihood probabilities using the trend information from the fast moving averages . These probabilities represent the likelihood of an uptrend or downtrend based on historical data.
// Define prior probabilities using moving averages
prior_up = (ema_trend + sma_trend + dema_trend + vwma_trend) / 4
prior_down = 1 - prior_up
// Define likelihoods using faster moving averages
likelihood_up = (ema_trend_fast + sma_trend_fast + dema_trend_fast + vwma_trend_fast) / 4
likelihood_down = 1 - likelihood_up
Using Bayes' theorem , the indicator then combines the prior and likelihood probabilities to calculate posterior probabilities, which reflect the updated probability of an uptrend or downtrend given the current market conditions. These posterior probabilities serve as a key signal for traders, informing them about the prevailing market sentiment and potential trend reversals.
// Calculate posterior probabilities using Bayes' theorem
posterior_up = prior_up * likelihood_up
/
(prior_up * likelihood_up + prior_down * likelihood_down)
Key Features:
◆ The trend direction:
To visually represent the trend direction , the indicator colors the bars on the chart based on the posterior probabilities. Bars are colored green to indicate an uptrend when the posterior probability is greater than 0.5 (>50%), while bars are colored red to indicate a downtrend when the posterior probability is less than 0.5 (<50%).
◆ Dashboard on the chart
Additionally, the indicator displays a dashboard on the chart , providing traders with detailed information about the probability of an uptrend , as well as the trends for each type of moving average. This dashboard serves as a valuable reference for traders to monitor trend strength and make informed trading decisions.
◆ Probability labels and signals:
Furthermore, the indicator includes probability labels and signals , which are displayed near the corresponding bars on the chart. These labels indicate the posterior probability of a trend, while small diamonds above or below bars indicate crossover or crossunder events when the posterior probability crosses the 0.5 threshold (50%).
The posterior probability of a trend
Crossover or Crossunder events
◆ User Inputs
Source:
Description: Defines the price source for the indicator's calculations. Users can select between different price values like close, open, high, low, etc.
MA's Length:
Description: Sets the length for the moving averages used in the trend calculations. A larger length will smooth out the moving averages, making the indicator less sensitive to short-term fluctuations.
Gap Length Between Fast and Slow MA's:
Description: Determines the difference in lengths between the slow and fast moving averages. A higher gap length will increase the difference, potentially identifying stronger trend signals.
Gap Signals:
Description: Defines the gap used for the smoothed gradient signal function. This parameter affects the sensitivity of the trend signals by setting the number of bars used in the signal calculations.
In summary, the "Bayesian Trend Indicator" is a powerful tool that leverages Bayesian probability theory and moving average analysis to help traders identify trend direction, assess market sentiment, and make informed trading decisions in various financial markets.

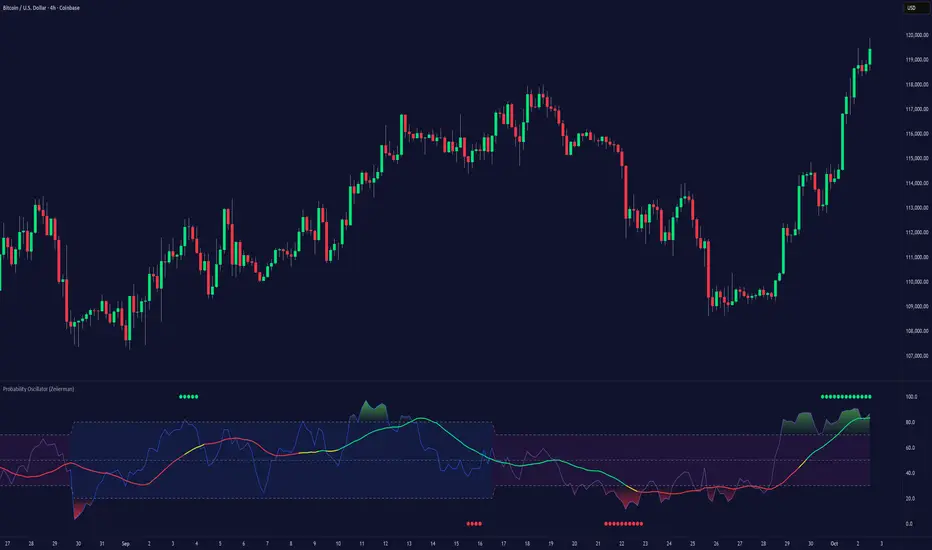
Probability Oscillator (Zeiierman)█ Overview
The Probability Oscillator (Zeiierman) turns price dynamics into a regime-aware probability map of continuation vs. reversal. Rather than treating momentum as a single, fixed signal, it adapts its core estimator to current market conditions—favoring trend persistence in calm regimes and oscillation/reversion in volatile regimes.
You get a fast Probability line, a slower Signal line, dynamic OB/OS bounds, midline bias, color-coded trend probability, background regime cues, and Momentum Impulse dots that reveal concentrated bursts of directional intent. Beneath the surface, the Probability line functions as a sequential Bayesian filter — continuously updating a regime-conditioned prior (trend or volatility) with new market evidence. The resulting posterior odds are then expressed as a bounded oscillator for intuitive interpretation. In stable markets, the prior favors continuity; in volatile markets, it reweights toward mean reversion.
⚪ Why This One Is Unique
The Probability Oscillator operates within a self-adaptive probabilistic framework that continuously reshapes itself in response to the market’s evolving structure. Rather than relying on fixed formulas or static thresholds, it employs a context-aware Bayesian core that interprets flow dynamics through an adaptive regime model.
Its internal architecture blends state recognition, probability normalization, and dynamic envelope mapping, allowing it to adjust between conditions of directional stability and volatility-driven reversion fluidly. The result is an intelligent, self-adjusting probability field that remains stable in trends, reactive in consolidations, and contextually aware across all market states—delivering a refined sense of probabilistic direction without exposing raw computational structure.
█ Main Features
⚪ Probability Oscillator
At the core lies a probability-driven oscillator that continuously adapts its internal weighting to evolving market behavior. It translates incoming price evidence into a smooth probability curve that distinguishes between continuation and reversion phases, providing a refined view of conviction beneath price action.
The Probability Oscillator estimates the likelihood of trend continuation while dynamically adjusting to the surrounding volatility regime:
Probability Line (fast) – Captures short-term probability shifts, weighted by current market conditions — calm or volatile.
Signal Line (slow) – A smoothed probability filter that defines the prevailing bias and confirms directional persistence.
Momentum Impulse Dots – Small markers highlighting bursts of positive (green) or negative (red) momentum, indicating transitions in conviction strength.
The oscillator’s probabilistic framework automatically transitions between two self-adaptive modes:
Low-Volatility Mode – Prioritizes directional momentum and smooth trend continuity, ideal for trending markets.
High-Volatility Mode – Emphasizes oscillatory probability swings and reversals, optimized for range-bound or transitional conditions.
This dual-regime behavior allows the Probability Oscillator to remain stable in directional trends yet responsive in volatile ranges, producing a coherent probabilistic signal across any timeframe.
⚪ Trend Probability Coloring
The Trend Probability Coloring system transforms the Signal Line into a live confidence gauge. Its adaptive hue reflects the underlying probabilistic bias — green for sustained bullish pressure, red for bearish control, and yellow during transitional uncertainty. Behind the scenes, it applies curvature-sensitive weighting and probabilistic smoothing to display a visually coherent measure of directional conviction.
⚪ Impulse Dots
Impulse Dots identify moments of concentrated momentum expansion — short bursts of probabilistic acceleration that often precede shifts in structure. Each impulse represents a localized jump in directional confidence, isolating meaningful change-points from background noise. The result is a precise visualization of where probability and price begin to align, revealing early cues of strength, exhaustion, or imminent rotation.
█ How to Use
⚪ Trend Following
The Signal Line acts as the long-term probabilistic trend gauge, revealing when the market is building or losing directional conviction. Its slope and color communicate both bias and transition strength:
Green → bullish probability bias (trend continuation likely).
Red → bearish probability bias (downside continuation likely).
Yellow → transitional or indecisive phase (potential regime shift).
Use the Signal Line to confirm directional alignment:
A transition from red → yellow → green signals that the market is turning bullish and probability is shifting toward continuation on the upside.
A transition from green → yellow → red signals that bullish conviction is fading and bearish control is emerging.
⚪ Overbought & Oversold
The Probability Oscillator can also be used to identify overbought and oversold conditions by observing when the Probability Line moves above its upper bound or below its lower bound. These events often signal potential market slowdowns, pullbacks, or even broader reversals depending on context and regime.
The OB/OS levels automatically adapt to the prevailing market mode:
Trend Mode (~70/30) – Optimized for riding trends and timing pullbacks within directional continuations.
Volatility Mode (~80/20) – Tailored for fading extremes and capturing fast mean-reversion moves during consolidation phases.
Signals: Reclaims from oversold zones within a bullish bias, or rejections from overbought zones in a bearish bias, represent high-probability inflection points — especially when confirmed by Impulse Dots or regime-aligned Signal Line color transitions.
⚪ Using Volatility Modes to Choose Strategy
The Probability Oscillator automatically adapts its behavior to the active volatility regime, enabling traders to align their approach with the current market state. One of the most effective ways to use the tool is to select a trading strategy that aligns with the prevailing market mode.
Trend Mode (purple fill) – Represents low-volatility, directional environments where markets move smoothly and sustain momentum over time. In these conditions, a trend-following approach is most effective. Focus on the broader direction, participate on Probability-over-Signal crossups above 50, and trail positions as long as the Signal Line remains green. These calm phases often persist before volatility expansion, making them ideal for riding steady continuation waves rather than reacting to short-term fluctuations.
Volatility Mode (blue switch bar) – Activates in high-volatility conditions, signaling increased market agitation and sharper price swings. In this regime, trading becomes more tactical. Mean-reversion and scalping strategies perform best—fade OB/OS extremes, use midline reclaims for timing, or trade Impulse confirmations to capture breakout accelerations and short-term momentum surges.
⚪ Impulse
The Momentum Impulses highlight periods when the market experiences sharp bursts of directional momentum, marking transitions in conviction strength and energy expansion.
Green top dots → Indicate strong bullish impulses, often signaling the onset or acceleration of upward momentum.
Red bottom dots → Indicate strong bearish impulses, highlighting pressure buildup or downside continuation.
These impulses are particularly useful in two contexts:
During ranging markets , they help confirm overbought and oversold conditions, signaling when reversals or exhaustion points are highly probable.
During regime transitions , they validate breakout strength, confirming that new directional phases are supported by genuine momentum rather than noise.
In essence, Impulse Dots visualize the heartbeat of market conviction—pinpointing where momentum surges align with probabilistic bias, whether to confirm a breakout or warn of exhaustion in choppy conditions.
█ How It Works
⚪ Regime Switch Engine
At the foundation lies a Bayesian regime adaptation process that treats volatility as evolving market evidence. The system continuously updates a prior belief about whether the market favors directional persistence or oscillatory reversion. In calm states, it maintains a continuity-biased belief structure that favors smoother probability propagation.
Calculation: Employs a volatility-normalized Bayesian comparator, generating a posterior distribution over regime likelihoods. This ensures the oscillator remains statistically invariant to scale and consistent across instruments and timeframes.
⚪ Trend Probability Coloring (Conviction Layer)
The Trend Probability Coloring system visualizes Bayesian posterior confidence in real time. It continuously updates the Signal Line’s color as new evidence shifts the model’s belief between bullish, neutral, and bearish states.
When the posterior probability leans strongly upward, the line turns green; as uncertainty grows, it fades to yellow; and when conviction turns negative, it transitions to red. Each color change represents a probabilistic reweighting — the model’s evolving assessment of directional dominance.
Calculation: Applies posterior-weighted smoothing and curvature-based confidence mapping to translate Bayesian belief strength into a fluid visual gradient.
⚪ Momentum Impulse Engine
The Momentum Impulse Engine detects sudden bursts in probabilistic conviction — moments when the Bayesian posterior sharply reweights toward one directional outcome. These impulses represent statistically significant shifts in belief, where new evidence rapidly alters the model’s assessment of market direction.
Green impulses highlight surges in bullish probability; red impulses mark spikes in bearish conviction. Each impulse reflects a brief phase of directional dominance, revealing where probability momentum begins to accelerate or exhaust.
Calculation: Employs nonlinear Bayesian change detection and extreme-value gating to isolate abrupt posterior inflections.
-----------------
Disclaimer
The content provided in my scripts, indicators, ideas, algorithms, and systems is for educational and informational purposes only. It does not constitute financial advice, investment recommendations, or a solicitation to buy or sell any financial instruments. I will not accept liability for any loss or damage, including without limitation any loss of profit, which may arise directly or indirectly from the use of or reliance on such information.
All investments involve risk, and the past performance of a security, industry, sector, market, financial product, trading strategy, backtest, or individual's trading does not guarantee future results or returns. Investors are fully responsible for any investment decisions they make. Such decisions should be based solely on an evaluation of their financial circumstances, investment objectives, risk tolerance, and liquidity needs.
Płatny skrypt
Bayesian BBSMA + nQQE Oscillator + Bank funds (whales detector)Three trend indicators in one. Fork of Gunslinger2005 indicator, with a fix to display the nQQE oscillator correctly and clearly, and converted to pinescript v5 (allowing to set a different timeframe and gaps).
How to use: Essentially, nQQE is a long term trend indicator which is more adequate in daily or weekly timeframe to indicate the current market cycle. Banker Fund seems better suited to indicate current local trend, although it is sensitive to relief rallies. Bayesian BBSMA is an awesome tool to visualize the buildup in bullish/bearish sentiment, and when it is more likely to get released, however it is unreliable, so it needs to be combined with other indicators.
Please show the original indicators some love:
Bayesian BBSMA:
nQQE:
L3 Banker Fund Flow Trend:
Originally mixed together by Gunslinger2005:

The Bayesian Q OscillatorFirst of all the biggest thanks to @tista and @KivancOzbilgic for publishing their open source public indicators Bayesian BBSMA + nQQE Oscillator. And a mighty round of applause for @MarkBench for once again being my superhero pinescript guy that puts these awesome combination Ideas and ES stradegies in my head together. Now let me go ahead and explain what we have here.
I am gonna call it the Bayesian Q Oscillator I suppose. The goal of the script is to solve an issue both indicators on their own suffer from. QQE signals are not new and often the problem has always been false signals for them. They are good for scalping but the difference between a quality move and a small to nearly nonexistent move following a signal is not so clear. Kivanc made his normalized version to help reduce this problem by adding colors to his histogram type verision that would essentially represent if price was a trending move or in a ranging structure. As you can see I have kept this Idea but instead opted for lines as the oscillator. two yellow line (default color) is a ranging sideways area and when there is red or green it is trending up or down. I wanted to take this to the next level with combining the Bayesian probability oscillator that tista put together.
The Bayesian indicator is the opposite for its issue as it is a probability indicator that shows which candle or price movement is more likely to come next. Red rising means possibly down move soon and green means up soon. I will not go into the complex details of this indicator but will suggest others take a look at his and others to understand the idea behind them. The point I am driving at is that it show probabilities or likelyhood without the most effecient signal device to match it. This original was line form and now it is background filled colors.
The idea. is that you can potentially get some stronger and more accurate reversal signals with these two paired together. when you see a sell signal or cross with the towering or rising red... maybe it is a good jump potentially. The same for green. At the same time it is a double added filter effect from just having yellow represent it is ranging... but now if you get a buy signal (example) and have yellow lines (example) along wi5h a red rising or mountain color background... it not only is an indication of ranging, but also that there is potentially even a counter move coming based on the probabilities. Also if you get into a good trade and see dual yellow qqe crosses with no color represented by the bayesian background... it is possible it might only be noise.
I have found them to work decently in the 1 hour timframe. Let me know your experience.
I hope everyone takes a look at the originals to understand them. Full credit goes to those guys for this to be here. Let me know how it is working out for you.
Here are the original links.
bayesian
Normalized QQE

[Max] Volume Entropy Divergence FilteredAn indicator that represent in 3 line my Volume Entropy Divergence Heatmap indicator.
I've use a very basic sum with some weights like this : Long therm > Mid therm > short Therm, But short and mid therm can still have influence.
Some people did request this indicator to be able to use the heatmap in there indicators with the new tradingview link function. There still a problem that will be the subject of a future update, when the divergence is to high it's often mean that instead of a divergence, we have a continuation or a parabolic.
This indicator still also need a location checker to try to don't short the bottom.
There is 3 lines, 2 are the sum of the negative/positive divergences.
The third one is the result off a karman volatility filter, with differents weigths for each line off the heatmap, it can easily used to find reversals.
You have some options to play with the volatility filter, the defaults settings are the ones I think is the best.
This script will still private for the same reasons raised in the original heatmap.
My policy : If you can provide me nice updates, I will give you the source code, if within 3 month I don't use it anymore it will pass in public.
If you have any improvement idears I will be please to ear them.
Have a nice day !
Max

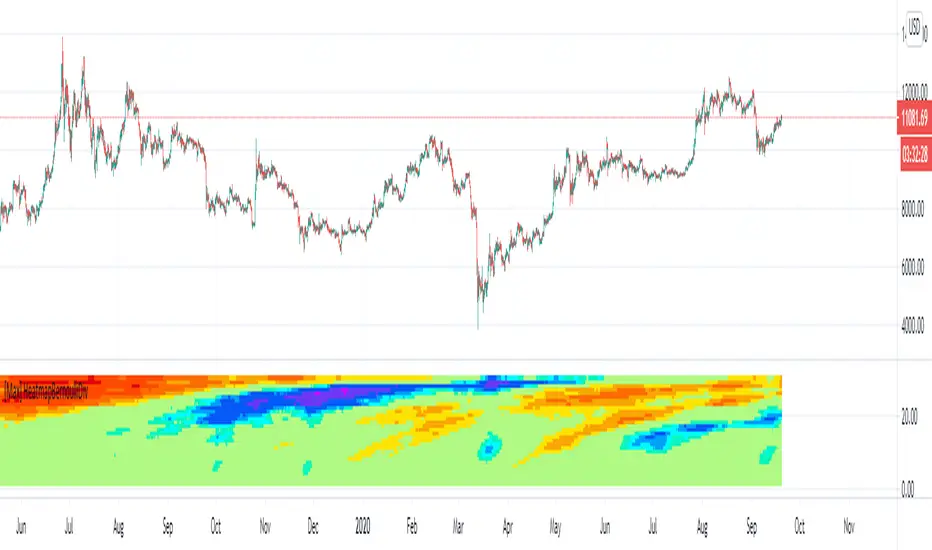
[Max] Volume Entropy Divergence HeatmapA divergence between volume and price indicator, based on custom filter function.
Each lines represent a length on wich the divergence is calculated. It goes to 60 len a the base to 2000 at the high. ( You have to decrease the timeframe if your looking on a new chart).
Colors represent a level of the oscillator who is calculated for each lengths.
What can you find, reversals, confirmation of continuation, divergences between volume and price,.. (if you find other usages I will be happy to hear it and share the code).
I recommand to be attentive to lower timeframes and confirm with higher ones and be attentive between different kind of clouds there is.
You are in charge to figure out how to use it, if you have some doubts on something you can DM me but I will not teach my way to use it.
It provide for me nice transformations, nice enough to share this indicator in private.
Big thanks to @midtownsk8rguy for the heatmap color function.
Have a nice daytrading all !
Bayesian BBSMA OscillatorSometime ago (very long ago), one of my tinkering project was to do a spam or ham classification type app to filter news I'd wanna read. So I built myself a Naive Bayes Classifier to feed me my relevant articles. It worked great, I can cut through the noise.
The hassle was I needed to manually train it to understand what I wanna read. I trained it using 50 articles and to my surprise, it's enough.
Complexity Theory
I've been reading a book called The Road to Ruin by Jim Rickards. He described how he got to his conclusion of how the stock market works by using Complexity Theory. Bill Williams would agree. Jim tells us that by using just enough data, we calculate the probability of an event to occur. We can't say for sure when but we know it's coming. This was my light bulb moment.
While Jim talks much about Bayesian Inference in which a probability of an event can always be updated as more evidence comes to light, I had my eyes set on binary probabilities of when prices are going up and down.
Assumptions
These are my assumptions:
Prices breaking up a Bollinger basis line will have fuel to go up even higher
Prices will go down when prices have broken up a Bollinger upper band
Scalping is the main method so we should use a lower period Moving Average (MA)
When prices are above MA, it's likelier a correction to the downside is imminent
When prices are below MA, it's likelier a correction to the upside is imminent
Optimize parameters for 1 hour timeframe which will give us time to react while still having more opportunities to trade
Building Blocks
Jim Rickards started with limited data (events) while in technical trading, data are plentiful. I decided to classify 2 events which are:
Next candles would be breaking up
Next candles would be breaking down
Key facts:
We won't know for sure when prices are going to break
We won't know for sure how much the prices movements are going to be
Formulas
Breaking up:
Pr(Up|Indicator) = Pr(Indicator|Up) * Pr(Up) / Pr(Indicator|Up) * Pr(Up) + Pr(Indicator|Down) * Pr(Down)
Breaking down:
Pr(Down|Indicator) = Pr(Indicator|Down) * Pr(Down) / Pr(Indicator|Down) * Pr(Down) + Pr(Indicator|Up) * Pr(Up)
Reading The Oscillator
Green is the probability of prices breaking up
Red is the probability of prices breaking down
When either green or red is flatlining ceiling, immediately on the next candle when the probability decreases go short or long based on which direction you're observing - Strong Signal
When either green or red is flatlining ceiling, take no action while it's ceiled
Usually when either green or red is flatlining bottom, the next candle when the probability increases, immediately take a short long position based on the direction you're observing - Weak Signal
When either green or red is flatlining bottom, take no action while it's bottomed
Alerts
Use Once per Bar option when generating alerts.
