Harmonic Patterns (Experimental) [Kodexius]Harmonic Patterns (Experimental) is a multi pattern harmonic geometry scanner that automatically detects, validates, and draws classic harmonic structures directly on your chart. The script continuously builds a pivot map (swing highs and swing lows), then evaluates the most recent pivot sequence against a library of harmonic ratio templates such as Gartley, Bat, Deep Bat, Butterfly, Crab, Deep Crab, Cypher, Shark, Alt Shark, 5-0, AB=CD, and 3 Drives.
Unlike simple “pattern exists / pattern doesn’t exist” indicators, this version scores candidates by accuracy . Each pattern includes “ideal” ratio targets, and the script computes a total error score by measuring how far the observed ratios deviate from the ideal. When multiple patterns could match the same pivot structure, the script selects the best match (lowest total error) and displays that one. This reduces clutter and makes the output more practical in real market conditions where many ratio ranges overlap.
The end result is a clean, information rich visualization of harmonic opportunities that is:
-Pivot based and swing aware
-Ratio validated with configurable tolerance
-Direction filtered (bullish, bearish, or both)
-Ranked by accuracy to prefer higher quality matches
Note: This is an experimental pattern engine intended for research, confluence and chart study. Harmonic patterns are probabilistic and can fail often. Always combine with your own risk management and confirmation tools.
🔹 Features
🔸Pivot Detection
The script uses pivot functions to detect structural turning points:
-Pivot Left Bars controls how many bars must exist on the left of the pivot
-Pivot Right Bars controls confirmation delay on the right (smaller value reacts faster)
Additionally, a Min Swing Distance (%) filter can ignore tiny swings to reduce noise. Pivots are stored separately for highs and lows and capped by Max Pivots to Store to keep the script efficient.
🔸Pattern Library (XABCD and Beyond)
Supported structures include:
-Gartley, Bat, Deep Bat, Butterfly, Crab, Deep Crab
-Cypher (uses XC extension and CD retracement logic)
-Shark and Alt Shark (0-X-A-B-C mapping)
-5-0 (AB and BC extensions with CD retracement)
-AB=CD (symmetry and proportionality checks)
-3 Drives (6 point structure, drive and retracement ratios)
Each pattern is defined by ratio ranges and also “ideal” ratio targets used for scoring.
🔸 Pattern Fibonacci Rules (Detailed Ratio Definitions)
This script validates each harmonic template by measuring a small set of Fibonacci relationships between the legs of the pattern. All measurements are computed using absolute price distance (so the ratios are direction independent), and then a directional sanity check ensures the geometry is positioned correctly for bullish or bearish cases.
How ratios are measured
Most patterns in this script use the standard X A B C D harmonic structure. Four ratios are evaluated:
1) XB retracement of XA
This measures how much price retraces from A back toward X when forming point B .
xbRatio = |B - A| / |A - X|
2) AC retracement of AB
This measures how much point C retraces the AB leg.
acRatio = |C - B| / |B - A|
3) BD extension of BC
This measures the “drive” from C into D relative to the BC leg.
bdRatio = |D - C| / |C - B|
4) XD retracement of XA
This is the most important “completion” ratio in many patterns. It measures where D lands relative to the original XA swing.
xdRatio = |D - A| / |A - X|
Important: the script applies a user defined Fibonacci Tolerance to each accepted range, meaning the pattern can still pass even if ratios are slightly off from the textbook values.
🔸 XABCD Pattern Ratio Templates
Below are the exact ratio rules used by the templates in this script.
Gartley
-XB must be ~0.618 of XA
-AC must be between 0.382 and 0.886 of AB
-BD must be between 1.272 and 1.618 extension of BC
-XD must be ~0.786 of XA
In practice, Gartley is a “non extension” structure, meaning D usually remains inside the X boundary .
Bat
-XB between 0.382 and 0.50 of XA
-AC between 0.382 and 0.886 of AB
-BD between 1.618 and 2.618 of BC
-XD ~0.886 of XA
Bat patterns typically complete deeper than Gartley and often create a sharper reaction at D.
Deep Bat
-XB ~0.886 of XA
-AC between 0.382 and 0.886 of AB
-BD between 1.618 and 2.618 of BC
-XD ~0.886 of XA
Deep Bat uses the same completion zone as Bat, but requires a much deeper B point.
Butterfly
-XB ~0.786 of XA
-AC between 0.382 and 0.886 of AB
-BD between 1.618 and 2.618 of BC
-XD between 1.272 and 1.618 of XA
Butterfly is an extension pattern . That means D is expected to break beyond X (in the completion direction).
Crab
-XB between 0.382 and 0.618 of XA
-AC between 0.382 and 0.886 of AB
-BD between 2.24 and 3.618 of BC
-XD ~1.618 of XA
Crab is also an extension pattern . It often produces a very deep D completion and a strong reaction zone.
Deep Crab
-XB ~0.886 of XA
-AC between 0.382 and 0.886 of AB
-BD between 2.0 and 3.618 of BC
-XD ~1.618 of XA
Deep Crab combines a deep B point with a strong XA extension completion.
🔸 Cypher Fibonacci Rules (XC Based)
Cypher is not validated with the same four ratios as XABCD patterns. Instead it uses an XC based completion model:
1) B as a retracement of XA
xb = |B - A| / |A - X| // AB/XA
Must be between 0.382 and 0.618 .
2) C as an extension from X relative to XA
xc = |C - X| / |A - X| // XC/XA
Must be between 1.272 and 1.414 .
3) D as a retracement of XC
xd = |D - C| / |C - X| // CD/XC
Must be ~ 0.786 .
This makes Cypher structurally different: the “completion” is defined as a retracement of the entire XC leg, not XA.
🔸 Shark and Alt Shark Fibonacci Rules (0-X-A-B-C Mapping)
Shark patterns are commonly defined as 0 X A B C . In this script the pivots are mapped like this:
0 = pX, X = pA, A = pB, B = pC, C = pD
So the final pivot (stored as pD) is labeled as C on the chart.
Three ratios are validated:
1) AB relative to XA
ab_xa = |B - A| / |A - X|
Must be between 1.13 and 1.618 .
2) BC relative to AB
bc_ab = |C - B| / |B - A|
Must be between 1.618 and 2.24 .
3) OC relative to OX
oc_ox = |C - 0| / |X - 0|
For Shark it must be between 0.886 and 1.13 .
For Alt Shark it must be between 1.13 and 1.618 (a deeper / more extended completion).
🔸 5-0 Fibonacci Rules
5-0 is validated as a sequence of extensions and then a fixed retracement:
1) AB extension of XA
ab_xa = |B - A| / |A - X|
Must be between 1.13 and 1.618 .
2) BC extension of AB
bc_ab = |C - B| / |B - A|
Must be between 1.618 and 2.24 .
3) CD retracement of BC
cd_bc = |D - C| / |C - B|
Must be approximately 0.50 .
Note that for 5-0 the script does not rely on an XA completion ratio like 0.786 or 1.618. The defining completion is the 0.5 retracement of BC.
🔸 AB=CD Fibonacci Rules
AB=CD is a symmetry pattern and is treated differently from the harmonic templates:
1) AB and CD length symmetry
The script checks if CD is approximately equal to AB within tolerance.
2) BC proportion
BC/AB is expected to fall in a common Fibonacci retracement zone:
-approximately 0.618 to 0.786 (with a looser tolerance in code)
3) CD/BC expansion
CD/BC is expected to be an expansion ratio:
-approximately 1.272 to 1.618 (also with a looser tolerance)
This allows the script to capture both classic equal leg AB=CD and common “expanded” variations.
🔸 3 Drives Fibonacci Rules (6 Point Structure)
3 Drives is a 6 point structure and is validated using retracement ratios and extension ratios:
Retracement rules
Retracement 1 must be between 0.618 and 0.786 of Drive 1
Retracement 2 must be between 0.618 and 0.786 of Drive 2
Extension rules
Drive 2 must be between 1.272 and 1.618 of Retracement 1
Drive 3 must be between 1.272 and 1.618 of Retracement 2
This pattern is meant to capture rhythm and proportional repetition rather than a single XA completion ratio.
🔸 Why the script can show “ratio labels” on legs
If you enable Show Fibonacci Values on Legs , the script prints the measured ratios near the midpoint of each leg (or diagonal, depending on pattern type). This makes it easy to visually confirm:
-Which ratios caused the pattern to pass
-How close the structure is to ideal harmonic values
-Why one template was preferred over another via the accuracy score
🔸 Fibonacci Tolerance Control
All ratio checks use a single tolerance input (percentage). This tolerance expands or contracts the acceptable ratio ranges, letting you decide whether you want:
-Tight, high precision matches (lower tolerance)
-Broader, more frequent matches (higher tolerance)
🔸 Direction Filter (Bullish Only / Bearish Only / Both)
You can restrict scanning to bullish patterns, bearish patterns, or allow both. This is useful if you are aligning with higher timeframe bias or only trading one side of the market.
🔸 Best Match Selection (Anti Clutter Logic)
When a new pivot confirms, the script evaluates all enabled patterns against the latest pivot sequence and keeps the one with the smallest total error score. This is especially helpful because many harmonic templates overlap in real time. Instead of drawing multiple conflicting labels, you get one “most accurate” candidate.
🔸 Clean Visual Rendering and Optional Details
The drawing system can display:
-Main structure lines (X-A-B-C-D or special mappings)
-Dashed diagonals for geometric context (XB, AC, BD, XD)
-Pattern fill to visually highlight the structure zone
-Point labels (X,A,B,C,D or 0..5 for 3 Drives, 0-X-A-B-C for Shark)
-Leg Fibonacci labels placed around midpoints for fast ratio reading
All colors (bullish and bearish line and fill) are configurable.
🔸 Pattern Spacing and Display Limits
To keep charts readable, the script includes:
-Max Patterns to Display to limit on-chart drawings
-Min Bars Between Patterns to avoid repeated signals too close together in the same direction
Older patterns are automatically deleted once the display limit is exceeded.
🔸 Alerts
When enabled, alerts trigger on new confirmed detections:
-Bullish Pattern Detected
-Bearish Pattern Detected
Alerts fire once per bar when a new pattern is confirmed by a fresh pivot.
🔹 Calculations
This section summarizes the core logic used under the hood.
1) Pivot Detection and Swing Filtering
The script confirms pivots using right side confirmation, then optionally filters them by minimum swing distance relative to the last opposite pivot.
// Pivot detection
float pHigh = ta.pivothigh(high, pivotLeftBars, pivotRightBars)
float pLow = ta.pivotlow(low, pivotLeftBars, pivotRightBars)
// Example swing distance filter (conceptual)
abs(newPivot - lastOppPivot) / lastOppPivot >= minSwingPercent
Pivots are stored in capped arrays (high pivots and low pivots), ensuring performance and stable memory usage.
2) Ratio Measurements (Retracement and Extension)
The engine measures harmonic ratios using two core helpers:
Retracement measures how much the third point retraces the previous leg.
Extension measures how much the next leg extends relative to the previous leg.
// Retracement: (p3 - p2) compared to (p2 - p1)
calcRetracement(p1, p2, p3) =>
float leg = math.abs(p2.price - p1.price)
float retr = math.abs(p3.price - p2.price)
leg != 0 ? retr / leg : na
// Extension: (p4 - p3) compared to (p3 - p2)
calcExtension(p2, p3, p4) =>
float leg = math.abs(p3.price - p2.price)
float ext = math.abs(p4.price - p3.price)
leg != 0 ? ext / leg : na
For a standard XABCD pattern the script evaluates:
-XB retracement of XA
-AC retracement of AB
-BD extension of BC
-XD retracement of XA
3) Tolerance Based Range Check
Ratio validation uses a flexible range check that expands min and max by the tolerance percent:
isInRange(value, minVal, maxVal, tolerance) =>
float tolMin = minVal * (1.0 - tolerance)
float tolMax = maxVal * (1.0 + tolerance)
value >= tolMin and value <= tolMax
This means even “fixed” ratios (like 0.786) still allow a user controlled deviation.
4) Positional Sanity Check for D (Beyond X or Not)
Some harmonic patterns require D to remain within X (non extension patterns), while others require D to break beyond X (extension patterns). The script enforces that using a boolean flag in each template.
Conceptually:
-If the pattern is an extension type, D should cross beyond X in the expected direction
-If the pattern is not extension type, D should stay on the correct side of X
This prevents visually incorrect “ratio matches” that violate the intended geometry.
5) Template Definitions (Ranges + Ideal Targets)
Every pattern includes ratio ranges plus ideal values. The ideal values are used only for scoring quality, not for pass/fail. Example concept:
-Ranges determine validity
-Ideal targets determine ranking
6) Accuracy Scoring (Total Error)
When a candidate passes all validity checks, the script computes an accuracy score by summing absolute deviations from ideal ratios:
calcError(value, ideal) =>
math.abs(value - ideal)
// Total error is the sum of the four leg errors (as available for the pattern)
totalError =
calcError(xbRatio, xbIdeal) +
calcError(acRatio, acIdeal) +
calcError(bdRatio, bdIdeal) +
calcError(xdRatio, xdIdeal)
Lower score means closer to the “textbook” harmonic proportions.
7) Best Match Resolution (Choosing One Winner)
When multiple enabled patterns match the same pivot structure, the script selects the one with the lowest totalError:
updateBest(currentBest, newCandidate) =>
result = currentBest
if not na(newCandidate)
if na(currentBest) or newCandidate.totalError < currentBest.totalError
result := newCandidate
result
This is a major practical feature because it reduces clutter and highlights the highest quality interpretation.
8) Bullish and Bearish Scanning Logic
The scanner runs when pivots confirm:
-Bullish patterns are evaluated on a newly confirmed pivot low (potential D)
-Bearish patterns are evaluated on a newly confirmed pivot high (potential D)
From that D pivot, the script searches backward through stored pivots to build a valid pivot sequence (X,A,B,C,D). If 3 Drives is enabled, it also attempts to find the extra preceding point needed for the 6 point structure.
9) Rendering: Lines, Fill, Labels, and Leg Fib Text
After detection the script draws:
-Primary legs with thicker lines
-Geometric diagonals with dashed lines (for XABCD types)
-Optional fill between selected legs to emphasize the structure area
-A summary label showing direction, pattern name, and ratios
-Optional point labels and leg ratio labels placed near midpoints
To avoid overlapping with candles, the script offsets labels using ATR:
float yOff = math.max(ta.atr(14) * 0.15, syminfo.mintick * 10)
10) Pattern Lifecycle and Cleanup
To respect chart limits and keep visuals clean, the script deletes old drawings once the maximum visible patterns threshold is exceeded. This includes lines, fills, and labels.
Formacja Nietoperza

The Butterfly [theUltimator5]This is a technical analysis tool designed to automatically detect and visualize Butterfly harmonic patterns based on recent market pivot structures. This indicator uses a unique plotting and detection algorithm to find and display valid Butterfly patterns on the chart.
The indicator works in real-time and historically by identifying major swing highs and lows (pivots) based on a user-defined ZigZag length. It then evaluates whether the most recent price structure conforms to the ideal proportions of a bullish or bearish Butterfly pattern. If the ratios between price legs XA, AB, BC, and projected CD meet defined tolerances, the pattern is plotted on the chart along with a projected D point for potential reversal.
Key Features:
Automatic Pivot Detection: The script analyzes recent price action to construct a ZigZag pattern, identifying swing points as potential X, A, B, and C coordinates.
Butterfly Pattern Validation: The pattern is validated against traditional Fibonacci ratios:
--AB should be approximately 78.6% of XA.
--BC must lie between 38.2% and 88.6% of AB.
--CD is projected as a multiple of BC, with user control over the ratio (e.g., 1.618–2.24).
Bullish and Bearish Recognition: The pattern logic detects both bullish and bearish Butterflies, automatically adjusting plotting direction and color themes.
Custom Ratio Tolerance: Users can define how strictly the AB/XA and BC/AB legs must adhere to ideal ratios, using a percentage-based tolerance slider.
Fallback Detection Logic: If a new pattern is not identified in recent bars, the script performs a backward search on the last four pivots to find the most recent valid pattern.
Force Mode: A toggle allows users to force the drawing of a Butterfly pattern on the most recent pivot structure, regardless of whether the ideal Fibonacci rules are satisfied.
Dynamic Visualization:
--Clear labeling of X, A, B, C, and D points.
--Colored connecting lines and filled triangles to visualize structure.
--Optional table displaying key Fibonacci ratios and how close each leg is to ideal values.
Inputs:
Length: Controls the sensitivity of the ZigZag pivots. Smaller values result in more frequent pivots.
Tolerance (%): Adjustable threshold for acceptable deviation in AB/XA and BC/AB ratios.
CD Length Multiplier: Projects point D by multiplying the BC leg using a value between 1.618 and 2.24.
Force New Pattern: Overrides validation checks to display a Butterfly structure on recent pivots regardless of ratio accuracy.
Show Table: Enables a table showing calculated ratios and deviations from the ideal.

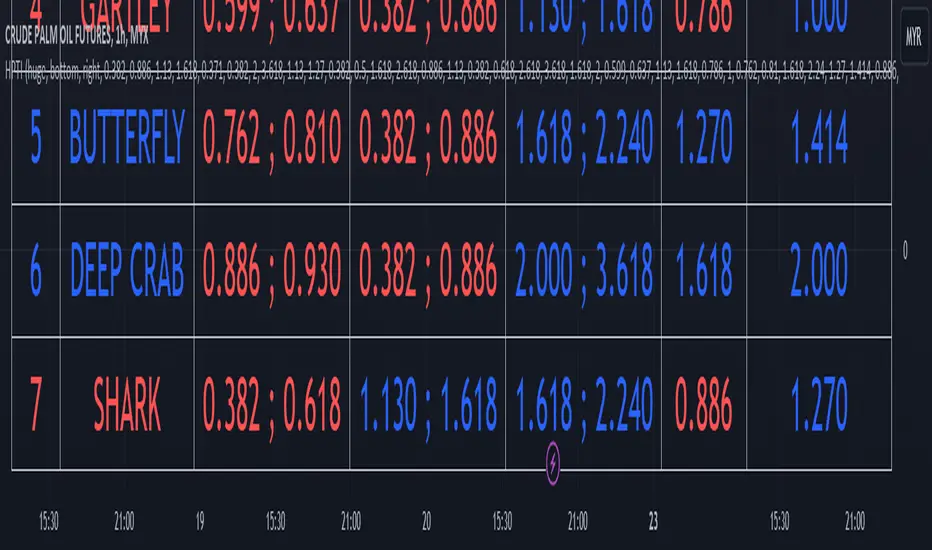
Harmonic Pattern Table Inputs█ OVERVIEW
This indicator was intended as educational purpose only based on Harmonic Pattern Table (Source Code) .
Some user have different ratios in mind, thus I add input to allow user to change those ratios.
█ CREDITS
Scott M Carney, Trading Volume 3: Reaction vs. Reversal
█ CREDITS
1. List Harmonic Patterns.
2. Font size small for mobile app and font size normal for desktop.
3. Font color does automatically change follow dark / light chart theme.
4. Inputs to change ratio values.
█ USAGE / EXAMPLES
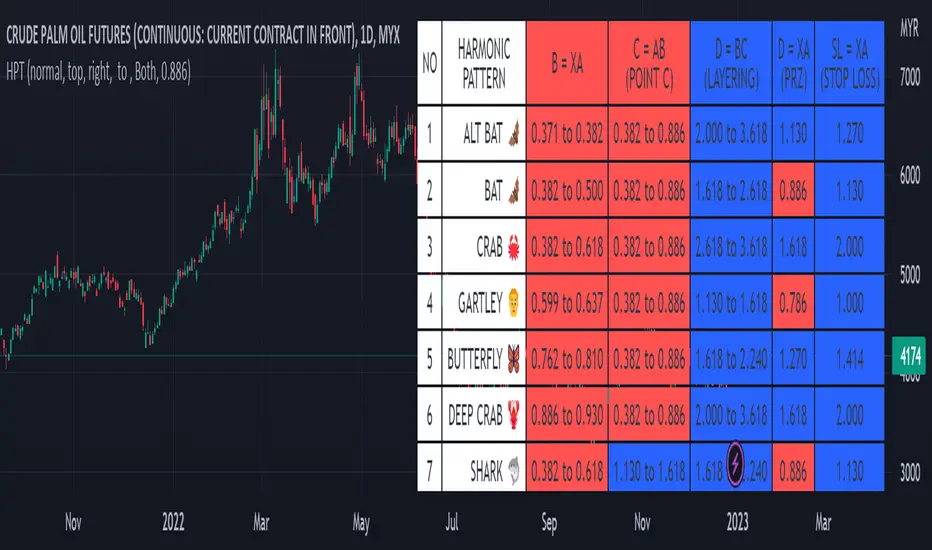
Harmonic Pattern Table UDT█ OVERVIEW
This table indicator was intended as helper / reference for using XABCD Pattern drawing tool.
The values shown in table was based on Harmonic Trading Volume 3: Reaction vs. Reversal written by Scott M Carney.
Code upgrade from Harmonic Pattern Table (Source Code) and based on latest User-Defined Type (UDT) .
As a result, code appeared more cleaner.
█ FEATURES
1. List Harmonic Patterns.
2. Font size small for mobile app and font size normal for desktop.
3. Options to show Animal name in text, emoji or both.
█ USAGE
Similar to Harmonic Pattern Table (Source Code).
█ CREDITS
Scott M Carney, Trading Volume 3: Reaction vs. Reversal
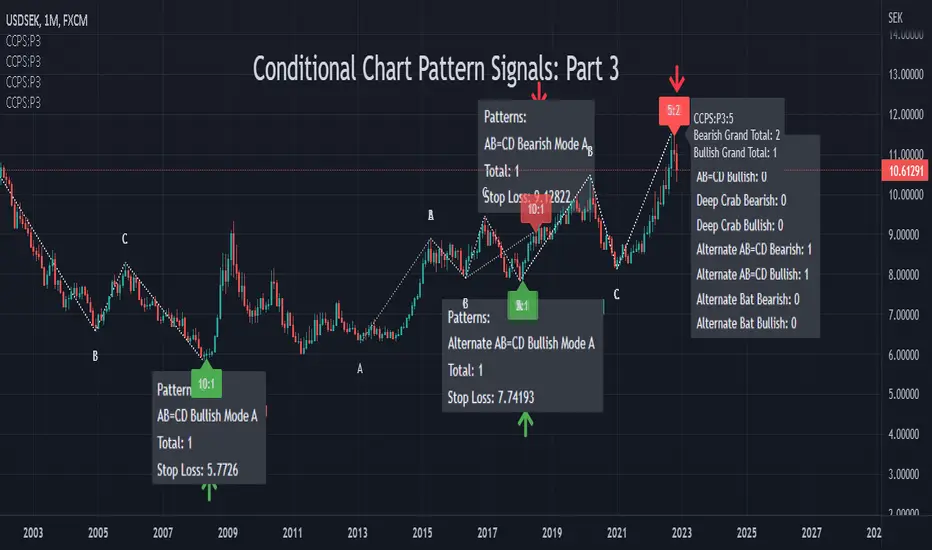
Conditional Chart Pattern Signals: Part 3CCPS uses exclusive method to finalize pivot points and has more options to refine chart patterns.
Pattern List:
• AB=CD Bearish
• AB=CD Bullish
• Deep Crab Bearish
• Deep Crab Bullish
• Alternate AB=CD Bearish
• Alternate AB=CD Bullish
• Alternate Bat Bearish
• Alternate Bat Bullish
Label Tooltip: Show more information of the signal.
Volume: Random/Up/Down is determined by linear regression. Show pattern if volume trend is not required/up/down.
Percentile %: Intraday: 60 (active). Day and above: set at your preference. Range 0-100. A value of 0 means that no filter is applied and all patterns satisfy the condition. A value of 100 means that no pattern satisfies the condition.
Confirm Time: 1-3 candles.
Candle: Random/Bullish/Bearish.
Specification:
tinyurl.com
Usage:
Enter at the open of the next bar after the signal or right when the signal appears (depending on your very own evaluation of the market at that time as sometimes price could reach targets within one bar). Adding caution, a little bit of experience will be needed to recognize if price actually reacts and follows the signals generated by CCPS.
Stop-loss suggested by the signal is generated as a quick analysis. In general, you need to place the stop-loss higher or have your own deeper analysis to have it. Take profit based on your preference of risk and/or other indicators of target/support/resistance.
Other Features:
• Non-repainting: show honest signals on the realtime bar, not on historical bars.
• Compact design.
• Support alerts.
Markets: All (Not designed and developed for a specific market). Test on: forex, index, commodity.
Timeframes: All (Not designed and developed for a specific timeframe). Test on: 30m, 1D, 1W, 1M.
Remark:
• Reversal patterns do not have magic. Indeed, they belong to counter-trend strategy and technical analysis of high-probability (potential) reversal zone. In case of more powerful fundamental factors, a trend could continue and break reversal patterns.
• We have tried to integrate multiple base periods in the indicator but the execution time limitation for one indicator does not allow us to do so. As a result, users need to manually add the indicator multiple times with different base periods in order to find more patterns. Some common base periods are 5, 10, 15 and 20. In the future, if the platform lifts the limitation, we will have a version in which the indicator would automatically scan different base periods for users.
• Because compiled script code limit is 65000, the indicator is separated into different parts. Each part contains different patterns and could be considered as an independent detector.
Harmonic Pattern Educational Volume 2 (Source Code)This indicator was intended as educational purpose only for Harmonic Patterns using XABCD Pattern Tool.
This indicator was build upon Harmonic Trading : Volume Two, which was continuation from Harmonic Trading : Volume One and The Harmonic Trader, written by Scott M Carney.
Explaination was similar to previous build, build 0 and build 1 .
Volume 2 introduce Harmonic Ratio Progression, which result new patterns such as 5-0 and Alternate Bat.
Indikator ini bertujuan sebagai pendidikan sahaja untuk Harmonic Pattern menggunakan XABCD Pattern Tool.
Indikator ini dibina berdasarkan buku Harmonic Trading : Volume Two, juga sambungan daripada Harmonic Trading : Volume One and The Harmonic Trader, ditulis oleh Scott M Carney.
Penerangan yang sama berdasarkan binaan lepas, build 0 and build 1 .
Volume 2 memperkenalkan Harmonic Ratio Progression, membolehkan pattern baru seperti 5-0 dan Alternate Bat.
Indicator features :
1. List XAB=CD patterns including ratio and reference page.
2. For desktop display only, not for mobile.
Kemampuan indikator :
1. Senarai XAB=CD pattern termasuk ratio and rujukan muka surat.
2. Untuk paparan desktop sahaja, bukan untuk mobile.
FAQ
1. Credits / Kredit
Scott M Carney, Harmonic Trading : Volume One
2. Pattern and Chapter involved / Pattern dan Bab terlibat
Bullish 5-0 - Page 79
Bearish 5-0 - Page 88
Bullish Alternate Bat - Page 103
Bearish Alternate Bat - Page 106
3. Code Usage / Penggunaan Kod
Free to use for personal usage but credits are most welcomed especially for credits to Scott M Carney.
Bebas untuk kegunaan peribadi tetapi kredit adalah amat dialu-alukan terutamanya kredit kepada Scott M Carney.
5-0
Alternate Bat

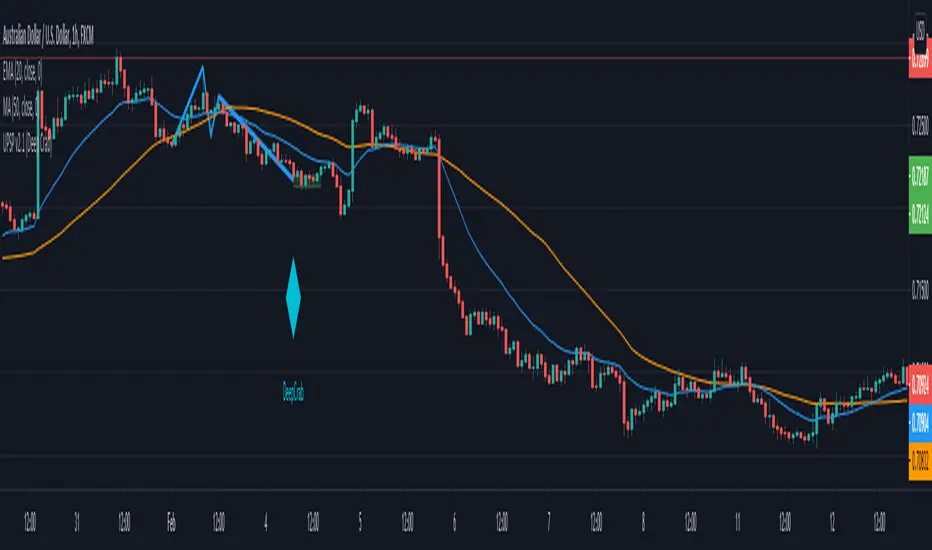
Ultimate Pattern Scanner ProChart Patterns and Harmonic Patterns using just ONE indicator!
This is a automatic scanner for well know patterns like Head and Shoulder to get started. I'm planning to add more patterns in the near future. It works as follows:
1. Is going to plot the pattern on the chart, lines in blue
2. Is going to show you when the pattern has finished to form, triangles and diamonds
3. It is possible to get an alert when the pattern has form
For example: is going to give a possible entry when the price has broken the trend line of the two shoulders if we take the Head and Shoulder pattern as an example.
Please let me know in the comments if you would like to have more patterns.
======================================================
This versions supports:
1. Head And Shoulder Pattern
- Show possible entries when the trend formed by the shoulders has been broken
2. Bat Harmonic Pattern
- Show Possible Reversals Zones in green or red boxes
- Alerts when any pattern has form
======================================================
======================================================
Next Versions:
- All the harmonic patterns
- Triangles
- Elliot Waves impulses
- Double Top and Bottom
- Triple top and bottom
- Rising and Falling Wedge
- The cup and the handle, etc
- ABCD pattern
Let me know in the comments if you are interested in something like this so I CAN GIVE YOU ACCESS. I'll appreciate your feedback.
thanks

Ultimate Pattern ScannerThis is a automatic scanner for well know patterns like Head and Shoulder to get started. I'm planning to add more patterns in the near future. It works as follows:
1. Is going to plot the pattern on the chart, lines in blue
2. Is going to show you the long entry or short entry bar, red or green triangles
3. It is possible to get an alert when there is a potential long or short entry depending on the pattern
For example: is going to give a possible entry when the price has broken the trend line of the two shoulders if we take the Head and Shoulder pattern as an example.
Please let me know in the comments if you would like to have more patterns.
======================================================
I have planned the release of a pro version with all the well know patterns for invite only users. Patterns like:
- All the harmonic patterns
- Triangles
- Elliot Waves impulses
- Double Top and Bottom
- Triple top and bottom
- Rising and Falling Wedge
- The cup and the handle, etc
- ABCD pattern
Let me know in the comments if you would be interested in something like this please. I'll appreciate your feedback.
thanks!
BatPattern_ULTRA V1 - draws Bat Pattern inclusive alertsHI BIG PLAYERS AROUND THE WORLD,
this script allow to draw automatically lines of Bat Pattern . The Bat Pattern is part of Harmonic Pattern .
Parallel to the automatic drawing, the indicator can give signals as soon as the typically Fibonacci extension immediately reached or has been reached. This allows the indicator BatPattern_ULTRA V1 to give early signals. In the default settings, the signals are displayed with a blue background on the chart.
BatPattern_ULTRA V1 is offered for sale. More information can be found below in the signature.
However, anyone can test this indicator for once without any registration in a 3 day trial. You can request access with a simple message to me.
Another trial of 7 days is included in the offer on my website - before the first payment will done.
In the settings it is possible to change the degree of details. This is sometimes necessary because TradingView limited only 55 lines per indicator in Pinescript Version 4.
In extreme cases it is therefore possible to change the settings that the Bat Pattern represent waves only with 2 lines. This allows the indicator to detect far more Bat Pattern on the same chart.
For more great indicators everyone is invited to follow me on TradingView.
Kind regards
NXT2017
