GEMA-Indicador por Neil-------------------
DESCRIPTION
GEMA-INDICATOR is a indicator based on SMA, EMA, WMA, RMA that considers elements such as ADX, DMI, RSI, stochastic, Stoploss, Takeprofit, angles and values at present point.
HOW DOES IT WORK
The component works as an assistant to which you configure the previous elements and you see the performance that it offers you, in such a way that you pass that configuration to GEMA-INDICATOR so that you can receive alerts and do visual trading with notifications or automated trading by sending messages to platforms like 3Commas.
WHY USE IT
The resource operates with one of the most important strategies in the market, which is the price tracking line, which means that if prices go up, we follow it, if prices go down, we follow it; in this way you do not need to make large investments as is often the case with pure BOTs, which require large reserves for security orders.
HOW TO USE IT
Press the "Indicators" option, go to the "Public Library" segment, write the name "GEMA-Indicador por Neil", double click on the record in question and you will have it added in your work panel, now, it only remains to use it and configure its parameters.
-------------------
DESCRIPCIÓN
GEMA-INDICADOR en un indicador basado en SMA, EMA, WMA, RMA que considera elementos como ADX, DMI, RSI, Estocastico, Stoploss, Takeprofit, ángulos y valores a punto presente.
COMO FUNCIONA
El componente funciona como un asistente al que vas configurando lo elementos anteriores y vas viendo el rendimiento que te ofrece, de manera tal, que pases esa configuración a GEMA-INDICADOR para que puedas recibir alertas y hagas trading visual con notificaciones o trading automatizado enviando mensajes a plataformas como 3Commas.
POR QUÉ USARLO
El recurso opera con una de las estrategias mas importantes del mercado, que es la linea de seguimiento de precio, lo que significa que si los precios suben, lo seguimos, si los precios bajan, lo seguimos; de esta manera no necesita realizar grandes inversiones como suele ocurrir con los BOT puros, que exigen grandes reservas para las ordenes de seguridad.
COMO USARLO
Presione la opción "Indicadores", ubíquese en el segmento "Libreria Publica", escriba el nombre "GEMA-Indicador por Neil", haga doble clic sobre el registro en cuestión y lo tendrá agregado en su panel de trabajo, ahora, solo resta usarlo y configurar sus paramertos.
Wskaźnik ruchu kierunkowego (ADX)

MTF RDX++ [@TradersVenue]This is multi timeframe RSI indicator which displays RSI value of 15/25/75/125/D/W/M timeframes in single window.
One can select or deselect individual RSI"s, choose RSI length of default RSI, length of slow/fast RSI.
Current RSI indicator considers below scenarios to be bullish 1) RSI > iRSILongLvl 2) Smaller TF RSI > Larger TF RSI
Current RSI indicator considers below scenarios to be bearish 1) RSI < iRSILongLvl 2) Smaller TF RSI < Larger TF RSI
Background of the indicator turns green when RSI trades above iRSILongLvl, turns red when RSI trades below iRSISellLvl else orage
If SlowRSI > SlowRSI then it indicates EMA(RSI(14), LEN) is in a upward slope i.e. its bullish
Along with RSI it displayes ADX as well. So one may go through the settings and enable or disable display of DI and ADX lines.
Few UI/UX customizations in chart, like changing line width, transparency, BG Color is provisioned for enhanced viewability
Trend and momentum score is calculated using RSI/ADX/MA/Volume/VWAP and then trend strength. Score >1 bullish. Score<1 bearish
BTST/STBT signals added in the indicator for overnight brokenwing straddles. Details will be explained during webinar.

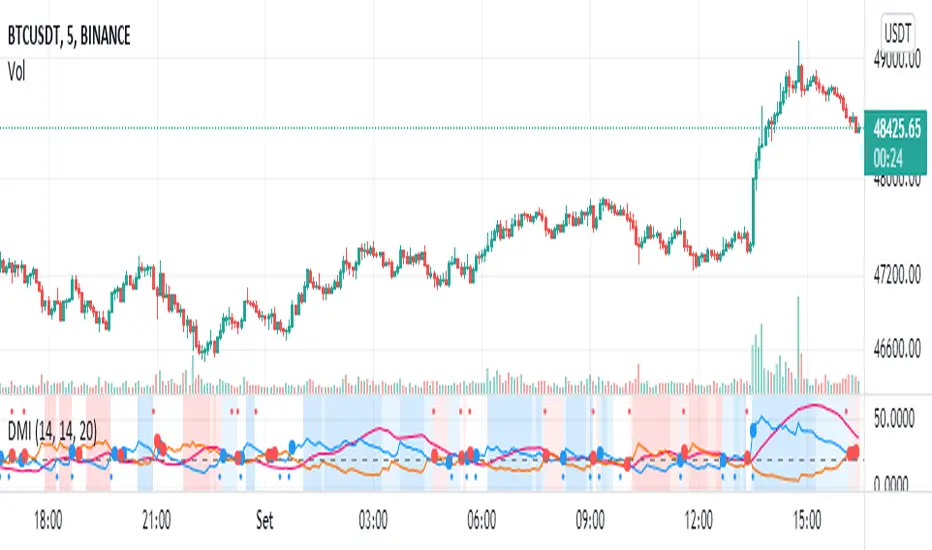
DMI Trade Zone [Alorse]Through the DMI Trade Zone you can find safe areas to trade in the Spot market.
The logic behind the indicator is:
- If the Positive Directional Movement (+DI) is greater than the Negative Directional Movement (-DI) then the Average Directional Movement Index (ADX) will be green with an opaque white background.
- If the Positive Directional Movement (+DI) is less than the Negative Directional Movement (-DI) then the Average Directional Movement Index (ADX) will be red.

Trading Range FinderWhat is it?
This indicator is a visual representation of the ADX indicator that shows where the areas of weak trends are. Anything shaded in a gray background implicates that the chosen market is experiencing a weak trend.
These areas of weak trends are seen typically when ADX drops below 20-25 but this script is customizable to change where you want that threshold.
Why did I make it?
I made this indicator to be used in combination with other trading indicators to eventually be used to identify when a market is range-bound/sideways.
Since momentum-based indicators can be "thrown off" in sideways market conditions, I will be using this visual indicator to identify when it is best to filter out a trade signal in a momentum-based strategy.

DMI - VisualBasically, when the background is:
White = no defined direction
Light blue = up.
Dark blue = well defined up
Light red = down
Dark red = well defined down
Blue/red centered circle = change of direction
Red circle on top = possible short entry
Blue circle at the bottom = possible long entry
//Português
Basicamente, quando o fundo é:
Branco = sem direção definida
Azul claro = alta
Azul escuro = alta bem definida
Vermelho claro = baixa
Vermelho escuro = baixa bem definida
Círculo azul/vermelho centrado = mudança da direção
Círculo vermelho no topo = possível entrada de short
Círculo azul na parte inferior = possível entrada de long
Pumpkin Soup MACD Profit CandlesMACD-based Relative Stock Price Candle
It was a mixture of MACD and a combined centered oscillator, indicating relative stock bar movement.
It moves approximately between 200 and -200, adding a divergence.
In addition to Hidden Diversions and Normal Diversions, I added the Long Short Diversions and the Preview Diversions that I analyzed.
It would be convenient if you think of it as a mix of general stochastic and MACD.
/////
MACD 기반 상대 주가봉 캔들
MACD와 종합 센터드 오실레이터의 혼합형으로 상대적인 주가봉 움직임을 나타내었습니다.
대략적으로 200 ~ -200 구간에서 움직이며, 다이버전스를 넣었습니다.
히든 다이버전스, 일반 다이버전스 외 제가 분석한 롱 숏 다이버전스와 예고 다이버전스도 첨가하였습니다.
일반적인 스톡캐스틱와 MACD의 혼합형이라고 생각하시면 편하실듯합니다.

ADX MULTICOLOR
ENGLISH:
ADX (AVERAGE DIRECTIONAL INDEX):
It is a non-directional oscillator type indicator, that is, it quantifies the strength of a trend regardless of its direction. In Spanish ADX means index of average direction. It is common to use it together with directional indicators of movement such as the (Squeeze Momentum Indicator), which show us the direction or predominant trend of the market.
HOW TO USE THE ADX INDICATOR
When the ADX is greater than 30, the market is in a strong trend, when it is between 23 and 30 it is not well defined and when it is less than 23 it indicates that the market is in range.
QUANTIFYING THE STRENGTH OF TREND:
ADX values help traders identify the strongest and most profitable trends to trade. Values are also important to distinguish between trending and non-trending conditions. Many traders will use ADX readings above 23 to suggest that the trend is strong enough for trend trading strategies. Conversely, when the ADX is below 23, many will avoid trending trading strategies.
ADX value Trend strength
0-23 Trend absent or weak
23-30 Strong trend
30-75 Very strong trend
75-100 Extremely strong trend
+ DI: (Green Color)
The + DI (Positive Directional Indicator) would be the indicator of positive direction and it would be showing us that the movements are trending upward.
-DI: (Red Color)
The –DI (Negative Directionl Indicator) would be the indicator of negative direction and it would be showing us that the movements have a downward trend.
IMPROVEMENTS IN THE DEVELOPMENT OF THE OSCILLATOR:
It is known that the ADX as a whole is composed of three lines, the first is the ADX itself, which measures the strength of the trend, when it has upward directionality, it means that there is strength in the movement.
The other two lines named (+ DI and -DI) mark if the force is bearish, bullish or, failing that, neutral.
When the + DI is above the -DI, it speaks of Bullish force. On the contrary, when these lines are reversed, we would be in the presence of a bearish force.
On the other hand, when the ADX is below the 23 point, it is considered that there is no force in the movement.
FUSION OF ADX AND LOS (+ DI and -DI):
To simplify this vision, we have merged the three lines that we talked about at the beginning of this section, attributing the color resulting from the crosses of the (+ DI and -DI) to the ADX itself, resulting in a single line that has the color of the type of present force.
CANDLE COLOR:
To help the more inexperienced trader, we have activated a function that will paint the candles the color of the ADX, providing a visual aid to the trader using this indicator.
THE ADX HAS 5 COLORS:
• ADX: Dark Green (Bullish force).
• ADX: Light Green (Loss of bullish strength).
• ADX: Dark Red (Bearish Force).
• ADX: Light Red (Loss of bearish strength).
• ADX: Orange (Lost strength, Disinterest and low volume).
NOTE:
It is possible to activate the lines (+ DI and -DI) in the indicator if you want to use the indicator independently, however, it is recommended to combine this indicator with a directional oscillator, such as the Squeeze Momentum Indicator.
---------------------------------------------------------------------------------------------------------------------------------------------------------------------------------------------------------------------------------------------------
ESPAÑOL:
ADX (ÍNDICE DIRECCIONAL PROMEDIO):
Es un indicador de tipo oscilador no direccional, es decir, cuantifica la fuerza de una tendencia independientemente de su dirección. En español ADX significa índice de dirección media. Es común usarlo junto con indicadores direccionales de movimiento como el (Squeeze Momentum Indicator), que nos muestran la dirección o tendencia predominante del mercado.
CÓMO USAR EL INDICADOR ADX
Cuando el ADX es mayor a 30, el mercado está en fuerte tendencia, cuando está entre 23 y 30 no está bien definido y cuando es menor a 23 indica que el mercado está en rango.
CUANTIFICACIÓN DE LA FUERZA DE LA TENDENCIA:
Los valores de ADX ayudan a los operadores a identificar las tendencias más fuertes y rentables para operar. Los valores también son importantes para distinguir entre condiciones con tendencia y sin tendencia. Muchos operadores utilizarán lecturas de ADX por encima de 23 para sugerir que la tendencia es lo suficientemente fuerte para las estrategias de negociación de tendencias. Por el contrario, cuando el ADX está por debajo de 23, muchos evitarán las estrategias comerciales de tendencia.
Valor ADX Fuerza de la tendencia
0-23 Tendencia ausente o débil
23-30 Fuerte tendencia
30-75 Tendencia muy fuerte
75-100 Tendencia extremadamente fuerte
+ DI: (Color verde)
El + DI (indicador direccional positivo) sería el indicador de dirección positiva y nos estaría mostrando que los movimientos tienen una tendencia alcista.
-DI: (Color rojo)
El –DI (indicador de dirección negativa) sería el indicador de dirección negativa y nos estaría mostrando que los movimientos tienen una tendencia a la baja.
MEJORAS EN EL DESARROLLO DEL OSCILADOR:
Se sabe que el ADX en su conjunto está compuesto por tres líneas, la primera es el propio ADX, que mide la fuerza de la tendencia, cuando tiene direccionalidad ascendente, significa que hay fuerza en el movimiento.
Las otras dos líneas denominadas (+ DI y -DI) marcan si la fuerza es bajista, alcista o, en su defecto, neutral.
Cuando el + DI está por encima del -DI, habla de fuerza alcista. Por el contrario, cuando estas líneas se invierten, estaríamos en presencia de una fuerza bajista.
Por otro lado, cuando el ADX está por debajo del punto 23, se considera que no hay fuerza en el movimiento.
FUSIÓN DE ADX Y LOS (+ DI y -DI):
Para simplificar esta visión, hemos fusionado las tres líneas de las que hablamos al principio de esta sección, atribuyendo el color resultante de los cruces de (+ DI y -DI) al propio ADX, dando como resultado una sola línea que tiene el color del tipo de fuerza presente.
COLOR DE VELAS:
Para ayudar al trader más inexperto, hemos activado una función que pintará las velas del color del ADX, proporcionando una ayuda visual al trader que usa este indicador.
EL ADX TIENE 5 COLORES:
• ADX: Verde oscuro (fuerza alcista).
• ADX: Verde Claro (Pérdida de fuerza alcista).
• ADX: rojo oscuro (fuerza bajista).
• ADX: Light Red (Pérdida de fuerza bajista).
• ADX: Naranja (Pérdida de fuerza, Desinterés y bajo volumen).
NOTA:
Es posible activar las líneas (+ DI y -DI) en el indicador si desea utilizar el indicador de forma independiente, sin embargo, se recomienda combinar este indicador con un oscilador direccional, como el Squeeze Momentum Indicator.

Confluence TradingThis indicator makes use of the Kumo Cloud, 3EMA and ADX/DI+/DI- indicators. While these can be used separately (green bars show where to long and red bars show where to short), this indicator also shows how their use together can create a more precise estimate on when to enter and exit the market. It is interesting to note that while each of the three indicators individually can predict movements and trend reversals early, having their signals converge into one makes a slower prediction but also a more accurate one. It is a great visual representation of why combining multiple trading techniques or analysis increases odds of winning trades (confluence trading). Do feel free to message me if you wish for me to add any other indicator to the mix or to fix any bugs. The ADX indicator makes use of robertkowalski's code.

DCA_PREMIUMOur new indicator tracks trends to create buy and sell alerts, see below how it works.
HOW IT WORKS:
It uses RMA which is the same moving average used by RSI and HMA, they intersect give us an entry signal, be it a buy or sell, as the entry signal the script will color the bars according to the signal.
When a GREEN candle appears, it indicates a large purchase volume and when a PURPLE candle appears, it indicates a large sales volume.
The indicator will alert for entries only according to the trend of the traded asset
FOR EXAMPLE:
I am trading USDJPY in an uptrend, the indicator will only alert me for buy entries, if it applies to downtrend.
DASHBOARD:
Our dashboard indicates the volatility of the traded asset, the short-term trend and the trade signal.
HOW TO USE:
Choose the asset you want to trade and, in the settings, change the time period you want for your trading style, for example: Swing Trade, Day Trade or Position.
See regions with large trading volumes indicating price manipulation or just supports and resistances too strong to break.

Natural Directional Combo [CC]The Natural Directional Combo was created by Jim Sloman as part of his Ocean theory series and I believe this is his final unique formula that I'm publishing to make them all open source. If you know of any others then please send me a message. He passed away at a young age and I want to make sure his legacy lives on. Big thanks to @altcoinz and @tmac87 for giving me his full source code and materials in order to publish everything. So like my Natural Market Combo script, this essentially take his Natural Stochastic Indicator and his Natural Directional Index to create his own average of both indicators. Like the market combo indicator, I created a fix to address the errors in his original script and included both strong and normal buy and sell signals. Strong signals are darker in color and normal signals are lighter in color. Buy when the line turns green and sell when it turns red.
Let me know if there are any other scripts you would like to see me publish!

Natural Directional Index [CC]The Natural Directional Index was created by Jim Sloman and this is another indicator that I'm publishing from the collection of Ocean indicators. I want to make sure his legacy is covered by as many eyes as possible. This is his version of the directional index indicator but he uses his weighting method to use the square root of time and you can see that the signals are very smooth. Big thanks of course to @altcoinz and @tmac87 for helping me get the full source code and files for all of his work. This indicator captures the current trend and I have used my strong buy and sell signals to let you know the strength of the current trend. Darker colors are for strong signals and lighter colors are for normal ones. Buy when the line turns green and sell when it turns red.
Let me know if there are any other indicators you would like to see me publish!

SADX+DI - Smoothed Average Directional Index by CrypTauxThis script is based on ADX/DI and I use it to enter when trend is in early stage, then ride it & exit at the right time (that's the theory)
ADX is shown as histogram :
- light silver bars = price is under thresold but still no trend, be patient.
- strong gray bars = prepare to enter the trade soon
- blue bars = price momentum so ride the trend
- yellow bars = do not trade (price reverts or consolidates)
Background color/bottom area based on DI+/DI- :
- green = uptrend
- red = downtrend
Top pink triangles appears when ADX is relatively low based on "lookback" history (not based on previous static threshold) so a new trend may happens so stay alerts.
- Prepare for enter when bars turn dark gray and/or pink triangles appears.
- Enter position as soon as you see blue bar (Long or Short as indicated by the area color)
- and Exit on first yellow bar.
Quite simple, works on multiple HTF/LTF and might be used with graphical analysis to find best opportunities.
Enjoy :)
--
Version 35.
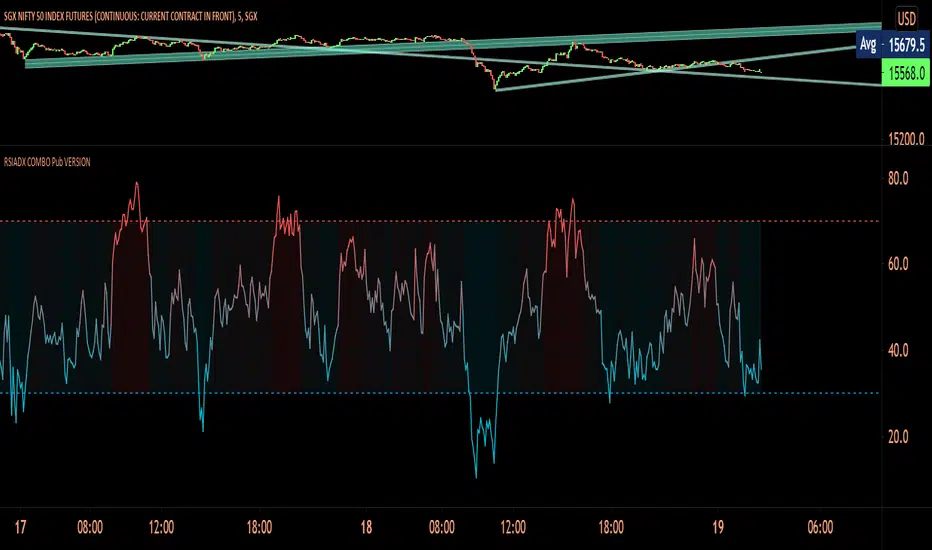
RSIADX COMBO Pub VERSIONIts a combination of RSI and ADX for better trend direction . Along with Atr is included as 2nd confirmation of trend , RSiADX with bullish and bearish zones along with HMA and EMA and Divergence for trend trading. Support and Resistance is too added which you can hide according to your need .
Entry rules :
Look for OB(+10) and OS (-10)area along with hma crossover or crossunder of support and resistance .. !
----------------
Disclaimer
Copyright by FaizanNawazz.
The information contained in my scripts/indicators/strategies/ideas does not constitute financial advice or a solicitation to buy or sell any securities of any type. I will not accept liability for any loss or damage, including without limitation any loss of profit, which may arise directly or indirectly from the use of or reliance on such information.
All investments involve risk, and the past performance of a security, industry, sector, market, financial product, trading strategy, or individual’s trading does not guarantee future results or returns. Investors are fully responsible for any investment decisions they make. Such decisions should be based solely on an evaluation of their financial circumstances, investment objectives, risk tolerance, and liquidity needs.
My scripts/indicators are only for educational purposes!
Happy Trading!
ADX Triple - Average Directional Movement Index - TradingEDThis case study is based on a previous ADX + DM study, but with three different counts to compare different trends. The use of this indicator is restricted to private use, and it can be used only by invitation. Different functionalities have been added to the original code, such as alerts and signals that seek to make trading much easier to interpret by any type of trading operator of any experience level, from beginner to intermediate and advanced.
Key components of the original indicator:
• The DIRECTIONAL MOVEMENT INDEX (DMI) is a technical indicator that measures both the strength and direction of a price movement and is intended to reduce false signals.
• The DMI uses two standard indicators, one negative (-DI) and one positive (+DI), in conjunction with a third, the AVERAGE DIRECTIONAL INDEX (ADX), which is non-directional but shows momentum.
• The larger the spread between the two primary lines, the stronger the price trend. If +DI is way above -DI the price trend is strongly up. If -DI is way above +DI then the price trend is strongly down.
• ADX measures the strength of the trend, either up or down; a reading above 20 indicates a strong trend.
ADX is plotted as a single line with values ranging from a low of zero to a high of 100. ADX is non-directional; it registers trend strength whether price is trending up or down. The indicator is usually plotted in the same window as the two DMI lines, from which ADX is derived. When +DI is above -DI , there is more upward pressure than downward pressure in the price. Conversely, if -DI is above +DI , then there is more downward pressure on the price. This indicator may help traders assess the trend direction. Crossovers between the lines are also sometimes used as trade signals to buy or sell, theay are the main trade signals. A long trade is taken when the +DI crosses above the -DI and an uptrend could be underway. Meanwhile, a sell signal occurs when the +DI instead crosses below the -DI .
Main functions of this modified indicator:
1) You can select the type of MOVING AVERAGE , among many available options (SMA, EMA, DEMA, HMA, etc.)
2) The SOURCE for the counts can be determined by the trader (close, open, etc).
3) The MEASURE can be based on a CANDLES count if you are trading OHLC Charts from 1D onwards , or if your trading is intraday, you can also select counts by MINUTES , HOURS or DAYS , depending on your trading style.
4) LENGTH , by default it will be loaded as in the STRATEGY , but considering the previous point, you can modify it according to your convenience.
5) You have the option to hide or show a LABEL at the top of the chart, with respect to the signals: BULLISH green, BEARISH red.
Main performance functions of this modified indicator:
I) In the case of the PERFORMANCE that appears at the right of the chart, you have the option to adjust the WIDTH of each box.
II) The TEXT of the PERFORMANCE is not modifiable, but you can customize the default color. *
III) The BACKGROUND of the PERFORMANCE , you can customize the default color. *
IV) You have the option to hide or show a PERFORMANCE that appears at the right of the chart.
Main functions to customize the style of this indicator:
a) You can select the color for ADX and for DMI , with the colors that best suit you.
b) The CROSSOVER/CROSSUNDER signal between DI+ and DI- can also be customized. *
c) For any type of SIGNAL , it is painted as a VERTICAL LINE in the graph, you can change the color that comes by default. *
d) In the case of the LABELS that appear at the top, the text is not modifiable, but you can customize both the type of label and change the default color. *
e) You can select the colors for the BACKGROUND of the indicator according to the trend, whether it is BEARISH or BULLISH , with the colors that best suit you. *
* By default, they are marked as red for downtrends and green for uptrends.

KINSKI ADXThis ADX indicator (Average Directional Index) tries to estimate the strength of a trend. The Average Directional Index is derived from the positive (+DI) and the negative directional indicator (-DI). The direction of movement is determined by comparing the highs and lows of the current and past periods.
As soon as the indicator determines a trend strength for upward or downward trend, a label is displayed. An upward trend is labelled "Bullish Trend". The downward trend bears the label "Bearish Trend".
The clouds in the background represent the movements of the Average Directional Index High/Low:
Color orange: neutral, uncertain in which direction it is going.
Color green: upward trend
Color red: downward trend
The line represents the average value of the ADX signal:
Color orange: neutral: still uncertain in which direction it is going
Color green / outgoing line: upward trend
Color green / descending line: weakening upward trend
Color red / exiting line: downward trend
Color red / descending line: weakening downward trend
The following configurable options are possible:
"ADX Smoothing
Directional Index Length
Level Range
Level Trend

Tradelivio's Ranging vs Trending Indicator ADXThis indicator is based on ADX and helps identify if a market is ranging/consolidating or trending.
Default setting are as follows:
0-15 Absent Trend
15-25 Weak Trend
25+ Strong Trend
FYI:
50-75 Very Strong Trend
75-100 Extremely Strong Trend
You can configure 3 levels of strength (Absent, Weak & Strong)
Please keep in mind that a falling ADX line only means that the trend strength is weakening, and it usually does not mean the trend is reversing, unless there has been a price climax.

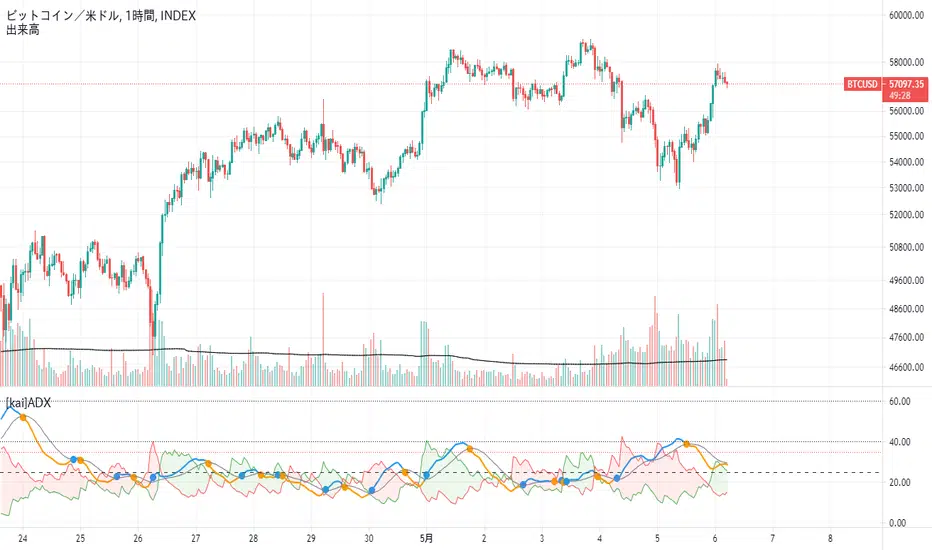
[kai]ADXIt is an indicator that makes it easy to understand the change of ADX by adding a moving average to the famous indicator ADX.
Since ADX and DI have a part where the calculation formula of DI + and DI- is fixed to one bar, there was a problem that it does not make much sense to increase the length.
The biggest feature of this indicator is that it allows you to calculate multiple bars by increasing the multipler option.
For example, by setting multipler = 4 in the 1-hour time frame, it is possible to resemble the calculation result of the 4-hour bar in a multi-time frame.
How to use this Inge is the same as how to use ADX and DI
When ADX (orange) GX (blue circle), take a position in the direction of DI (green zone, red zone),
I think the payment is good when ADX (blue) is DX (orange circle)
when DI +(green), DI-(red) is 35 or more, contrarian is dangerous.
有名なインジケーターのADXに移動平均を付けてADXの変化をわかりやすくしたインジケーターです
ADXとDIはDI+,DI-の計算式がバー一本固定の部分があるので、lengthを増やしてもあまり意味がない問題がありました
このインジではmultiplerオプションを増やすことによって、複数のバーを計算できるようにしたのが最大の特徴になります
例えば1時間足でmultipler=4にすることでかなりマルチタイムフレームの4時間足の計算結果に似せることができます
このインジの使い方は、ADX、DIの使い方と同じです
ADX(オレンジ)がGX(青丸)した時にDI(緑塗り、赤塗り)の方向にポジションを取って、
ADX(青)がDX(オレンジ丸)した時に、決済がよいと思います
DI+(緑),DI-(赤)が35以上の時に逆張りは危険です
fDMI Binance Leveraged Tokensthis scans 20 tickers for my low dm indication. Telegram alerting included, and It is configured with all Binance leveraged tokens by default. For my shitcoining moonbros on CZ ;)

Directional Movement Index and ADXDMI (ADX) consists of three indicators that measure a trend’s strength and direction. Three lines compose the Direction Movement Index (DMI): ADX (white/gray line), DI+ (green line), and DI- (orange line). The Average Directional Index (ADX) line shows the strength of the trend. The higher the ADX value, the stronger the trend. The ADX line is white when it has a positive slope, otherwise it is gray.
The Plus Direction Indicator (DI+) and Minus Direction Indicator (DI-) show the current price direction. When the DI+ is above DI-, the current price momentum is up. When the DI- is above DI+, the current price momentum is down.
Trend detection: When the background has a bluish color there is an upward trend, and when the background has a reddish color there is a downward trend.
Includes an information panel that shows the current value and trend of some well-known indicators.

FUERSTUses Normalized Price Oscillator and Stochastics and combines them as an ADX weighted measure.
During low trend intensity Stochastics gets higher weighted than Price Oscillator, and vice-versa in times of high trend-intensity.

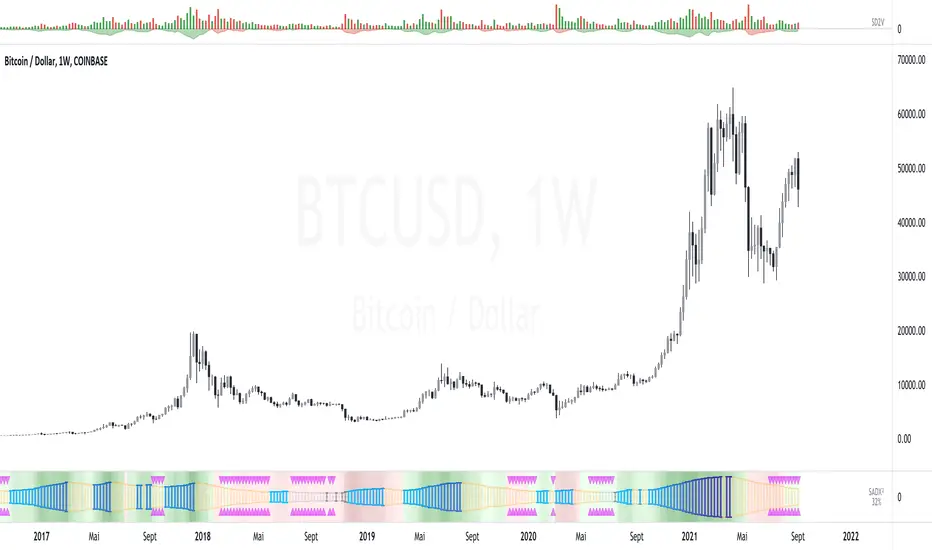
RedK Trader Pressure Index (TPX v1.0) Quick Summary
---------------------
The RedK Trader Pressure Index (REDK_TPX) analyzes the changes in price bars to give the trader a clear visual insight that represents the ongoing fight between the bulls (buyers) and bears (sellers) in the market - to determine who is in control of the price action, which in turn can be helpful in a trader’s decision about how the price action may be unfolding, what type of trade and positions to take (or to close) and when is the ideal time to action.
How the TPX calculation works
---------------------------------------
The TPX uses a simple logic and that’s one of the things I like about it – there is no complex calculation or magic stuff - and the core idea makes sense to me, as well as being one of the ways I needed to analyze my price charts.
The underlying assumption is that the buyers and sellers are competing for control of the market at all time.
- if there’s more buyers than sellers in the market, and if the buyers’ (or bull) pressure is stronger (than the sellers’), they will be able pull the “price range” up – and that means that on the price chart we can expect to see an increase in value in both the “high” and the “low” of the next price bar.
- Similarly, if there’s more sellers than buyers in the market, and if the sellers’ (or bear) pressure is stronger (than the buyers’), they will be able push the “price range” down – on the price chart we can expect to see a decrease in value in both the “high” and the “low” of the next price bar.
So, we will use the change in high and low price, between 2 consecutive price bars, as a proxy for the bull and bear “pressures” – a (weighted) moving average of these “pressure” values are then calculated along with the “Net Pressure” – the final results are plotted.
The importance of the "Control Level"
-----------------------------------------------
As in similar price-action based indicators, there’s a certain threshold or “control level”, above which, the pressure becomes “dominant”
when the bull or bear pressure is above that threshold, they will dominate and control the price move – this level can be found around the 25 or 30. I have included the ability to plot and adjust that control level in the TPX’s settings – and I also show some examples in the chart above (weekly chart for MSFT)
The code is commented and the chart is annotated to explain how to “read” the TPX – and how to interpret the values on the price chart
Using the Trader Pressure Index (TPX) in trading
------------------------------------------------------------
TPX can be valuable in showing well-supported (up or down) price moves that may lead to a strong trend that we can ride (when the pressure value is above the control level) - see exampled above
TPX is also valuable in showing when there’s “lack of interest” from the buyers or the sellers (or both) – which is great in exploring chub or no-trade zones - so basically when to avoid trading.
As usual, it's always recommended to use these types of "price action insight" indicators in conjunction with other trend and momentum indicators (moving averages, MACD..etc), so the insight we gain from them can be properly placed within the broader "context" - and to receive additional confimtion signals to support the trading decision.
I will come back later to post something about how the TPX differs from my recently-posted Strength of Movement (SoM) because they wok completely differently but can be used together with great synergy – and also how the TPX compares to the classic DMI/ADX which uses a similar concept.
Please feel free to integrate in your trading – hope you find this useful - comments and feedback are always welcome

ADX Momentum cross + MacD + HH LL + Buy/Sell Signals and alerts Hello, This is the first indicator I have made and would like to contribute to the community.
This strategy came from trying to replicate a previous ADX Cross Indicator that I loved on MT4 which I used successfully on EUR/USD on high and low time frames. Through the process of trying to replicate it I failed, I decided to take what I had written so far and create my own ADX cross strategy using the combination of 3 ADX's, their lag. Then also using Higher highs and lower lows with the MacD to further filter the signals.
There are two buy and two sell conditions , the difference between these are just the order in which the ADX crossing determines the entry. The MacD and higher highs and lower lows are the same for filtering the signal.
You can change the look back for HH and LL look back range, along with the DI Length & ADX Smoothing for all ADX's. The lag used for either the buy or sell strategy with the Lag_Buy/Lag_Sell inputs. Lag_mid setting will affect all 4 conditions.
From testing and based on the ADX cross logic you should follow this structure when changing the inputs for:
DI Length: Lowest DI value (I.E. 1)
DI Lengtha: Middle DI value (I.E. 2)
DI Lengthb: Highest DI value (I.E. 3)
ADX Smoothing: Lowest Smoothing value (I.E. 1)
ADX Smoothinga: Middle Smoothing value (I.E. 2)
ADX Smoothingb: Highest Smoothing value (I.E. 3)
I tested this on the EUR/USD, but mainly I have been using it on BTC/USDT(binance) and BTC/USDT Perpetual futures(binance) with the 5 minute chart. I suggest playing around with the settings depending on the Symbol and timeframe you use because the default settings are what I last found to be optimal for my self on the 5min BTC/USDT Perpetual futures(binance) chart.
A good starting point I found when using the indicator on other charts is to use the below values:
DI Length: 7
DI Lengtha: 14
DI Lengthb: 21
ADX Smoothing: 7
ADX Smoothinga: 14
ADX Smoothingb: 21
If you have any questions, suggestions, or requests for this indicator feel free contact me. You can either comment on here or Message me
If you like this indicator please like and comment where you found it useful.

Stoch DMIStochastics applied to adjusted ADX to represent the trend direction. DM based sub-indicators added to hint the momentum and changes in the ADX.
