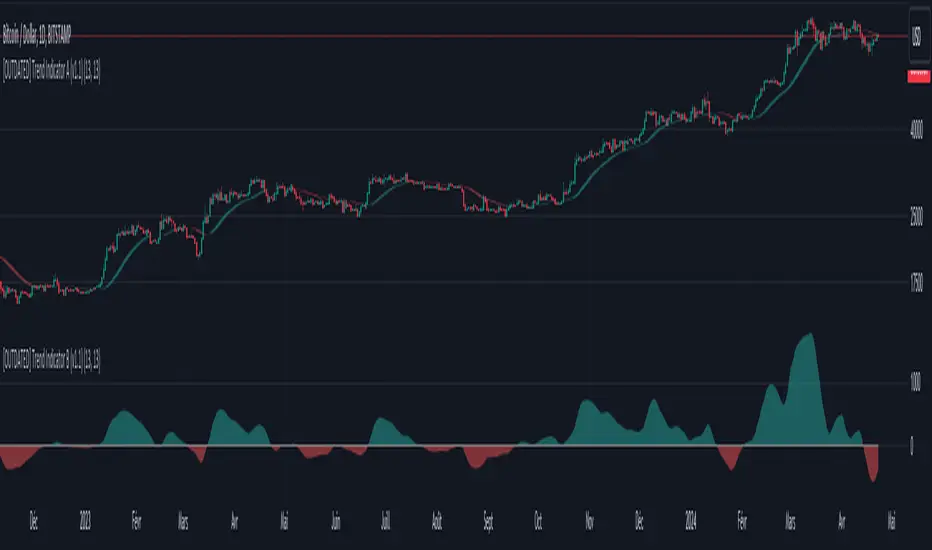
Dziwne Trend Indicator B (EMA + Heikin Ashi) V1Based on my own "Dziwne Trend Indicator A (EMA + Heikin Ashi cloud)" , I tweaked the original script to display and "measure" the overall trend.
Average
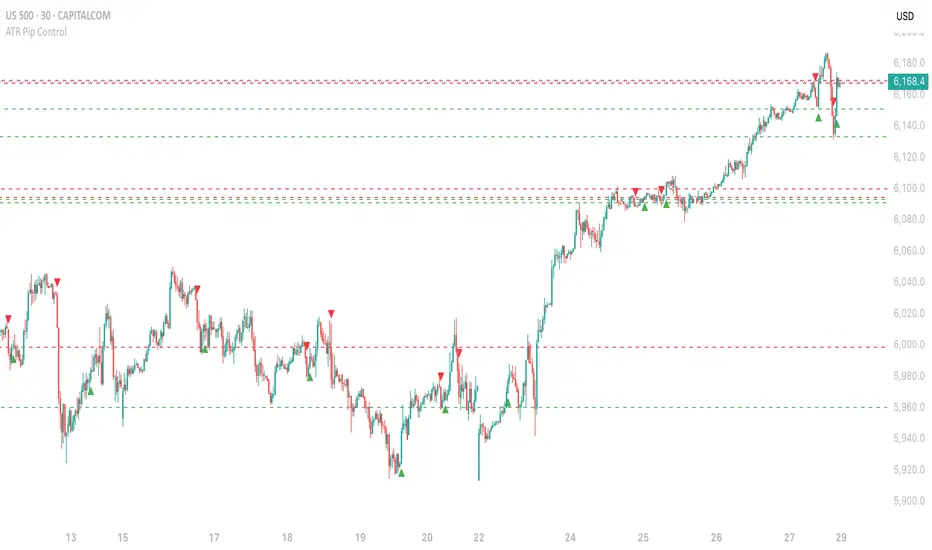
ATR Pip Control█ OVERVIEW
Here is a script based on the ATR but which unlike the traditional ATR using a Multiplier, here we use a signal filter by the Exchange of Prices
between Ticks. The more you increase the value, the more the parasitic signals will be filtered.
█ HOW TO INTERPRET?
• The signals are represented on the chart by "Buy" (Green) and "Sell" (Red) Labels.
• Pip Channel Control : Filters ATR Signals by the Exchange of Prices between Ticks. 0 = Disabled.
• Pip Length : Length of the Pip Channel. Depending on the Markets, the value can differ from 2 to 20 for Futures, Forex, CFD...
(But can go up to 5000 or more for Cryptos.) 0 = Disabled.
• Local High/Low : Local High/Low lines can be used as Stop Loss/Take Profit Zone.
• you have the option to display or not the Unconfirmed Signals on the Chart.
(They will also be displayed with "Buy" and "Sell" Labels but being transparent).
• The indicator works on all Timeframes and all types of markets.
• NO THE INDICATOR DOESN'T REPAINT.
█ ALERTS
Here is the list of Alerts available :
•ATR Buy (Unconfirmed)
•ATR Buy Condition!
•ATR Sell (Unconfirmed)
•ATR Sell Condition!
Please note that it is essential to always choose "Once per bar" (and NOT the "Once per bar close"!) option
whenever you want to place an Alert.
MA Cross Ribbon + [RSI,StochRSI,VolOsc,RoC,Compare,Info Panel]
Draws all sorts of useful information directly onto the Chart
Moving Average Ribbon with configurable offsets
Allows you to easily visualize MA Crossovers
Easy to view in the Data Window
RSI Indicator (Overbought, Oversold, Healthy)
Stochastic RSI
Volume Oscillator (Bullish, Bearish, Healthy)
Rate of Change Indicator
Compare Symbol without adding a new scale (Symbol, Timeframe, Divider)
Moving the chart around won't ruin your comparison
Allows you to see the general sentiment of all your configured averages at a glance
100% Configurable
If there is anything you would like added please comment, It's very likely I will be adding more things to this.

ATR - ATR from Low, ATR from High LabelsChecks what the average true range is for the X amount of trading days. Then will also label the ATR from the low, and the ATR from the high of the current day.
A second label can be created dependent on current days RVOL %. If RVOL is not 0 or 1, then it will create the second label. Otherwise it will just leave it as the standard label.
The calculation for second label is RVOL * ATR.

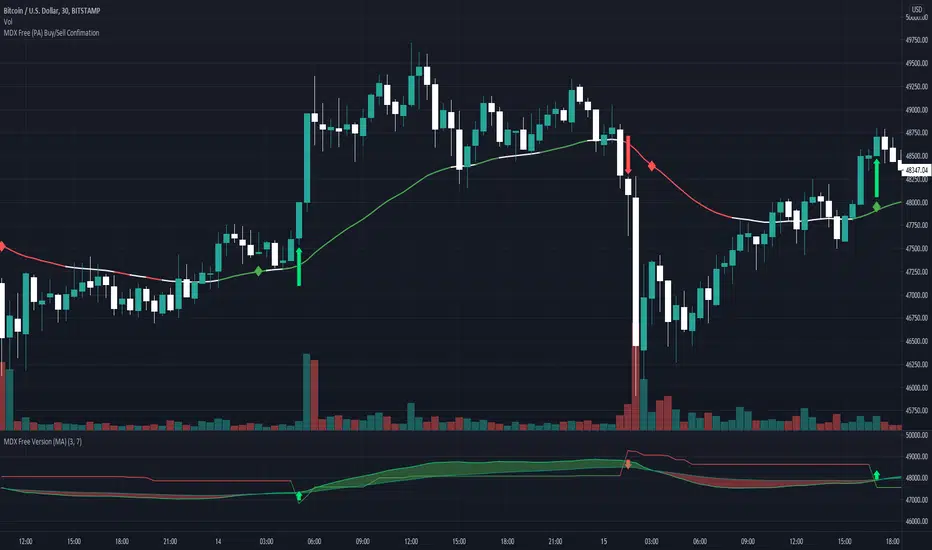
MDX Free (PA) Buy/Sell ConfimationThis is a free version of the MDX Crypto trading "bot". Note that this indicator and the MDX version are based on simple code available on trading view or via google search.
This indicator is based on the super trend indicator to provide buy/sell signals at inflection points of uptrends and downtrends. These inflection points are commonly used as entry/exit points for trading. They are represented on the chart as green (buy) or red (sell) arrow.
This also uses two exponential moving averages. One average is set over 21 bars (fast) and the other is set over 55 bars (slow). When the plots intersect it represents a change in momentum. This is shown on the chart as a red (negative change) or green (positive change) diamonds. When a green diamond follows a green arrow it is considered a confirmed buy. When a red diamond follows a red arrow it is a confirmed sell.
Caution:
Caution this indicator is not reliable on its own, especially on low time scales. When looking back in time this indicator will almost always show a "confirmed buy" before a large increase in price, but on many occasions you can have a "confirmed buy" which is followed by a dump in price, that will not trigger sell signal in time. For best results use with 15m to 1h timeframes
Disclaimer:
This indicator is for informational purposes and should be used for educational purposes only. If you rely on this for trading without additional information you will loose money. I am not a financial advisor, or a professional trader. Use at your own risk.
This is an unpolished version. It may be updated and the source code published if it is used.
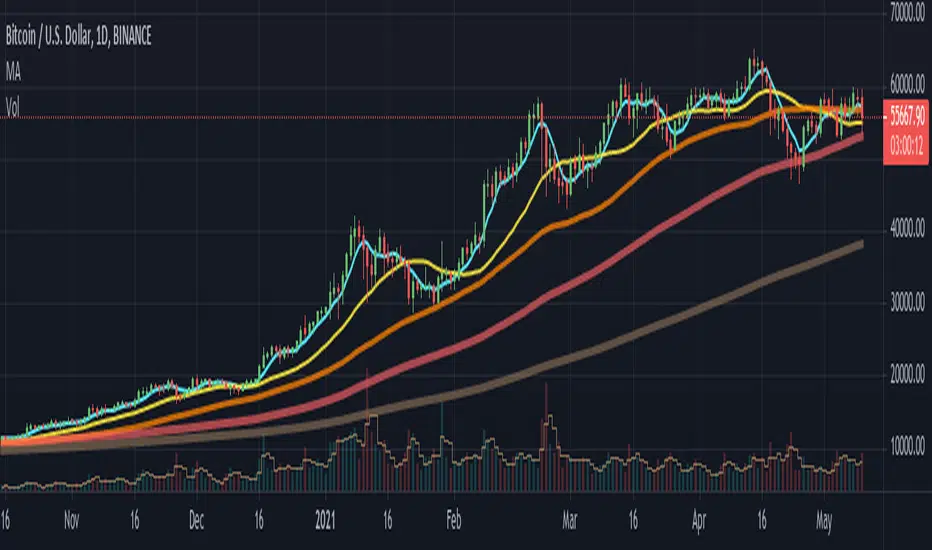
Customisable Moving Averages x5This is a Moving Averages pack with 5 lines.
This indicator is different from others because with it you can select the MA type used in calculations for each line.
Available MA types are (currently):
SMA
EMA
WMA
VWMA
RMA
HMA
Also configurable (for each line) are data source (open, close, hlc3, etc) and period.
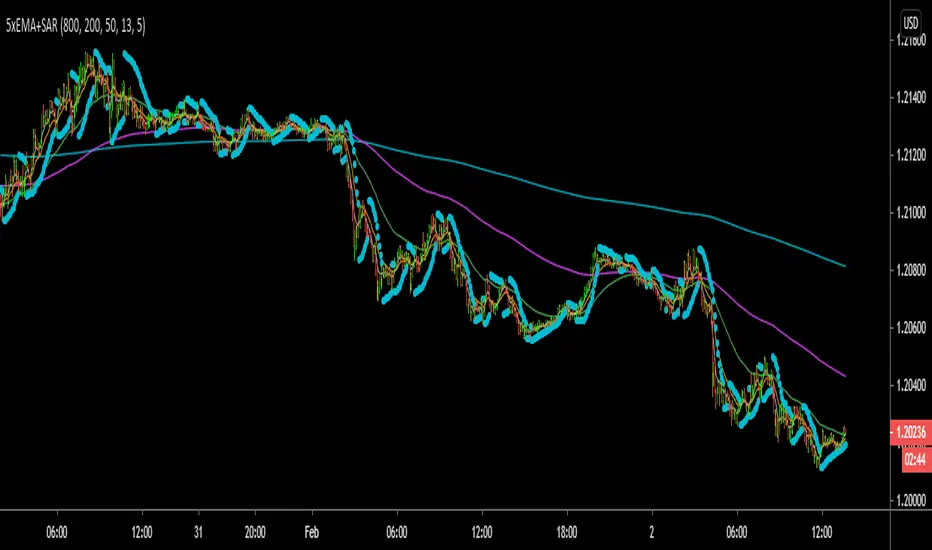
Heavy EMAThis script looks at 5 different EMAs so that you can compare the short term to the long term trend, and combines it with the Parabolic SAR. This can be used to find a great entry into a new or reversing trend.
Volume Average Cross - VAC DefaultVolume Average Cross Default Indicator
This indicator plots signals from two different visual volume averages when they cross.
In does in addition to that show the default volume bars.
This is VAC Default. If you need to see the crosses on your chart and not on the volume bars please go to my VAC Chart Indicator.
Rules:
Fast Volume Period always has to be lower than the Slow Volume Period to trigger correct signals.
Inputs:
-> Fast Volume Average Period
-> Slow Volume Average Period
-> Option to enable/disable the cross-signals and to show/hide both volume averages.


MA Cloud with FillMA Cloud with Fill
This is a powerful custom indicator that uses 3 Moving Averages with a 4th Constant 200 MA (can be customized)
This tells you what the market is doing, and what the overall trend of the market is. A good Swing trade or Day trade indicator.
This indicator works on all markets , it was made and based off of normal candles but heiken ashi works fine, it does not repaint and the recommendations for the indicator is as follows..
Best timeframes to use: 5min, 15min, and 1hr. But any timeframe can be used.
Best settings: the preset settings are what I recommend, depending on trading strategy (I swing trade) you can remove the Buy and Sell labels and just use the strong signal and trend confirmations to make the best trades.
Alternate recommended settings are in the settings tab of the indicator. The slashes represent different settings you can adjust to..
(Example:)
Fast MA: 10/20/30
Mid MA: 12/25/35
Slow MA: 50/60/70
Use 10,12,50 together... use 20,25,60 together... use 30,35,70 together.. etc...
There are multiple labels and reading them correctly takes an experienced eye. This will be updated continuously to filter bad signals or to add strong signals!
Buy and Sell signals are good entry or exit points depending on the overall trend.
These occur when the Fast MA crosses over(BUY) or under(SELL) the Mid MA
They can alert when a trend may reverse or a good take profit point or a good place for a new stop loss if trend continues.
The BEST Buy and Sell Signals are when the...
BUY is in the fill (between fast ma and slow ma) or above fast MA
SELL is in the fill (between fast ma and slow ma) or below the slow MA
Strong Buy and Strong Sell signals are even better but more swing trading entry points
These occur when the Fast MA(lime) crosses over(BUY) and the close is over the Fast MA or under(SELL) the Slow MA and close is under the Slow MA
These Strong labels are showing a trend change in the market for the timeframe you are looking at.
The General Bullish and Bearish signals are some of the best signals and show a confirmed trend in the market. These can be effective to trade on alone, otherwise good for confirming a position.
These occur when the Fast MA crosses over (BULLISH) the constant MA (200) or under (BEARISH) the constant MA (200)
The Strong Bullish and Bearish signals are the strongest signals for this indicator.
These occur when the Fast MA crosses over (BULLISH) the constant MA (200) and the close is over the Fast MA or under (BEARISH) the constant MA (200) and the close is under the Slow MA.
Background colors of aqua and red are showing the same general bullish or bearish signals, and can be effective if you want to see that trend change without having the labels showing up.
There are settings available to color the bars depending on the trend.
Green if Fast MA is over the Slow MA and the close is above the Fast MA
Red if the Slow MA is over the FAST MA and the close is under the Slow MA
Gray is when the close is opposite of the trend and between the fill
Purple is when the close is opposite of the trend and is Below the opposite corresponding MA (Above Fast MA when bearish, Below Slow MA when Bullish)
You can also change the fill color between the Fast and Slow MA which colors the fill the same as bar colors but the purple will be a light shade of black in the fill.
There are also Pivot Labels and Alternative Tops and Bottoms signals which are betting opposite of the indicators and can be useful for daytrades to see potential reversals. These are very risky and not recommended to trade on .
These are more for seeing if your trend is holding strong or if there could be a potential reversal in the next few bars if you are looking to exit.
Updates are always being made and I'm betting some of you will be able to find even better stronger settings to put in. The recommended settings are just what I personally have noticed that works best, but all inputs can be customized!
Safe Trading Strategy:
Go to settings and uncheck the buy and sell signals.
(up to you) uncheck the strong buy and strong sell signals.
You will be left with the bullish and bearish signals of both general and strong and these have proven to be some of the strongest trades to take.
If you keep the strong buy and strong sell, these can be good to enter a new position or exit a previous position, depending if bullish or bearish trend confirms but some of these can be false overall trend signals and I do recommend using a different indicator to confirm the reversal or confirmation (RSI, MacD, etc..)
Want to use this indicator or wondering how to add to your chart? DM me or join the link in my profile to get a glimpse at what is all available!
We are all in this together and the more one gains, the more we all succeed!

CC - PVT CloudsReleasing this test script for PVT ratios using sub-interval harmonics at a 1D, 4H, 1H, 45M, 15M and 5M level.
It basically takes the PVT values for a rolling periodic interval and gets the (avg - min)/max for that interval (the ratio).
Then it colors it based on the subinterval next to it. Just think of it as rolling Ichimoku clouds, but in real-time using PVT.
I'm not saying much more than that, as this is an experimental indicator. Feel free to use it and give me feedback.
Drop a like if this helps you trade, but please do not use these indicators as a DIVINING ROD for your trades.
However, I will possibly release a paid version with TEXTUAL take profit/stoploss indicators.
*DISCLAIMER*
No amount of technical indicators will safe you from a lapse in Due Diligence or Market/Industry Judgement.
I am not responsible for lost equity due to trades caused my relying on this indicator.

Welles Wilder MA [MX]The average of 34 periods I observe as a mobile S/R, but I usually observe it more when it is in strong trend, and the average of 72 and 89 as trend dictators, if the asset is above them = Bullish , below = Bearish , and the 144 average as the last moving S/R, and also as an S/R even stronger than all other MAs and when the asset loses that average, I see it as final confirmation of the other previous averages.
I give more importance to the average of 89 periods than to 72, because I see it as an extension to the average of 72, as if it were a trend range.
for those who prefer to observe the crossing of short and long averages as a way to see the trend, I also left this option, although I do not use
//////////////////////////////
A média de 34 periodos eu observo como um S/R móvel, mas eu costumo observar ela mais quando está em forte tendência, estando bem bearish ou jeffish, e a média de 72 e 89 como ditadoras de tendência, se o ativo está acima delas = Bullish , abaixo = Bearish , e a média de 144 como o último S/R móvel, e também como um S/R ainda mais forte que todas as outras MA's e quando o ativo perde essa média, eu vejo como confirmação final das outras médias anteriores.
Eu dou mais importância a média de 89 períodos do que a de 72, porque eu vejo ela como uma extensão a média de 72, como se fosse um range de tendência.
para quem prefere observar o cruzamento das médias curtas com as longas como forma de ver a tendência, eu deixei também essa opção, embora eu não use
Average change histogramThis histogram shows the average change in price between the past x candles close. If the average change is increasing the color of the histogram becomes dark green (if above 0) or dark red (if below 0).
This can be used for trend detection or the spotting of parabolas.

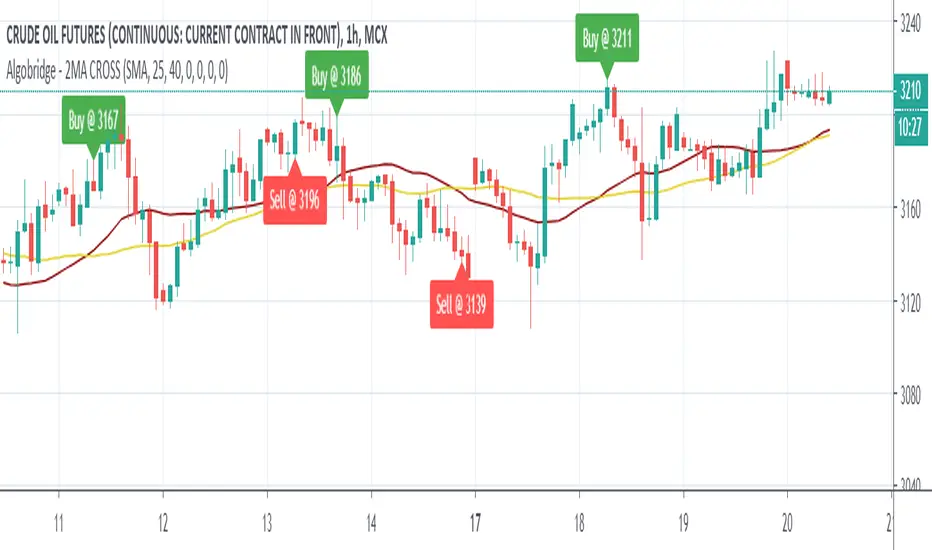
MA_CROSSOVER with SL & TPThis is the Moving Average Script Including the Stoploss and Target Levels. By Default it is working on 25 & 40 Parameters but it can change accordingly.
FrameKitHere are the elements that FrameKit adds to your graphic.
The Bollinger Bands of the upper TimeFrame.
As explained above, context bands are present to speed up your analysis and give you interesting areas to position on your local TF.
Also, since there are two elements in the BBs, the bands and the moving average, I have shown you a trace of this moving average for the last 40 candles. This information therefore gives you an additional technical zone to watch out for when the price approaches it, since there could be a price reaction. This may be the less useful information in FrameKit, because I personally use it very little and that's why I only displayed it for the last 40 candles. On the other hand, I don't want to saturate your chart with too much information and leaving the complete MM trace would have been superfluous and useless.
The Bollinger Bands of the local TimeFrame.
The other information that FrameKit offers you is the bollinger bands channel of the local TimeFrame. This channel is called the minor channel. This information is represented by 2 thin lines, identical to BBs. As its name indicates, the minor channel gives us additional information about the local TF and minor market fluctuations. In addition, this channel allows us to secure our position, something we will see in the risk management stage.
A 200-period Moving Average (orange line).
The penultimate information offered by FrameKit is a 200-period moving average. This MM is used a lot by Traders and that's why it's important. The 200MM, combined with another technical framework such as the Fibonacci ratios as instance, offers you once again a better information package and strengthens your conviction about the market and your trading plan. The 200 Moving Average gives a very good idea of the current trend in the medium term and it's always good to keep an eye on it! For example, it can be useful in a context such as pull-back within a trend. Also be aware that you can change the period’s number of the moving average by clicking on the settings button besides the Framekit indicator. Then change the value over EMA Lenght. That said, I recommend using the 200MM since it gives us a good view of the current market.
TD9
Finally, the last information that FrameKit gives us is the TD9 Sequential, that can be activated by going again in the FrameKit settings and checking the box “Show TD9 Sequential”.
Here is the TimeFrame List for the indicator, but you can also access this list with the google sheets on Teachable.
1M = 5M
3M = 15M
5M = 15M
15M = 1H
30M = 2H
1H = 4H
2H = Daily
4H = Daily
Daily = Weekly
Weekly = Monthly
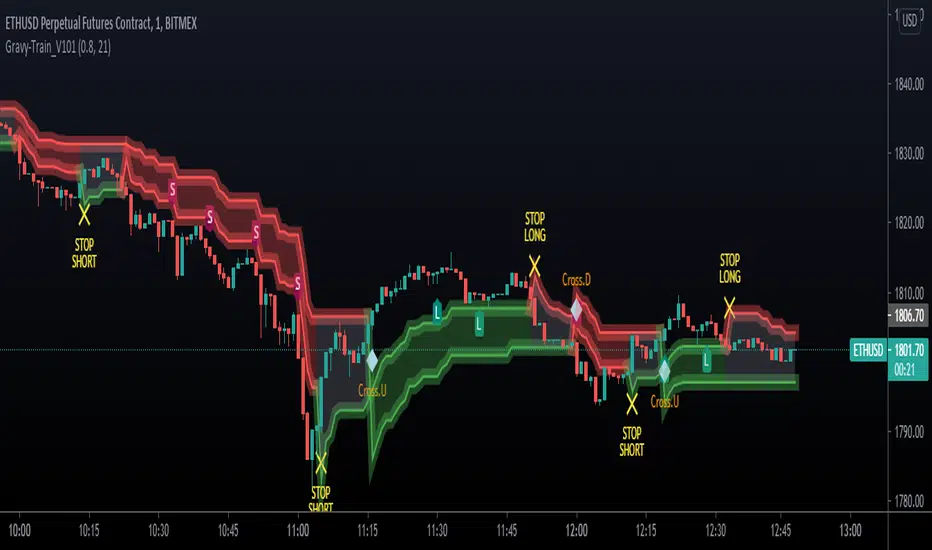
UTG - Gravy TrainThe most complex indicator we've ever developed.
Works on ALL MARKETS!
Gravy Train is a ALL IN ONE - ONE GLANCE indicator.
- It allows you to gauge trend, gives you appropriate LONG & SHORT identifiers
- It identifies when the trades should be over
- Cloud based support & resistance Zones drawn on the chart
- It keeps you OUT of the market in areas of indecision
- It works on ALL timeframes
- Takes the emotion out of trading various markets
- Gravy Train is Unity Trading Groups bread and butter for Scalping, Swing Trading, Position Trading & Day Trading
Unity Trading Group is proud to present Gravy Train!
To gain access to this script, you can find our details in our Signature, use the links below to find out!
MESA Adaptive Moving Average - Improved MTFThis indicator is a huge upgrade to my original MTF MESA
Plots are now extremely smooth and accurate on all timeframes **
Missing data points are automatically filled with the "best fit"
This is a Trend indicator and should be used to trade "top-down" aka:
Start with the Daily chart to confirm a trend
Move to 4H
2H
Etc...
Use your favorite entry method or simply watch for wicks forming when the price gets near the MESA adaptive moving average.
This is one of the few indicators that I've been using for years with success. Being able to plot both the current & higher timeframe MESA
can sometimes feel like cheating.
Due to the nature of the recursive calculation, you may notice slight differences between this version of MESA and others that either
approximate higher timeframes with fewer samples or make use of the latest "Resolution" argument in Pinescript V4. Both of which are
fine, until you start looking at M5 charts while plotting the Daily MESA.
As always, happy trading!
** Currently supports
M 1,3,5,15,30,45
H 1,2,3,4
Day 1
Week 1
Month 1
Pre-Market Volume ProfileThis indicator displays the pre-market volume (note: without the post-market of the previous day).
Unusual pre-market volume often indicates that institutional market makers are moving the market, which is a good sign for unusual high price movement.
The indicator helps me to spot stocks, if a pre-market gap is confirmed with enough (unusual) volume.
You can define, what "unusual" means by you, by adjusting the SMA length and the SMA multiplier.
The default is a length of 21 bars and a 2.5 multiplier, meaning I'm interested in a stock, if the pre-market volume exceeds the average pre-market volume by 2.5 times.

Volume Weighted DeviationsVolume !weighted!
deviations.
Important: I don't really know how people generally compute deviations from VWAP/VWMA, but smth tells me generally it's just a Av Dev/St Dev based on mean, not on appropriate basis, like volume weighted mean in our case. This version is mathematically correct, it first calculates weighted mean, than utilizes this weighted in mean in AvDev & StDef functions modified to take into account weights.

SMA's AverageReturn the average of simple moving averages with periods starting from min to max that is:
avg(sma(src,min),sma(src,min+1),...,sma(src,max))
The user can choose three types of weightings for the average, "simple", "linear", and "least squares".
Settings
Min : minimum period of the sma
Max : maximum period of the man, must be higher than "Min"
Src : input data of the indicator
Type : type of weighting, available options are "Simple", "Linear" or "Least Squares", by default "Simple"
Usage
The moving average can be used like any other classical moving average. The different types of weightings change the behavior of the moving average, the simple weighting will weight all the moving averages equally, a linear weighting will use the weighting function of a WMA, as such moving averages with lower periods will receive higher weights, this decrease the lag of the moving average. Finally, the least-squares weighting uses the weighting function of a least-squares moving average, this allows to drastically reduce the lag of the moving average.
in red the moving average using simple weighting, in blue linear weighting, and in orange least squares weighting, with all using min = 14 and max = 28.
In red the moving average with min = 50 and max = 200, in blue a LSMA of period 200, notice how the moving average has less overshoots.
Details
Computing the average of various simple moving averages is simple, remember that a simple moving average can be computed using a cumulative sum:
Sma = change(cum(src),length)/length
we can't compute various "sma" functions with changing length argument within a for loop, but we can still differentiate within it, as such the cumulative sum method is super efficient and convenient.
The impulse response of this moving average is rectangular for the first "min" values, then the impulse is tailed, with the weighting method defining the shape of the tail.
in red the simple weighting method, in blue the linear method, and in orange the least-squares method.
Our moving average is an FIR moving average, as such the output lag is a linear characteristic of the moving average, which imply that:
Lag = Avg(lag(Sma(min)),lag(Sma(min+1))...,lag(max))
where lag is the lag of the moving average, in the case of a simple weighting we have:
Lag = Avg((min-1)/2,(min+1-1)/2,...,(max-1)/2) = Avg((min-1)/2,(max-1)/2)
a linear weighting gives a lag of:
Lag = Avg((min-1)/3,(min+1-1)/3,...,(max-1)/3) = Avg((min-1)/3,(max-1)/3)
Summary
A script computing the average of various moving averages has been presented, this MA might not be super useful to the everyday analyst but it stills have some great potential. Thx for reading.
This indicator is dedicated to my sister Lea, happy birthday kokoro
Harmonic MADsNo, it's not a new saturation plugin for your fruity loops.
...
These are Mean Average Deviations calculated from Harmonic Mean.
...
In my previous research I tried to develop "Harmonic Average Deviations", since applying stdevs on Harmonic Mean calculated from reciprocals ain't make sense. Din't work out, prolly cuz by definition stdevs doesn't like negatives. So in the end I ended up using Mean Average Deviations, and turned out it works great. Generally market data doesn't distribute normally, so t's a great tool, now weird kurtosis won't be a problem.

[R&D] Harmonic deviationsI'm publishing it for research purposes & welcome any ideas and/or explanations whether it's actually possible or nah to do what I'm doing right now.
...
Idea is simple - if we can do Harmonic Mean, can we do Harmonic Standard Deviations? It should be the same logic, the only difference is instead of actual datapoints we gotta use reciprocals.
In reality I've found smth really curios, it's possible to get these Harmonic Standard Deviations, however, somewhy, depends on your timeframe, u gotta do final sqrt different amount of times. And looks like... the market reacts to these levels.
That's why in the script settings there is a menu where you can choose how many times to perform sqrt operation.
Pls check it out, play with it, see maybe you'll see smth interesting.
