SwingScalpin MA'sDefault
HMA's + Trend Signals
Default SMA's
ALMA
BarColoring
The idea behind this script was to incorporate a few different moving average types into 1 indicator so multiple trading strategies could be implemented depending on Price Action. This indicator includes 3 HMA's, 2 user defined EMA/SMA's, 1 ALMA (which also is used for the bar coloring), and Trend signals at the bottom of the chart (which are defined by the 1st MA). By default all of the Moving Averages are set to false because they aren't meant to be used together unless you so chose to. The only feauture initially being shown are the Trend signals at the bottom of the screen.
HMA's - The default lengths for the HMA's are 7, 14, and 21.
This is not Financial Advice nor am I saying this works all of the time but here are a few examples of how I've traded the HMA's... OF course thid depends on overall PA but the idea is to enter and exit when all
three HMA's turn Green or Red...
For quicker entries and exits, you could enter when the Fast HMA crosses the Medium HMA and exit when the it crosses back over/under the Medium HMA.
For more of a swing trade and when there's definitely an established trend, I would stay in the trade until Fast HMA crosses under the Slow HMA, otherwise it might just be a normal retrace prior to making another move up.
When PA is ranging but not really trending in either direction, I'll use the Slow HMA as somewhat of a Trailing SL.
The 2 user defined moving averages can either be an EMA or SMA. The 1st MA is set to the 200 SMA by default, which also triggers the Trend signals at the bottom of the chart. The 2nd MA is set to the 6 SMA by default.
The ALMA is set to 50 by default, which is also used for the bar coloring. Lastly, all of the MA's change color depending on the trend.
Alma
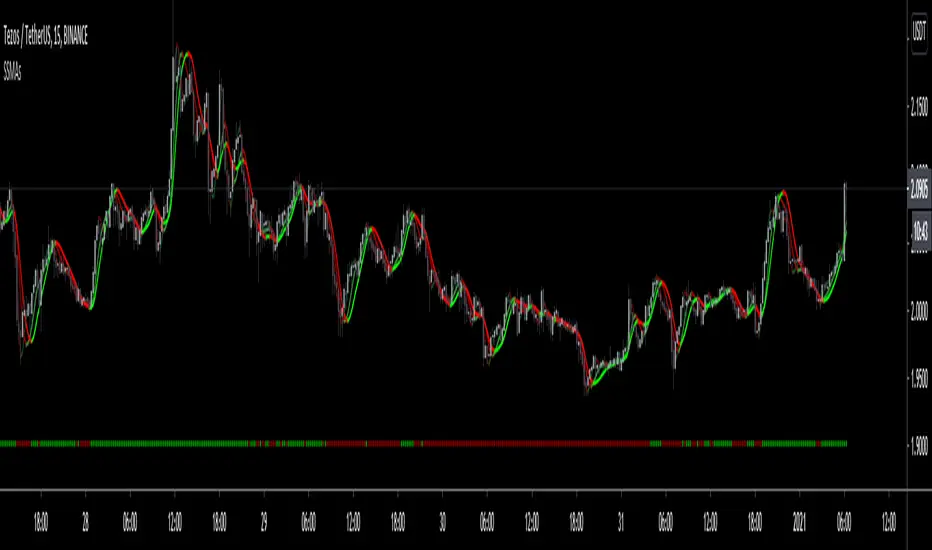
Custom Moving Average (EMA & SMA)This script is a custom visualization tool to plot 4 Moving Averages (MA).
Each MA is customizable; you can:
enable (disable) the plot of MA;
select whether the MA is an EMA or an SMA;
the length;
the source (open, close, ...);
the offset value (default is 0).
Note:
The 1st MA is an EMA with length 50.
The others MAs are SMA with length 9, 30 and 100 respectively.

ALMA PPO with Volume Weighted ATR BandsAlma PPO with a percentile eq and atr bands using volume weighted alma. Volume weighted alma idea from rumpypumpydumpy. All code is from the open source library.


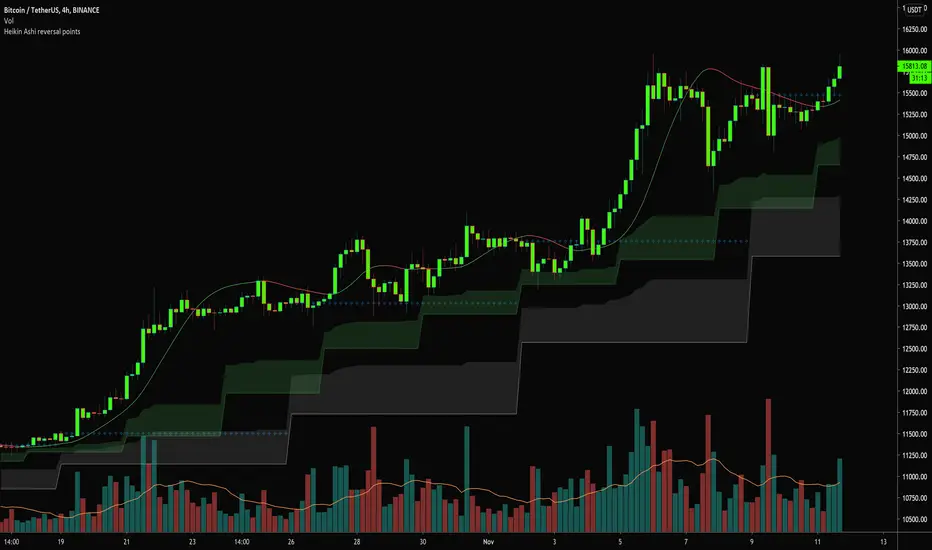
Heikin Ashi reversal pointsThis study plots higher time frames Heikin Ashi candles open values and creates clouds above/below those value. When lower timeframe candles enters this cloud - that is the turning point, where HTF Heiking Ashi candle change its color.
Script uses ALMA smoothing of current selected time period. When ALMA enters area, where HTF candles changes its color, then current candle is colored based on the possible next trend.
Script can be used for any time periods, but default values 4H ALMA , 3D (fast) and 1W(slow) Heikin candles.
Green candle = ALMA above both faster and slower HA candle reversal point.
Red candle = ALMA below both faster and slower HA candle reversal point.
Gray candle = indicision points - ALMA is between faster and slower HA candle reversal point.
To add further details - hull moving averages might be displayed, to support prediction of the next price trends.
Script was developed mainly for crypto
[blackcat] L1 Colorful KDJLevel: 1
Background
The KDJ oscillator display consists of 3 lines (K, D and J - hence the name of the display) and 2 levels. K and D are the same lines you see when using the stochastic oscillator. The J line in turn represents the deviation of the D value from the K value. The convergence of these lines indicates new trading opportunities. Just like the Stochastic Oscillator, oversold and overbought levels correspond to the times when the trend is likely to reverse.
Function
L1 Colorful KDJ use alma() and color to indicate k, d, j trend directions and use candles for j value indication of buy and sell points.
Key Signal
k --> k value of a stochastic oscillator
d --> d value of a stochastic oscillator
j --> the deviation of the d value from the d value of a stochastic oscillator
Pros and Cons
Pros:
1. filter out KDJ fake signal by introducing alma()
2. J value can be used to detect overbought and oversold regions
Cons:
1. It works better in small time frame and sideways. Extreme long or short conditions may cause KDJ staturate.
2. It can only indicate in current time frame, larger time frame trend info is missing.
Remarks
NA
Readme
In real life, I am a prolific inventor. I have successfully applied for more than 60 international and regional patents in the past 12 years. But in the past two years or so, I have tried to transfer my creativity to the development of trading strategies. Tradingview is the ideal platform for me. I am selecting and contributing some of the hundreds of scripts to publish in Tradingview community. Welcome everyone to interact with me to discuss these interesting pine scripts.
The scripts posted are categorized into 5 levels according to my efforts or manhours put into these works.
Level 1 : interesting script snippets or distinctive improvement from classic indicators or strategy. Level 1 scripts can usually appear in more complex indicators as a function module or element.
Level 2 : composite indicator/strategy. By selecting or combining several independent or dependent functions or sub indicators in proper way, the composite script exhibits a resonance phenomenon which can filter out noise or fake trading signal to enhance trading confidence level.
Level 3 : comprehensive indicator/strategy. They are simple trading systems based on my strategies. They are commonly containing several or all of entry signal, close signal, stop loss, take profit, re-entry, risk management, and position sizing techniques. Even some interesting fundamental and mass psychological aspects are incorporated.
Level 4 : script snippets or functions that do not disclose source code. Interesting element that can reveal market laws and work as raw material for indicators and strategies. If you find Level 1~2 scripts are helpful, Level 4 is a private version that took me far more efforts to develop.
Level 5 : indicator/strategy that do not disclose source code. private version of Level 3 script with my accumulated script processing skills or a large number of custom functions. I had a private function library built in past two years. Level 5 scripts use many of them to achieve private trading strategy.

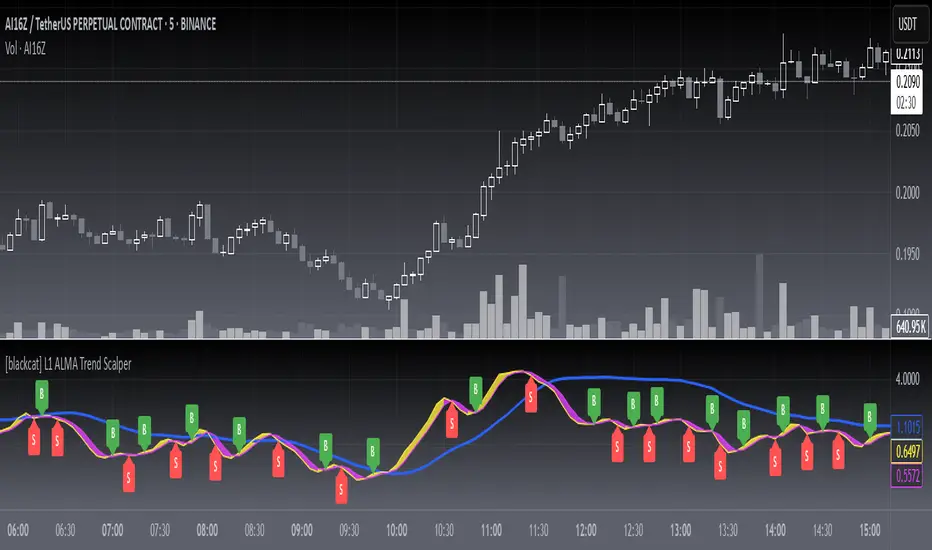
[blackcat] L1 ALMA Trend ScalperLevel: 1
Background
The Arnaud Legoux Moving Average (ALMA) indicator was recently added to the family of moving averages. It was developed in 2009 by Arnaud Legous and Dimitrios Kouzis Loukas. Since then, this indicator has gained huge popularity among traders.
ALMA works like any moving average work. However, the calculation of the ALMA is more perfect compared to the moving average. This indicator has minimal lag which makes it a leading indicator in the market. While the SMA, MA, EMA and SMMA signal line is often delayed. The ALMA was designed to address the two critical disadvantages of traditional moving averages, responsiveness and smoothness.
Function
L1 ALMA Trend Scalper is simple but powerful. This indicator makes full use of ALMA's rapid response advantage to provide buying and selling points by winding and crossing two short-term moving averages. A mid-term moving average can provide relatively effective support and pressure. Finally, the function of whale pump detection is simply realized through the characteristics of the moving average.
Key Signal
trendline --> mid term moving average for support and resistance
tradingline ---> basic element for fast line and slow line
fastline ---> fast line for short term
slowline --> slow line for short term
pumpstart ---> simple whale pump zone detection
Pros and Cons
Pros:
1. Simple but clear to see the trend reversals
2. Aux middle term moving average help just whether it is a true or fake breakout
Cons:
1. No advanced trading skill is incorporated
2. Need improvements on sideways.
Remarks
Just be simple but powerful
Readme
In real life, I am a prolific inventor. I have successfully applied for more than 60 international and regional patents in the past 12 years. But in the past two years or so, I have tried to transfer my creativity to the development of trading strategies. Tradingview is the ideal platform for me. I am selecting and contributing some of the hundreds of scripts to publish in Tradingview community. Welcome everyone to interact with me to discuss these interesting pine scripts.
The scripts posted are categorized into 5 levels according to my efforts or manhours put into these works.
Level 1 : interesting script snippets or distinctive improvement from classic indicators or strategy. Level 1 scripts can usually appear in more complex indicators as a function module or element.
Level 2 : composite indicator/strategy. By selecting or combining several independent or dependent functions or sub indicators in proper way, the composite script exhibits a resonance phenomenon which can filter out noise or fake trading signal to enhance trading confidence level.
Level 3 : comprehensive indicator/strategy. They are simple trading systems based on my strategies. They are commonly containing several or all of entry signal, close signal, stop loss, take profit, re-entry, risk management, and position sizing techniques. Even some interesting fundamental and mass psychological aspects are incorporated.
Level 4 : script snippets or functions that do not disclose source code. Interesting element that can reveal market laws and work as raw material for indicators and strategies. If you find Level 1~2 scripts are helpful, Level 4 is a private version that took me far more efforts to develop.
Level 5 : indicator/strategy that do not disclose source code. private version of Level 3 script with my accumulated script processing skills or a large number of custom functions. I had a private function library built in past two years. Level 5 scripts use many of them to achieve private trading strategy.
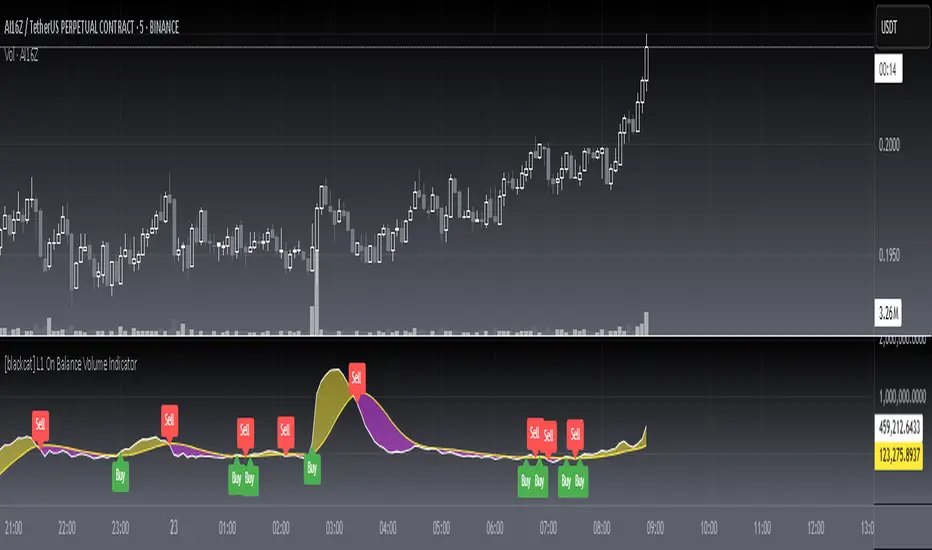
L1 On Balance Volume IndicatorLevel: 1
Background
On Balance Volume (OBV) is a simple indicator that uses volume and price to measure buying and selling pressure. The buying pressure is evident when the positive volume exceeds the negative volume and the OBV line rises.
Function
L1 On Balance Volume Indicator is a simple but improved OBV by using alma and more input parameters
Key Signal
OBV and its ALMA
Pros and Cons
Pros:
1. More freedom to tune with more input parameters
2. ALMA can make better tradeoff between response and smooth
Cons:
1. No details of volume generation can be disclosed
2. It may help to judge trend but not the short-term price movements.
Remarks
NA
Readme
In real life, I am a prolific inventor. I have successfully applied for more than 60 international and regional patents in the past 12 years. But in the past two years or so, I have tried to transfer my creativity to the development of trading strategies. Tradingview is the ideal platform for me. I am selecting and contributing some of the hundreds of scripts to publish in Tradingview community. Welcome everyone to interact with me to discuss these interesting pine scripts.
The scripts posted are categorized into 5 levels according to my efforts or manhours put into these works.
Level 1 : interesting script snippets or distinctive improvement from classic indicators or strategy. Level 1 scripts can usually appear in more complex indicators as a function module or element.
Level 2 : composite indicator/strategy. By selecting or combining several independent or dependent functions or sub indicators in proper way, the composite script exhibits a resonance phenomenon which can filter out noise or fake trading signal to enhance trading confidence level.
Level 3 : comprehensive indicator/strategy. They are simple trading systems based on my strategies. They are commonly containing several or all of entry signal, close signal, stop loss, take profit, re-entry, risk management, and position sizing techniques. Even some interesting fundamental and mass psychological aspects are incorporated.
Level 4 : script snippets or functions that do not disclose source code. Interesting element that can reveal market laws and work as raw material for indicators and strategies. If you find Level 1~2 scripts are helpful, Level 4 is a private version that took me far more efforts to develop.
Level 5 : indicator/strategy that do not disclose source code. private version of Level 3 script with my accumulated script processing skills or a large number of custom functions. I had a private function library built in past two years. Level 5 scripts use many of them to achieve private trading strategy.
Resampling Filter Pack [DW]This is an experimental study that calculates filter values at user defined sample rates.
This study is aimed to provide users with alternative functions for filtering price at custom sample rates.
First, source data is resampled using the desired rate and cycle offset. The highest possible rate is 1 bar per sample (BPS).
There are three resampling methods to choose from:
-> BPS - Resamples based on the number of bars.
-> Interval - Resamples based on time in multiples of current charting timeframe.
-> PA - Resamples based on changes in price action by a specified size. The PA algorithm in this script is derived from my Range Filter algorithm.
The range for PA method can be sized in points, pips, ticks, % of price, ATR, average change, and absolute quantity.
Then, the data is passed through one of my custom built filter functions designed to calculate filter values upon trigger conditions rather than bars.
In this study, these functions are used to calculate resampled prices based on bar rates, but they can be used and modified for a number of purposes.
The available conditional sampling filters in this study are:
-> Simple Moving Average (SMA)
-> Exponential Moving Average (EMA)
-> Zero Lag Exponential Moving Average (ZLEMA)
-> Double Exponential Moving Average (DEMA)
-> Rolling Moving Average (RMA)
-> Weighted Moving Average (WMA)
-> Hull Moving Average (HMA)
-> Exponentially Weighted Hull Moving Average (EWHMA)
-> Two Pole Butterworth Low Pass Filter (BLP)
-> Two Pole Gaussian Low Pass Filter (GLP)
-> Super Smoother Filter (SSF)
Downsampling is a powerful filtering approach that can be applied in numerous ways. However, it does suffer from a trade off, like most studies do.
Reducing the sample rate will completely eliminate certain levels of noise, at the cost of some spectral distortion. The lower your sample rate is, the more distortion you'll see.
With that being said, for analyzing trends, downsampling may prove to be one of your best friends!

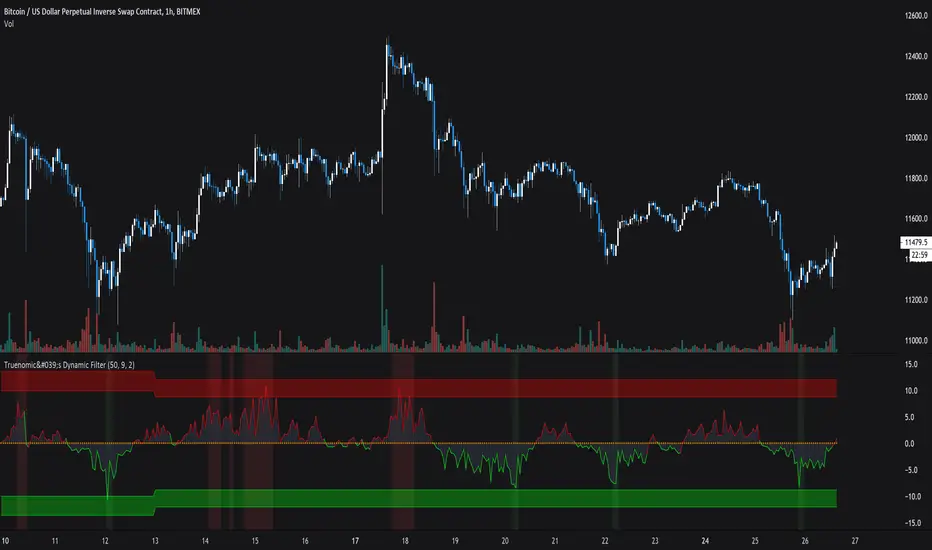
Truenomic's Dynamic FilterThis indicator is based on the deviation of the average price value given the dynamics of the volume.
Thus, receiving a negative value, the mood becomes more bullish. But when a colored background appears, it signals an even more amplified signal. The colored background is based on an abnormality.
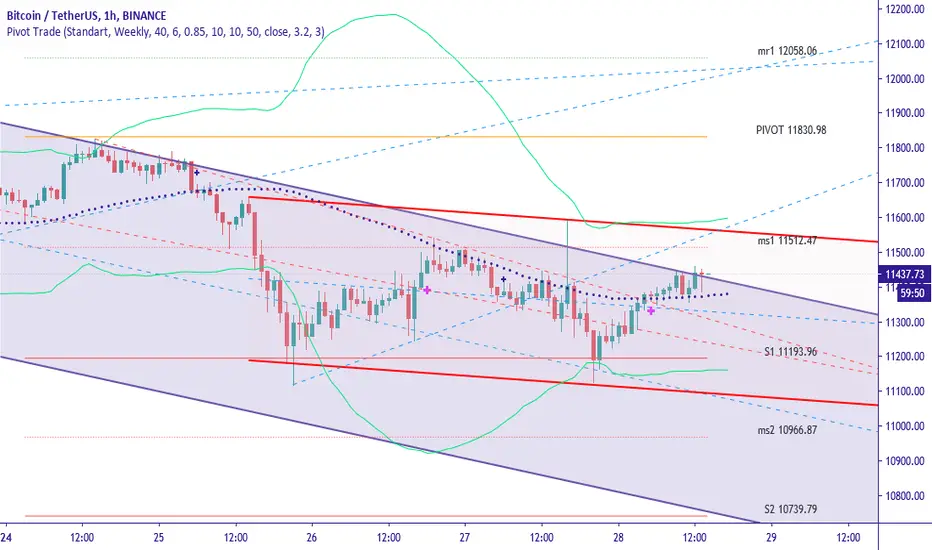
Pivot TradeThis study contains:
- A complete set of pivot calculation. Standart, Fibonacci, Woodie, Camarilla
- Standart Pivot with extended support and resistance levels.
- ALMA a new generation moving average indicator which succesfull to follow trend changes.
- System28 EMA Based trend follower. (Thanks to great master Ali Ömür)
- Auto Trend Lines drawing tool with pivot highs and lows.
- Alarm function on pivot levels.
How to Use :
UPTREND
Orange cross points to an uptrend,
Fuschia cross confirms uptrend.
DOWNTREND
Black cross points to an donwtrend,
Navy cross confirms uptrend.
SMOTHING_MOVE_SIDDThis Indicator is used to smooth the movement of scripts with SMMA and SEMA .
Inspired by Chris Moody RSI-EMA .
This indicator help to avoid any kind of small correction in trending direction and it filter small kind of correction.
Small correction like 2-15 irregular corrective candles is filtered with the help of smooth moving average and Arnaud Legoux Moving Average.
Keep default setting help for optimal trend filter changing setting may change the results.
This Indicator is not recommending for Buy and Sell.

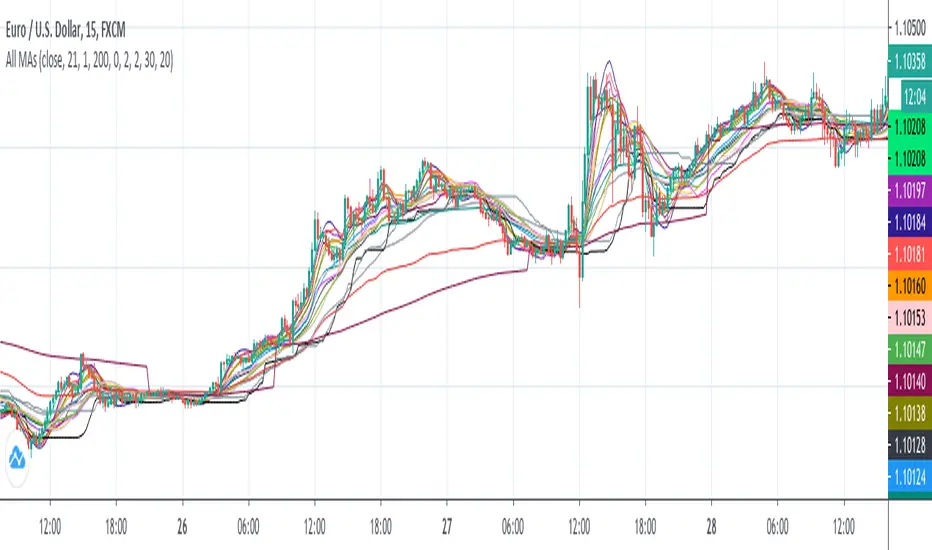
All MAs displayedThis is a collection of moving averages.
Thanks to everget and other pinecoders to pubblish their codes in tradingview.
I just collect a lot of moving averages in one script and transform them in stand alone functions, so you can copy and paste in your script the MA that best fit your needs.
Furthermore, the chart shows which moving average has more smooth and which one has less lag and so on: in this way it is easy to graphically compare moving averages.
ALMA Function [FN] - Arnaud Legoux Moving AverageThis hasn't been done before. People know the ALMA moving average, TradingView, of course, has a built-in function for the ALMA = alma(). But, when you use built-in functions, you can't have a series as a length. Pinecoders put out a bunch of functions for various routines wherein the built-in doesn't allow for a series as a length. I got some help from @everget (awesome dude) to do the dev() function as well... can't find the ALMA anywhere. So, here it is. It seems to match the built-in indicator. To double-check me, just put the ALMA built-in over this and they should match. Let me know if you find an issue.
That's it. ALMA is cool. I'm going to use it as the average for the CCI. Good day.

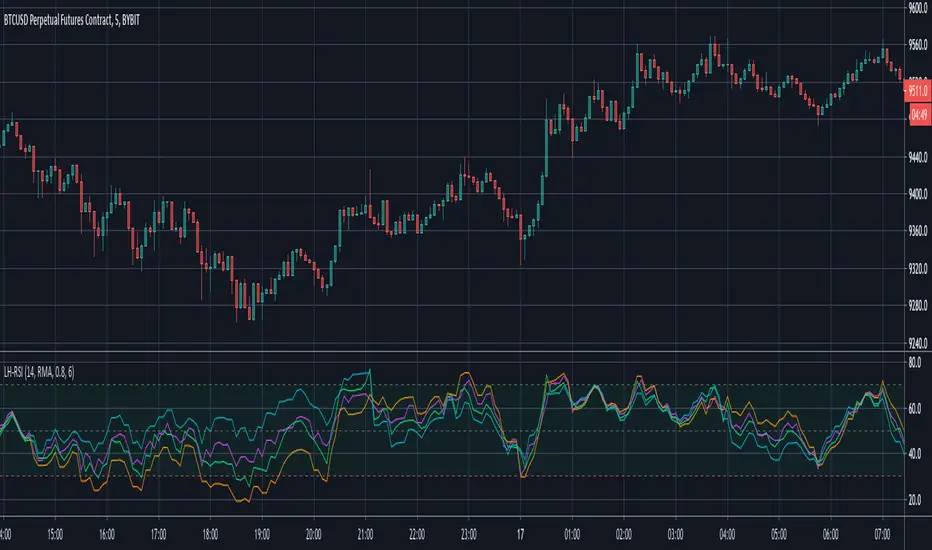
Low-High RSIIt is an RSI indicator with 3 lines (or 4 if you enable the original RSI in settings):
The lime is calculated from high
The fuchsia is calculated from low
The orange one is calcuated form both high and low , by calculating RSI's up from high and down from low
You can also select different moving averages for RSI calculation. (The default is the original RMA)
This indicator is useful for e.g. to filter out original RSI's false signals by waiting both low and high lines to confirm. Or you can use it as an earlier exit indicator.
Please write a comment if you find another usage of it.
ALMA RSIRelative Strength Index indicator which uses Arnaud Legoux Moving Average inside instead of Wilder's Exponential Moving Average (RMA).
This makes it more reactive and also smoother without less false positive signals. It is much easier to find divergences this way.

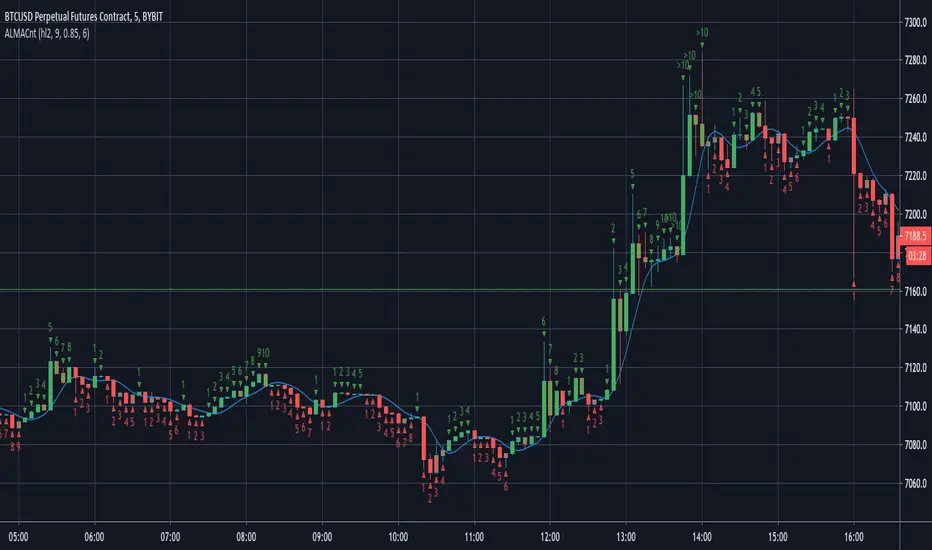
ALMA CounterIt counts how many candles are below or above the Arnaud Legoux Moving Average (ALMA).
It may be useful to found good entry points.
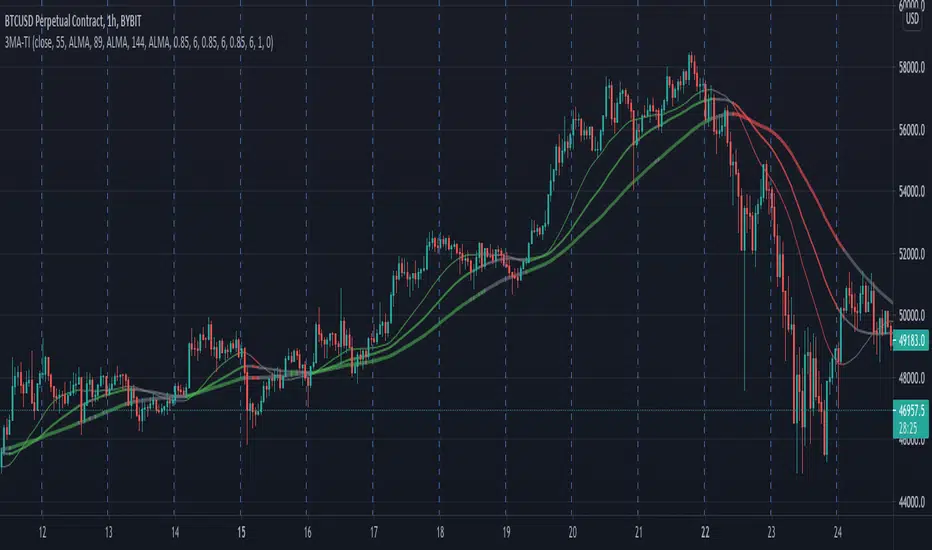
3 MA Trend IndicatorIt is a trend detector indicator, using 3 moving averages.
You can select different MA's and set the periods of them. If all 3 is increasing, the color will be green, if decreasing, the color will be red, gray otherwise.
It can be used for e.g. scalping.
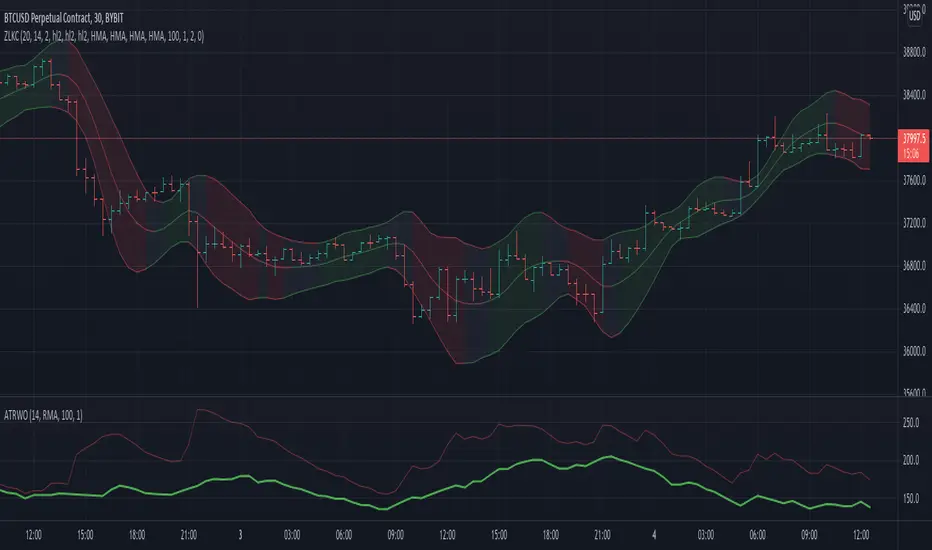
Zero Lag Keltner ChannelsThis is Keltner Channelz (KC) with Zero Lag Moving Average (ZLMA as base). It is smoother and has less lag than the original (EMA/SMA) variant.
It also can be used as a trend indicator and trend confirmation indicator. The upper and lower bands are green if it is an up trend, and red if a down trend. If both have the same color it is a stronger trend.
Alma Trend DirectionIt helps you identify trends in a more convenient way and provides support and resistance levels using Arnaud Legoux Moving Average and Fibonacci values

multi pack fisher's and EMACross and Probabilty densityFisher dönüşümün farklı türlerini en çok kullanılan indikartörlerle yeniden sentezlenmesi sonucu ve farklı ema kesimlerine olasılık dağılım yoğunluğu eklenerek içinde bulunan piyasanın trend gücünü görseleştirme amaçlanmıştır.Çalışma tamamen eğitim amaçlı olup, farklı indikatörlerin bir arada kullanımını göstermek için hazırlanmıştır.Kesinlikle yatırım tavsiyesi değildir.
Saygılarımla...
LazEngineer ,Elecrical Engineer
// English explanation
It is aimed to visualize the trend of the market containing the result of re-synthesis with the most used indicator in different types of fisher trasform and by adding the density of the distribution Z transform, required for cutting different ema.
Yours truly ...
LazEngineer, Electrical Engineer

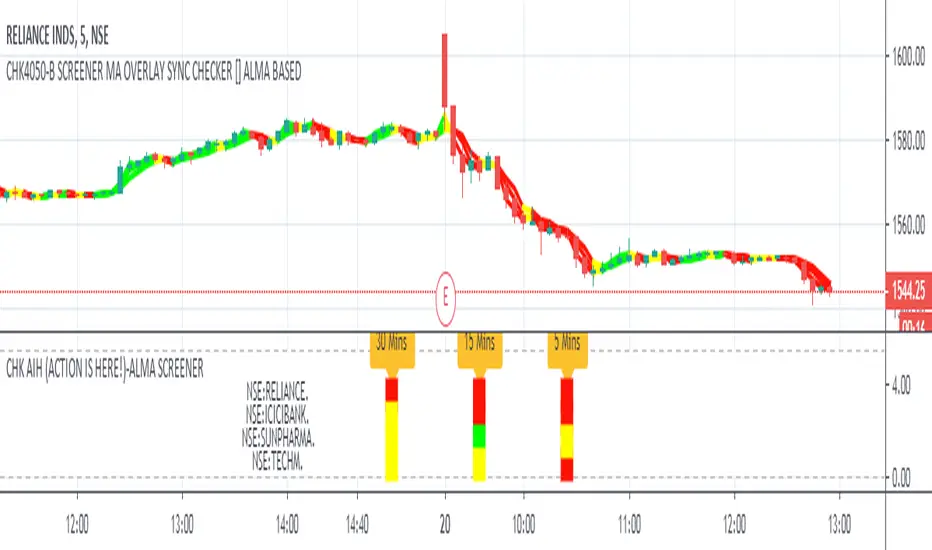
CHK AIH (ACTION IS HERE!)-ALMA SCREENERWe do not like to stare at the screen whole day, instead we like to jump where the
action is.... The Screener was written with this in mind
CHK AIH (ACTION IS HERE!)-ALMA BASED SCREENER
FEATURES
User can enter 3 Resolutions of his/her choice
User can select 3 Mov Avg Length of his her choice, which would be identical for all the three timeframes
User can enter stock basis his/her region's stock exchange
User can shift the screener left or right if not visible in a Multiscreen mode
Uses ALMA (Arnaud Legoux Mov Avg) as it smooth and reactive
Code is also provided below of MTF ALMA Moving Average OVERLAY on which this screener is based
LOGIC
For a particular timeframe If all the Moving Average are calibrated in one direction, it will show the requisite color.
For Example in an ideal scenario for a bull trend ALMA(5)> ALMA(13) > ALMA(21), once such a situation is identified, the screener will show green.
Yellow means lack of Calibration.
When 3 timeframes are calibrated, it becomes a high Probability Trade
BUGS
It is not allowing to enter the D/W/M timeframes, timeframe in numbers ...5/15/60 is working fine. If somebody can fix it
it would be great
LIMITATIONS
Because of TV's limitations only 4 scrips can be entered, however one add the indicator again with new scrips
//////////// CREDITS ////////////////////////////////////////////////////////////////////////////////////
//// hxxps://www.tradingview.com/script/rwdgyEZe/
/// Thank You Inno14 for graciously sharing your work. Your work has helped immensely !!!
////////////////////////////////////////////////////////////////////////////////////////////////////////
ICICIBANK
TECHMAHINDRA
YESBANK
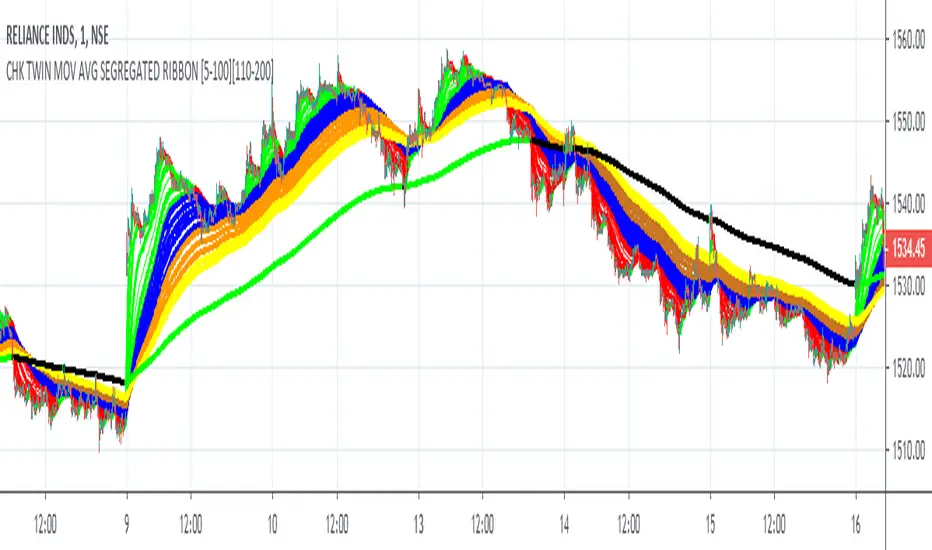
FALSE BREAKOUT NO PROBLEM !! CHK TWIN MOV AVG SEGREGATED RIBBON PROBLEM DEFINITION 1 : To Avoid False Breakouts
PROBLEM DEFINITION 2 : To Ascertain if the trend has changed when a Stock opens with a Gap up or Gap Down
## PROBABLE SOLUTION : Use a Moving Average with lot of latency
## PROBLEM WITH ABOVE SOLUTION : Misses on lot of trades, Late exits leads to drain on winning trades
S O L U T I O N
An Indicator which plots two different types of Moving Averages at the same time
For the MA length 5-100 a fast plot of choice
For the MA Length 110-200 a plot with a lag to ascertain the trend
And then ONE LAST MAN STANDING with even bigger MA length for a lagging indicator to save the day
This indicator gives one 9X9 = 81 Permutation Combinations to look at the markets
One can devise strategies basis if one particular MA Type has crossed another MA Type
Feel free to post the strategies you have come out with!
//// CREDITS AND ACKNOWLEDGEMENTS //////////////////////////////////////////////////////////////////
Following contributors helped the author ::
Credits to Neobutane for his Multiple Type Mov. Avg. Guppy at ......
hxxps://www.tradingview.c0m/script/UQAv1U0c-MA-Study-Different-Types-and-More-NeoButane/
Credits to Jose5770 for sharing Jurik MA code at .....
hxxps://www.tradingview.c0m/script/uqYvkHna-Trend-Direction-Force-Index/
Appreciate and Thank You for sharing your work.
//////////////////////////////////////////////////////////////////////////////////////////////////////
P.S You might notice in the code that the few plots are skipped. It is done to fasten the indicator without compromising
on the functionality