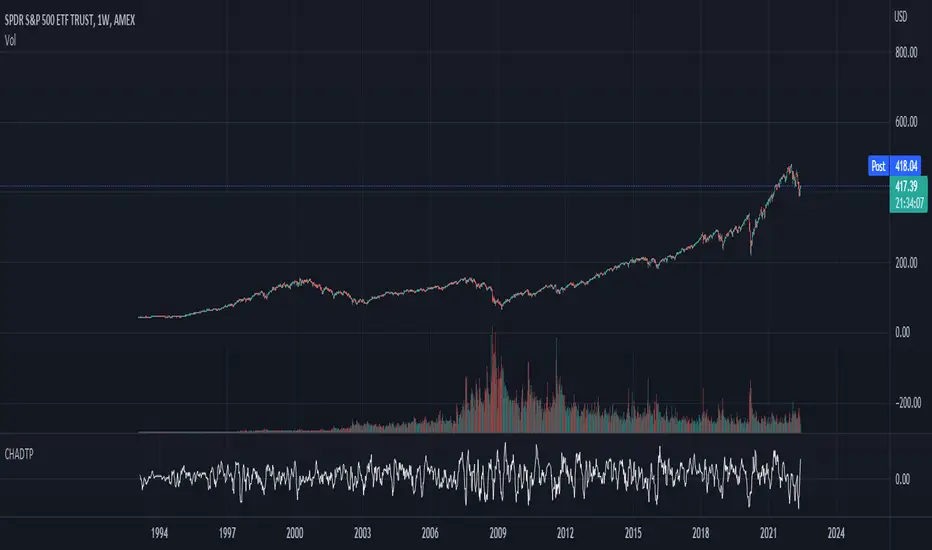
Connors-Hayward Advance-Decline Trading PatternsThe following is an excerpt from Investment Secrets of a Hedge Fund Manager
"The Connors-Hayward Advance-Decline Trading Pattern (CHADTP) is a proprietary indicator we use to identify short- and intermediate-term overbought and oversold conditions for the stock market and the S&P 500 futures market...
Construction of the CHADTP indicator is simple:
Add the past five day's advancing issues from the New York Stock Exchange.
Add the past five day's declining issues from the NYSE.
Subtract #2 from #1.
Divide by five.
Here are the two rules to trade CHADTP:
When the five-day reading is above +400, the market is overbought; and when the five day reading is below -400, the market is oversold.
Unfortunately, just because the indicator is -400 does not mean we can blindly buy the market, and just because the indicator is +400 does not mean we should be a seller of the market.
Whenever we get an overbought or oversold reading, we wait for a specific price reversal before entering. When the CHADTP number is +400 or more, we will sell the market only after the S&P 500 futures trade .10 points below the previous day's low. For example, if we get a reading of +422 and today's low is 453.80 we will take a sell signal only if the market trades at 453.70 or below tomorrow. If tomorrow the market low is 454.60, and the CHADTP is above 400, we will only sell if the market trades at 454.50 or below the next day, and so on. On the buy side, if today's CHADTP number is -400 or less, we will buy only after tomorrow's S&P trades .10 points above today's high, and so on."
Note from Technicus Capital:
This method was created in 1995. Today, the volume and volatility of markets is much more significant and therefore the original overbought/oversold levels are no longer relevant.
Linia Spadków Wzrostów
Advance/Decline Line [IQ]Advance/Decline Line is a Market Breath indicator.
A/D line calculates a ratio between total number stocks advancing and total number of stocks in one day, providing another way to grasp the market breath at any moment.
We think the indicator covers the whole market, as we use data from the three main exchanges: NYSE, NASDAQ and AMEX.
The New York Stock Exchange (NYSE), nicknamed "The Big Board") is by far the world's largest stock exchange by market capitalization of its listed companies.
The Nasdaq Stock Market (NASDAQ) is ranked second on the list of stock exchanges by market capitalization of shares traded, behind the New York Stock Exchange.
The American Stock Exchange (AMEX) is the third largest stock exchange in the U.S. after the NYSE and the NASDAQ, and handles approximately 10% of all American trades.
How to interpret it:
Green columns mean more than 50% of NASDAQ stocks are advancing, red columns mean more than 50% of NASDAQ stocks are declining.
Green values above the top band mean correlation to the upside, red values bellow the low band mean correlation to the downside.
Correlation means rising probability of capitulation (to the upside or to the downside) and is market by a white bar (as signal).
Important:
For a better interpretation, the Advance/Decline Line indicator should be used in conjunction with other indicators (volatility, volume, etc.).

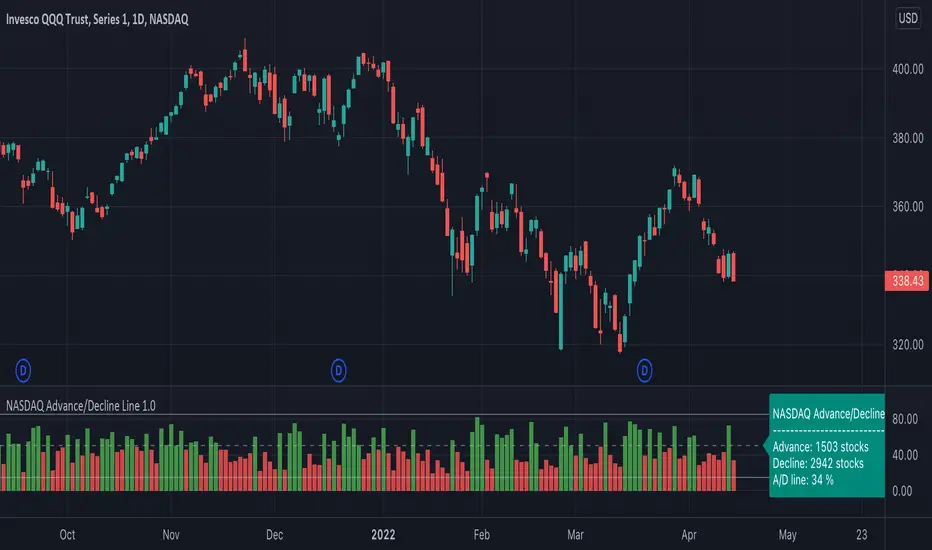
NASDAQ Advance/Decline Line 1.0NASDAQ Advance/Decline Line is a Market Breath indicator.
Brought to you by IQ-trading (Andrei Bogdan) via Trading View Pine script. If you find this helpful in anyway, please leave a like!
A/D line calculates a ratio between total number of NASDAQ stocks advancing and total number of NASDAQ stocks in one day, providing another way to grasp the market breath at any moment.A
Green columns mean more than 50% of NASDAQ stocks are advancing, red columns mean more than 50% of NASDAQ stocks are declining.
Green values above the top band mean correlation to the upside, red values bellow the low band mean correlation to the downside.
Correlation means rising probability of capitulation (to the upside or to the downside).
For a better interpretation, NASDAQ Advance/Decline Line should be used in conjunction with other indicators (volatility, volume, etc.).
--------------------
NASDAQ here refers to the totality of assets listed on the NASDAQ exchange, not to the Nasdaq Composite index or the Nasdaq100 index.
NASDAQ is the second-largest stock exchange on earth, and operates the two major stock indexes based on companies that trade on its exchange: the Nasdaq Composite and the Nasdaq 100.
The Nasdaq Composite tracks the performance of more than 3,000 stocks listed on the Nasdaq while the Nasdaq 100 captures the performance of the exchange’s largest non-financial companies.
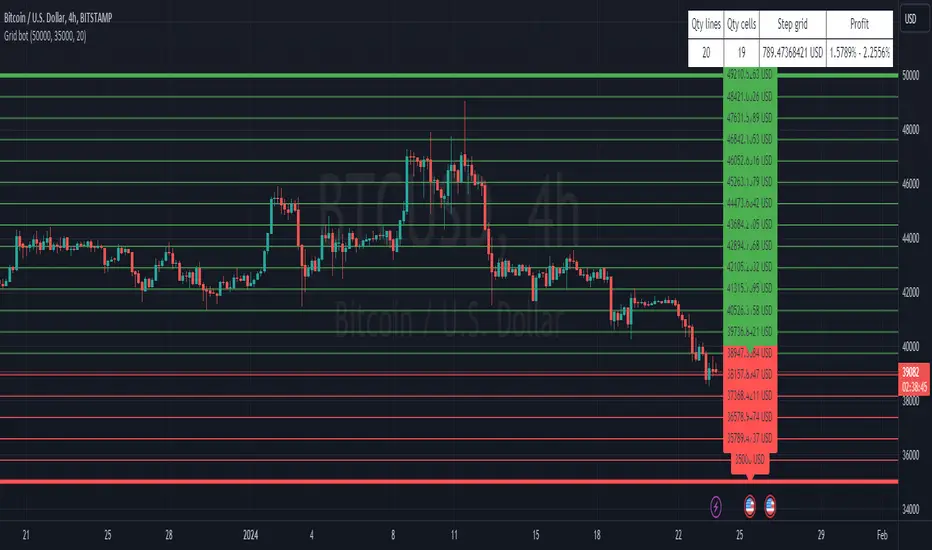
3commas GRID bot VisualisationHello everyone
This is a grid display indicator for a 3-comma grid bot.
Just enter the upper and lower borders of your grid and the number of grid cells in the indicator settings.
It's simple!
Advance Decline Line with Divergence Finder
The advance/decline line (A/D) is a breadth indicator used to show how many stocks are participating in a stock market rally or decline.
When major indexes are rallying, a rising A/D line confirms the uptrend showing strong participation.
If major indexes are rallying and the A/D line is falling, it shows that fewer stocks are participating in the rally which means the index could be nearing the end of its rally.
When major indexes are declining, a falling advance/decline line confirms the downtrend.
If major indexes are declining and the A/D line is rising, fewer stocks are declining over time, which means the index may be near the end of its decline.
For more info: www.investopedia.com

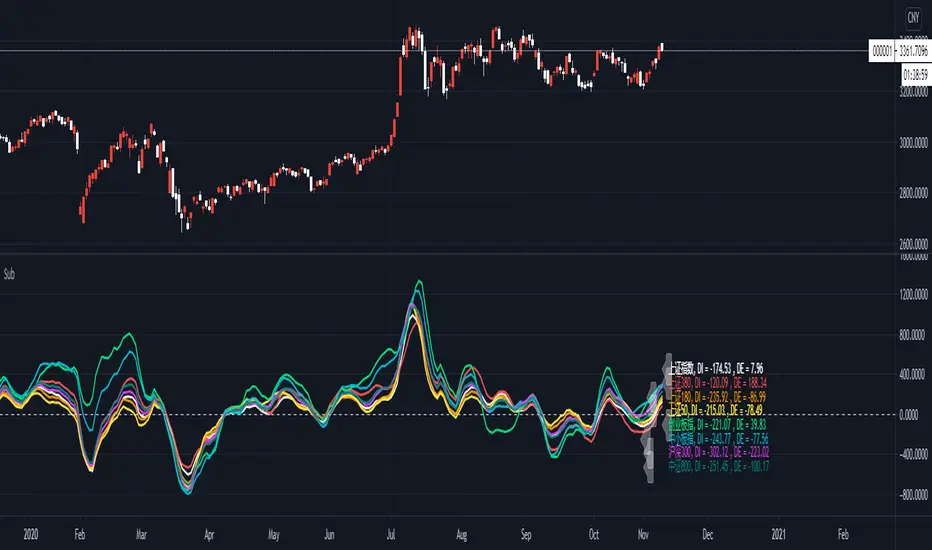
Deviation rate of Chinese stock market index// Deviation rate of Chinese stock market index
//The purpose of the indicator is to monitor the Chinese stock market index deviation rate to the 20EMA, so each major index can be observed longitudinally at the same time.
//This indicator give signal of which Index or instrument should you be focused and when should you enter the market to get a long or short position.
//The chart shows the deviation rate between the current price of each major index current price to the 20EMA.
//Also it count a deductive ratio between current price to the previous 20th bar close price to (which lead to the slope of the 20SMA)
//When using, adjust the corresponding period according to the chart period.
//The word DI (divergence) represents the deviation value between the current price and 20EMA, and DE (deduction) represents the deviation value between the current price and the 20 deduction price.
//Attention marker: The marker tells one of the moving average (EMA20 and MA20) is turning towards the opposite direction. When DE and DI one is plus , one is minus attention marker appear on the instrument title.
//Take the bull trend as an example. If the price is higher than ema20, the EMA20 is turning.If the price is higher than the close price of the bar 20 days ago , the sma20 is turning.
//When the ema20 has not turned around to opposite direction , and the ma20 is turning , the deviation rate of the moving average and the deviation rate of the deductible price are different in positive or negative.
//The marker as a reminder will appear on the instrument title.
//How to use this watchlist: You can freely replace the major indices with the instrument you are focused.
NYSE Advance/DeclineAn indicator for traders who trade intraday on the US market. It makes use of the symbols made available by TradingView to show the number of advancing vs declining stocks.
The GREEN AREA represents advancing issues. The INTENSE GREEN AREA represents the advancing issues at daily high.
The RED AREA represents declining issues. The INTENSE RED AREA represents the declining issues at daily low.
The part above the BLUE LINE represents issues which are trading above their VWAP (volume-weighted average prices).

BANKNIFTY Adv/Dec1) BANKNIFTY Index Advance-Decline count
2) Each session, it reads the number of stock are +Ve or -Ve
3) Whichever the side +Ve or -Ve side moving stock is more than count will be plotted
4) at +/- 7 drawn a dotted line if Count is > = +/-7 Nifty is moving in a strong army
Eg:-
in the current session, 7 Stock is moving in +Ve direction & 6 are in -Ve direction
7 count will be plotted in the chart

[KY]Cumulative Advance Decline Line(1) What is Cumulative A/D Line?
Cumulative A/D Line is a total of advancing issues - declining issues of all time.
This can be used to know long-term trend.(weeks, months long)
(2) How to use this?
- Add this script to your chart.
- Select the market from "Nasdaq", "NYSE", "Nasdaq+NYSE"
- You could change the moving average.

SparklinesA sparkline is a very small line chart, typically drawn without axes or coordinates (the presented implementation has coordinates). It presents the general shape of the variation (typically over time) in some measurement, in our case - market price, in a simple and highly condensed way. The approach has a long history and is widespread nowadays.
The main purpose is to be aware of the moves on specific instruments using only one lead chart as well as to save as much of a free working place on chart as possible.
Use cases:
Standalone
Merge of two instances
Merge with another indicator
A screener
* on the preview
If you have any questions you can contact me either via private messages here or via Telegram

ADD for SPX intraday (NYSE Adv-Decl) -Tom1traderThis is the NYSE Advancers - decliners which the SPX pretty much follows. You can chart it like any index (ADD -NYSE $ADV MINUS $DECL) but I find it more useful in a separate panel with colors for direction.
The level gives an idea of days move (example: plus or minus 500 is not much movement through the session) but I follow the direction as when more stocks advance (green) or decline (red) the index tends to track it pretty closely.
On SPX, SPY and correlateds - very useful for intra-day trading (Scalping or 0DTE option trades) but not for higher time frames at all. If you chart the ADD in a chart and compare 5 minute to daily you will see what I mean.
I left it at 5 minutes timeframe which displays well on any intraday chart. You can change it by changing the "5" in the security function on line 13 to what you want ("1" 1 minute, "15" 15 minutes) or change it to timeframe.period (no quotes) so that it will follow the timeframe of the current chart. I like 5 min as it displays better on higher timeframes i.e. 15 min. or hour.
A simple moving average with a length of 10 is added to help gauge momemtum.
Hope this helps with trading or scripting ideas, questions or feed back welcome. Keep Smiling.

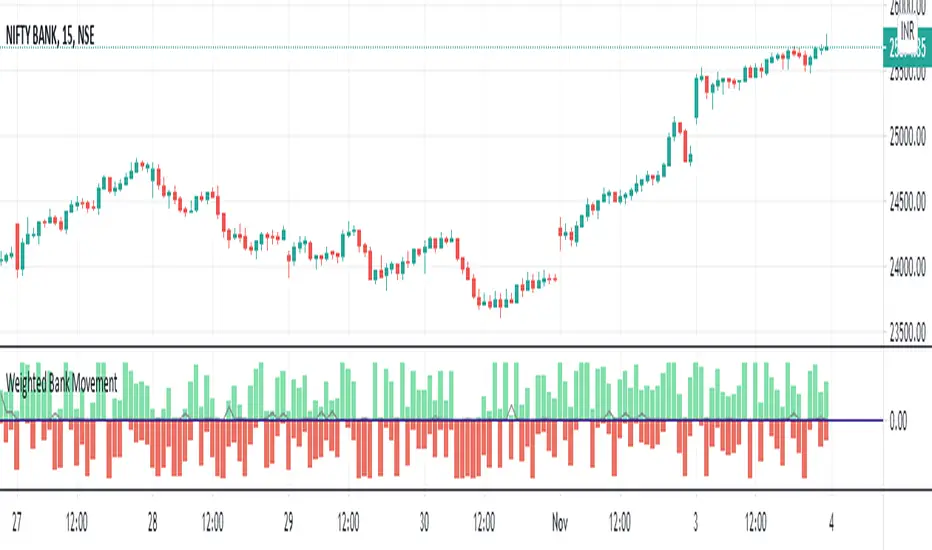
Weighted Bank MovementThe indicator comprises of a solid line that moves from -100 to +100 signifying the % of weighted movement among 12 banking stock constituting to the BANK NIFTY movement.
A positive value denotes the percentage of banks among the 12 banks that are trading above the previous HLC average ( High , Low , Close ) and vice versa a negative value denotes the percentage of banks trading below the previous HLC ( High , Low , Close ) average.
Comments and feedback are welcome.
Should you have any doubts or wish to access the script then please feel free to DM me.
Price Streak Is Another Way to Spot TrendsPrice is never wrong, but sometimes reading it can be tricky.
Movements in the broader market or a sector can distract from a symbol that's been steadily trending in one direction or another. Sometimes the beginning of a move can also be so subtle that it flies under most people's radar.
Price Streak can help overcome these limitations by tracking consecutive up/down periods. It plots an easy-to-read color-coded histogram.
Because it simply counts the candles in a trend, Price Streak can give a clearer picture than magnitude-biased indicators like relative strength or MACD.
Applying Price Streak to the daily chart of Bitcoin Dominance , we find something very interesting right now: the longest drop since March 2017.
That moment in history, almost three years ago, marked the beginning of the last Altcoin bull market. Ethereum , for example, went from roughly $60 to over $1,300 in the following nine months.
While past performance isn't a guarantee of future results, this illustrates how sustained price moves can reveal changes in character.
Based on Price Streak's current reading, it may support the idea of another Altcoin cycle beginning now.

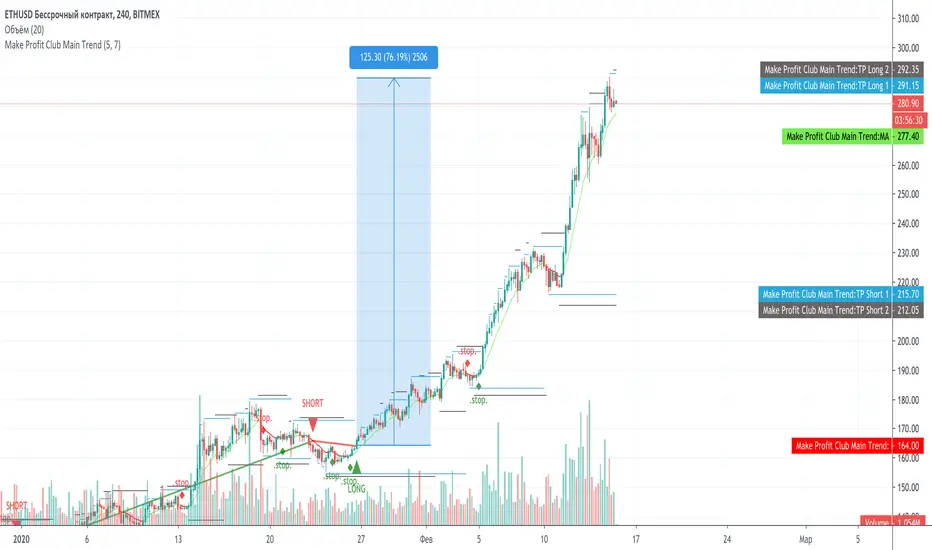
Make Profit Club Main TrendThe main trend indicator.
Suitable for 1H-1D, on any exchange and on any coin, currency pair, index.
There are basic settings that allow you to adjust the indicator individually for each situation.
Dr_Pivots High & Low Trend Line- I'd like to find a pattern more easily on the chart.
- This script might give you a better view of the support and resistance lines.

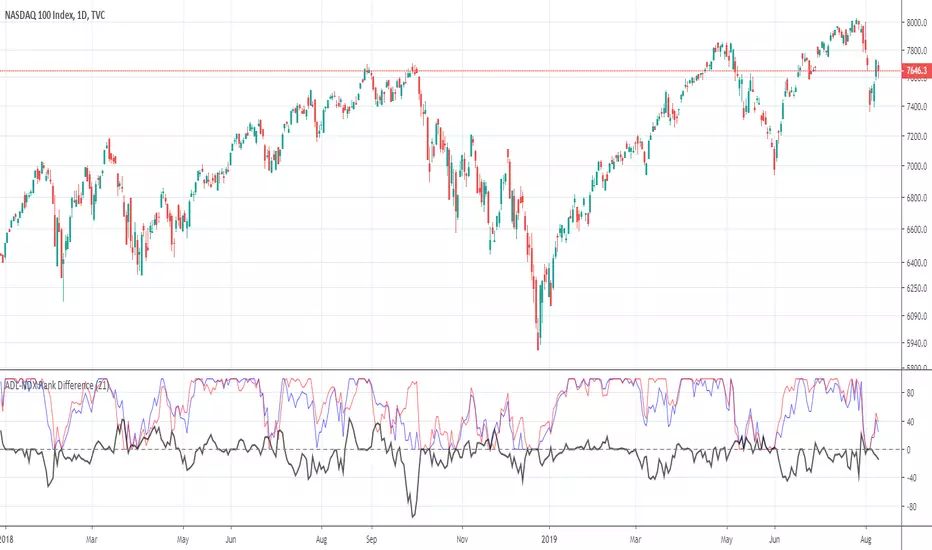
ADL-NDX Rank Difference-Buschi
English:
An expansion of the Advance Decline Line of the NASDAQ. It can be interesting to compare the Advance Decline Line with the corresponding benchmark index. I therefore made a ranking (0 to 100) based on the performance over the last days (default: 21 days). The difference is the target figure and ranges between -100 (bearish divergence) to +100 (bullish divergence).
Deutsch:
Eine Erweiterung der Advance Decline Line der NASDAQ. Oft möchte man den Verlauf der Advance Decline Line mit dem zugehörigen Leitindex vergleichen. Daher habe ich für beide ein Ranking (0 bis 100) erstellt auf Basis des Verlaufs über die letzten Tage (Standardwert: 21 Tage). Die Differenz stellt dabei die Zielgröße dar und schwankt zwischen -100 (bärische Divergenz) und +100 (bullische Divergenz).
ADL-SPX Rank Difference-Buschi
English:
An expansion of the Advance Decline Line of the NYSE. It can be interesting to compare the Advance Decline Line with the corresponding benchmark index. I therefore made a ranking (0 to 100) based on the performance over the last days (default: 21 days). The difference is the target figure and ranges between -100 (bearish divergence) to +100 (bullish divergence).
Deutsch:
Eine Erweiterung der Advance Decline Line der NYSE. Oft möchte man den Verlauf der Advance Decline Line mit dem zugehörigen Leitindex vergleichen. Daher habe ich für beide ein Ranking (0 bis 100) erstellt auf Basis des Verlaufs über die letzten Tage (Standardwert: 21 Tage). Die Differenz stellt dabei die Zielgröße dar und schwankt zwischen -100 (bärische Divergenz) und +100 (bullische Divergenz).

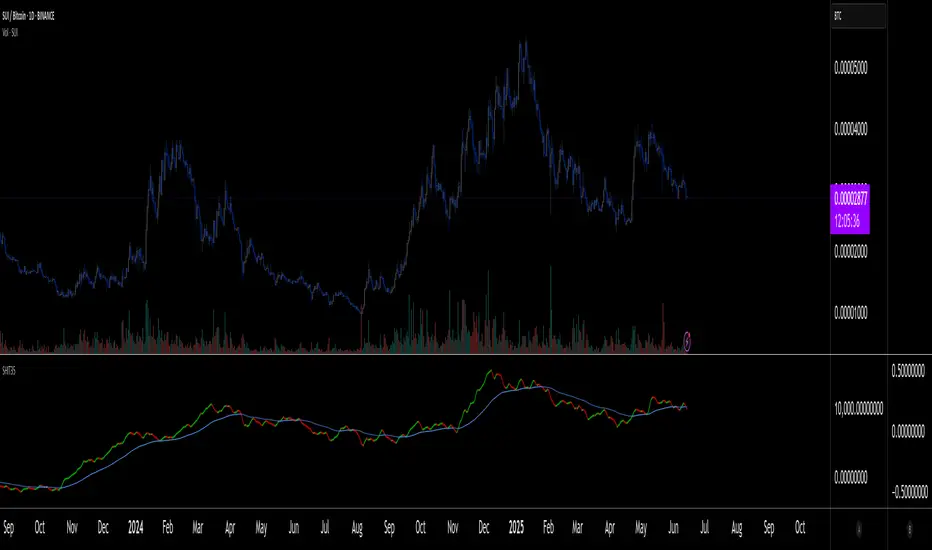
SHIT35 Alt Index (ROC or Volume) [LucF]SHIT35 is an index of 35 Binance alt/BTC pairs. It provides traders with a more reliable read of BTC pairs price movement than the often uncorrelated USD market cap standard.
Because it must read data coming from 35 markets, SHIT35 is painfully slow and should be kept hidden most of the time. Its features will hopefully seduce traders in using it nonetheless for market analysis.
Features
The Index can be calculated using 4 different modes:
1. Total of instant rate of change for all 35 markets ,
2. Cumulative total of ROCs,
3. Average of ROCs,
4. Plus/Minus volume (an aggregate OBV, if you will).
Select only one of the methods at a time to prevent confusion between modes.
An option allows showing the correlation between the Index as it is configured, and another instrument (CRYPTOCAP:TOTAL2 by default).
Markers can be used to identify abnormal movements in the Index. They are generated using Index exits from Bollinger bands.
The chart shows the Index with, from top to bottom, the default mode with BTC pairs, with USDT pairs, then mode 2 and 4 for BTC pairs.
Index Components
The Index is not weighed. The 35 instruments composing the index all have equivalents in the USDT quote currency on Binance, so you can easily change to those pairs using the Settings. Choosing another exchange or quote currency will require modifications to the list of instruments in the indicator’s code, since if one of the markets cannot be found, the indicator will not work. If the instrument exists but has no history for some bars, zero values will be used for them.
Watchlists
I have created a watchlist for the 35 markets in each of the BTC and USDT quote currencies. To import the watchlists, save the text you’ll find at these links in a file named the way you want your watchlist to be named and import them using the “Import Watchlist…” function.
BTC Watchlist: pastebin.com
USDT Watchlist: pastebin.com
Alerts
You can define alerts on any combination of markers you configure. After defining the markers you want the alert to trigger on, make sure you are on the interval you want the alert to be monitoring at, then create the alert, select the indicator, use the default alert condition and choose your triggering window (usually “Once Per Bar Close”). Once the alert is created, you can change the indicator's inputs with no effect on the alert.
ADVN-DECLAdvancing - Declining issues indicator which you can use for Bitcoin trading if you, like me, believe that cryptocurrency is highly correlated with the activity on the stock exchanges (yes, the PROs are here, we just didn't know it yet)
This indicator is based on showing the data, as much as possible, as it is, and not messing it up by calculating stuff. Calculation should be used to better understand what the data represents, and not to show beatiful things which are, in fact, not present.
You could, for example, take ADVN and DECL, calculate rma() moving averages and make a RSI out of it. The result is very interesting when applied on the daily time frame, but not as useful for trading.
By the way, I recommend enabling this option:
Right click - Settings - Timezones / Sessions
Please check "Extended hours (Intraday Only)"
I could do it in code with the ticker() function, but I'm under the impression that then, free TV users would not be able to use the indicator.

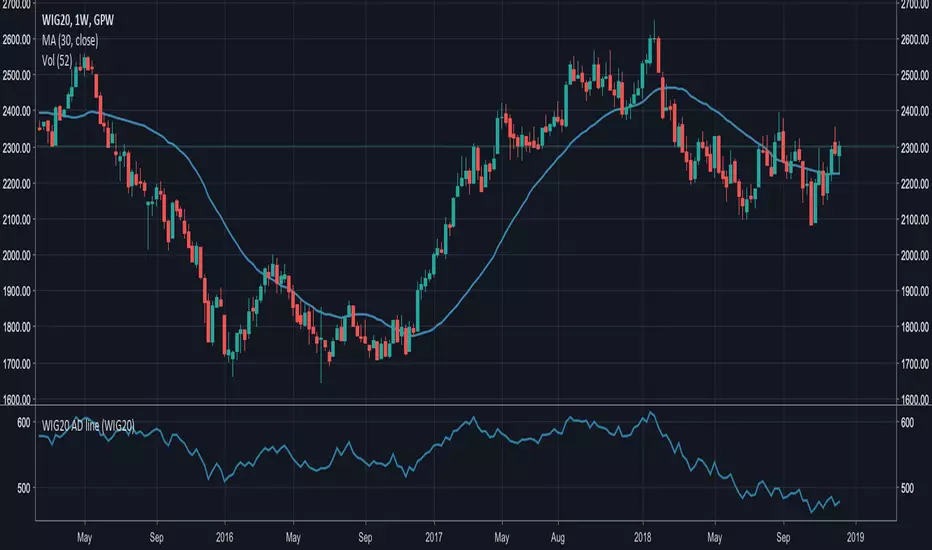
WIG20/30 Advance-decline LineAdvance-decline line for Warsaw Stock Exchange (GPW)
EN: Since GPW doesn't give us advance/decline data similar to NYSE, it's not hard to calculate it manually (WIG20 and WIG30 - can be changed in settings)
PL: Wskaźnik A/D line dla giełdy Warszawskiej (działa dla WIG20 i WIG30)
HODL5 Market Cap Advance Decline Line [NeoButane]The Advance-Decline Line (AD Line) is a breadth indicator based on Net Advances, which is the number of advancing stocks less the number of declining stocks. Net Advances is positive when advances exceed declines and negative when declines exceed advances. The AD Line is a cumulative measure of Net Advances. While the shape of the AD Line is important, the actual value holds no meaning.
Currently, this version of the AD Line is based on the Net Advances of the market capitalization for the 4* coins in the Amun Crypto Basket Index. Because the cryptocurrency market moves in a homogeneous nature, there are more confirming moves than divergences compared to something like an AD Line of the NYSE.
*BCH has been removed, likely because of its split fork, but has an option to add. For accuracy, include BCH(ABC) prior to live trading of the index; 21 Nov. 2018 and before.
The current index is based on: BTC, ETH, XRP, and LTC.
Market cap is calculated as (current USD price * circulating supply).
Market cap is from TradingView's CRYPTOCAP tickers
stockcharts.com
www.amun.com

Advance Decline Line NASDAQ-BuschiThis script shows the Advance Decline Line of the NASDAQ (dark blue)in comparison to the NDX (light blue). There is also a difference line of the two series (red).
Both are indexed to current values to allow a better overview. Series can be smoothed via the length of the Moving Average.
I consider it more of a work in progress. I work on a more inuitive kind of presentation.

Advance Decline Line NYSE-BuschiThis script shows the Advance Decline Line of the NYSE (dark blue)in comparison to the SPX (light blue). There is also a difference line of the two series (red).
Both are indexed to current values to allow a better overview. Series can be smoothed via the length of the Moving Average.
I consider it more of a work in progress. I work on a more inuitive kind of presentation.
