Specter Trend Cloud [ChartPrime]⯁ OVERVIEW
Specter Trend Cloud is a flexible moving-average–based trend tool that builds a colored “cloud” around market direction and highlights key retest opportunities. Using two adaptive MAs (short vs. long), offset by ATR for volatility adjustment, it shades the background with a gradient cloud that switches color on trend flips. When price pulls back to retest the short MA during an active trend, the script plots diamond markers and extends dotted levels from that retest price. If price later breaks through that level, the extension is terminated—giving traders a clean visual of valid vs. invalid retests.
⯁ KEY FEATURES
Multi-MA Core Engine:
Choose from SMA, EMA, SMMA (RMA), WMA, or VWMA as the base. The indicator tracks both a short-term MA (Length) and a longer twin (2 × Length).
Volatility-Adjusted Offset:
Both MAs are shifted by ATR(200) depending on trend direction—pulling them down in uptrends, up in downtrends—so the cloud reflects realistic breathing room instead of razor-thin bands.
Gradient Trend Cloud:
Between the two shifted MAs, the script fills a shaded region:
• Aqua cloud = bullish trend
• Orange cloud = bearish trend
Gradient intensity increases toward the active edge, providing a visual sense of strength.
Trend Flip Logic:
A flip occurs whenever the short MA crosses above or below the long MA. The cloud instantly changes color and begins tracking the new regime.
Retest Detection:
During an ongoing trend (no flip), if price retests the short MA within a 5-bar “cooldown,” the tool:
• Marks the retest with diamond shapes below/above the bar.
• Draws a dotted horizontal line from the retest price, extending into the future.
Automatic Level Termination:
If price later closes through that dotted level, the line disappears—keeping only active, respected retest levels on your chart.
⯁ HOW IT WORKS (UNDER THE HOOD)
MA Calculations:
ma1 = MA(src, Length), ma2 = MA(src, 2 × Length).
Trend = ma1 > ma2 (bull) or ma1 < ma2 (bear).
ATR shift offsets both ma1 and ma2 by ±ATR depending on trend.
Cloud Fill:
Plots ma1 and ma2 (invisible for long MA). Uses fill() with semi-transparent aqua/orange gradient between the two.
Retest Logic:
• Bullish retest: ta.crossover(low, ma1) while trend = bull.
• Bearish retest: ta.crossunder(high, ma1) while trend = bear.
Only valid if at least 5 bars have passed since last retest.
When triggered, it stores bar index and price, draws diamonds, and extends a dotted line.
Level Clearing:
If current high > retest upper line (bearish case) or low < retest lower line (bullish case), that line is deleted (stops extending).
⯁ USAGE
Use the cloud color as the higher-level trend bias (aqua = long, orange = short).
Look for diamonds + dotted lines as pullback/retest zones where trend continuation may launch.
If a retest level holds and price rebounds, it strengthens confidence in the trend.
If a retest level is broken, treat it as a warning of weakening trend or possible reversal.
Experiment with MA Type (SMA vs. EMA, etc.) to align sensitivity with your asset or timeframe.
Adjust Length for faster flips on low timeframes or smoother signals on higher ones.
⯁ CONCLUSION
Specter Trend Cloud combines trend detection, volatility-adjusted shading, and retest visualization into a single tool. The gradient cloud provides instant clarity on direction, while diamonds and dotted retest levels give you tactical entry/retest zones that self-clean when invalidated. It’s a versatile trend-following and confirmation layer, adaptable across multiple assets and styles.
Wskaźniki i strategie

Mean Reversion Probability Zones [BigBeluga]🔵 OVERVIEW
The Mean Reversion Probability Zones indicator measures the likelihood of price reverting back toward its mean . By analyzing oscillator dynamics (RSI, MFI, or Stochastic), it calculates probability zones both above and below the oscillator. These zones are visualized as histograms, colored regions on the main chart, and a compact dashboard, helping traders spot when the market is statistically stretched and more likely to revert.
🔵 CONCEPTS
Mean Reversion : The tendency of price to return to its average after significant extensions.
Oscillator-Based Analysis : Uses RSI, MFI, or Stochastic as the base signal for detecting overextension.
Probability Model : The probability of reversion is computed using three factors:
Whether the oscillator is rising or declining.
Whether the oscillator is above or below user-defined thresholds.
The oscillator’s actual value (distance from equilibrium).
Dual-Zone Output :
Upper histogram = probability of downward mean reversion.
Lower histogram = probability of upward mean reversion.
Historical Extremes : The dashboard highlights the recent maximum probability values for both upward and downward scenarios.
🔵 FEATURES
Oscillator Choice : Switch between RSI, MFI, and Stochastic.
Customizable Zones : User-defined upper/lower thresholds with independent colors.
Probability Histograms :
Above oscillator → down reversion probability.
Below oscillator → up reversion probability.
Colored Gradient Zones on Chart : Visual overlays showing where mean reversion probabilities are strongest.
Probability Labels : Percentages displayed next to histogram values for clarity.
Dashboard : Compact table in the corner showing the recent maximum probabilities for both upward and downward mean reversion.
Overlay Compatibility : Works in both chart pane and sub-pane with oscillators.
🔵 HOW TO USE
Set Oscillator : Choose RSI, MFI, or Stochastic depending on your strategy style.
Adjust Zones : Define upper/lower bounds for when oscillator values indicate strong overbought/oversold conditions.
Interpret Histograms :
Orange (upper) histogram → higher chance of a pullback/downward mean reversion.
Green (lower) histogram → higher chance of upward reversion/bounce.
Watch Gradient Zones : On the main chart, shaded areas highlight where probability of mean reversion is elevated.
Consult Dashboard : Use the “Recent MAX” values to understand how strong recent reversion probabilities have been in either direction.
Confluence Strategy : Combine with support/resistance, order flow, or trend filters to avoid counter-trend trades.
🔵 CONCLUSION
The Mean Reversion Probability Zones provides traders with an advanced way to quantify and visualize mean reversion opportunities. By blending oscillator momentum, threshold logic, and probability calculations, it highlights when markets are statistically stretched and primed for reversal. Whether you are a contrarian trader or simply looking for exhaustion signals to fade, this tool helps bring structure and clarity to mean reversion setups.

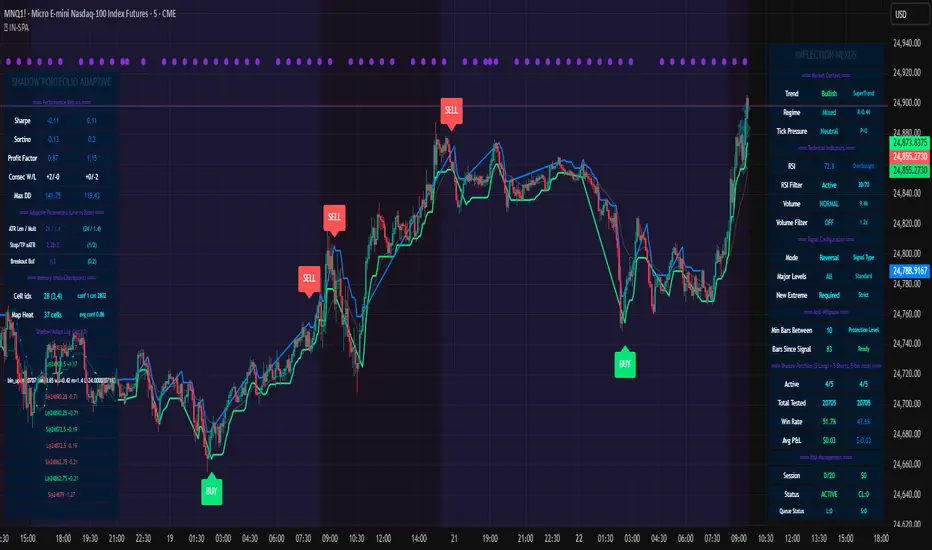
INFLECTION NEXUS - Shadow Portfolio AdaptiveINFLECTION NEXUS - SPA (Shadow Portfolio Adaptive)
Foreword: The Living Algorithm
For decades, technical analysis has been a conversation between a trader and a static chart. We draw our lines, we apply our indicators with their fixed-length inputs, and we hope that our rigid tools can somehow capture the essence of a market that is fluid, chaotic, and perpetually evolving. When our tools fail, we are told to "adapt." But what if the tools themselves could learn that lesson? What if our indicators could adapt not just for us, but with us?
This script, INFLECTION NEXUS - SPA, is the first step in that direction. It is an experimental framework, a research project shared publicly, built around a radical new core: the Shadow Portfolio Adaptive (SPA) Engine . Let's be clear from the outset: the signal logic you see—the buy and sell labels—is a refined version from my previous work, "Turning Point." The signals are not the star of this show. This entire publication is a showcase of the groundbreaking, self-learning engine that now powers them.
You will likely feel that this system is overwhelmingly complex when you first load it. That is by design. This is not another simple crossover indicator. This is a look under the hood of a system designed to emulate the perpetual learning cycle of a human mind. My goal with this document is to break down every single component, every color, every number, into simple, understandable pieces. We will go through this step-by-step, so that by the end, you will not only understand how it works, but you will appreciate the depth of the analysis it performs on your behalf.
This is a beta release. Not all planned features are fully functional, and I will be updating it as the research continues. But the core engine is here, and it represents a new paradigm. Prepare to engage with a script that doesn't just analyze the market—it actively seeks to understand it.
Chapter 1: The Paradigm Shift - Why the SPA Engine is a Leap Forward
To grasp the innovation here, we must first deconstruct the old way of thinking about "adaptive" indicators.
Part A: The Traditional Model - Driving by the Rear-View Mirror
Imagine a self-driving car that can only make adjustments after it has already completed a trip. This is, in essence, how most "adaptive" trading systems work. Their process is fundamentally reactive and inefficient:
Wait for a Signal: The system is idle until its specific, hard-coded logic (e.g., a moving average crossover) generates a buy or sell signal.
Wait for an Outcome: It then waits for that entire trade to play out and close, resulting in a win or a loss.
Collect Limited Data: It only learns from the performance of its own signals. If the market is moving but not generating signals, the system is blind and learns nothing.
Require a Massive Sample Size: To avoid making changes based on random luck, it must wait for a huge number of trades—often 50, 100, or even more—before it has a statistically significant sample of wins and losses.
Make a Belated Adjustment: Finally, after this long "warm-up" period, it will make a tiny, retrospective adjustment to its parameters.
The fatal flaw is obvious: this model is always adapting to a market that no longer exists. It is slow, data-starved, and hopelessly biased by its own signal logic.
Part B: The SPA Model - The Proactive Co-Pilot
The Shadow Portfolio Adaptive (SPA) engine is a complete re-imagining of this process. It is not a reactive historian; it is a proactive, ever-present co-pilot, constantly learning and recalibrating.
It Never Waits: The SPA engine does not wait for a signal to learn. From the moment you load it on the chart, its Shadow Portfolio begins running constant, 5-bar long and short trades in the background. It is not testing a "signal"; it is testing the very fabric of the market, bar by bar.
It is Data-Saturated: Because it learns from every 5-bar slice of price action, the SPA engine gathers a colossal amount of unbiased data. While a traditional system might learn from one trade every 50 bars, the SPA engine learns from a long and a short trade every single bar after its initial cycle.
Instantaneous Market Awareness - The End of the "Warm-Up": This is the core innovation. A traditional adaptive system is effectively useless for the first 50-100 trades. The SPA engine's warm-up period is exactly five bars . On the 6th bar of the chart, the first shadow trade closes, a data point is generated, and the learning process begins. From the 6th bar onward, the engine is market-aware and capable of making intelligent adjustments. The SPA engine isn't adapting to old wins and losses. It is adapting, in near real-time, to the market's ever-shifting character, volatility, and personality.
Chapter 2: The Anatomy of the SPA Engine - A Toddler's Guide to a Complex Brain
The engine is composed of three primary systems that work in a beautiful, interconnected symphony. Let's break them down.
Section 1: The Shadow Portfolio (The Information Harvester)
What it is, Simply: Think of this as the script's eyes and ears. It's a team of 10 virtual traders (5 long, 5 short) who are constantly taking small, quick trades to feel out the market.
How it Works, Simply: On every new bar, a new "long" trader and a new "short" trader enter the market. Exactly 5 bars later, they close their positions. This cycle is perpetual and relentless.
The Critical 'Why': Because these virtual traders enter and exit based on a fixed time (5 bars), not on a "good" or "bad" signal, their results are completely unbiased . They are simply measuring: "What happened to price over the last 5 bars?" This provides the raw, untainted truth about the market's behavior that the rest of the system needs to learn effectively.
The Golden Metric (ATR Normalization): The engine doesn't just look at dollar P&L. It's smarter than that. It asks a more intelligent question: "How much did this trade make relative to the current volatility?"
Analogy: Imagine a flea and an elephant. If they both jump 1 inch, who is more impressive? The flea. The SPA engine understands this. A $10 profit when the market is dead quiet is far more significant than a $10 profit during a wild, volatile swing.
The Formula: realized_atr = (close - trade.entry) / trade.atr_entry. It takes the raw profit and divides it by the Average True Range (a measure of volatility) at the moment of entry. This gives a pure, "apples-to-apples" score for every single trade, which is the foundational data point for all learning.
Section 2: The Cognitive Map (The Long-Term Brain)
What it is, Simply: This is the engine's deep memory, its library of experiences. Imagine a giant, 64-square chessboard (8x8 grid). Each square on the board represents a very specific type of market environment.
The Two Dimensions of Thought (The 'How'): How does it know which square we are on? It looks at two things:
The Market's Personality (X-Axis): Is the market behaving like a disciplined soldier, marching in a clear trend? Or is it like a chaotic, unpredictable child, running all over the place? The engine calculates a "Regime" score to figure this out.
The Market's Energy Level (Y-Axis): Is the market sleepy and quiet, or is it wide-awake and hyperactive? The engine measures "Normalized Volatility" to determine this.
The Power of Generalization (The 'Why'): When a Shadow Portfolio trade closes, its result is recorded in the corresponding square on the chessboard. But here's the clever part: it also shares a little bit of that lesson with the squares immediately next to it (using a Gaussian Kernel).
Analogy: If you touch a hot stove and learn "don't touch," your brain is smart enough to know you probably shouldn't touch the hot oven door next to it either, even if you haven't touched it directly. The Cognitive Map does the same thing, allowing it to make intelligent inferences even in market conditions it has seen less frequently. Each square remembers what indicator settings worked best in that specific environment.
Section 3: The Adaptive Engine (The Central Nervous System)
What it is, Simply: This is the conductor of the orchestra. It takes information from all other parts of the system and decides exactly what to do.
The Symphony of Inputs: It listens to three distinct sources of information before making a decision:
The Short-Term Memory (Rolling Stats): It looks at the performance of the last rollN shadow trades. This is its immediate, recent experience.
The Long-Term Wisdom (Cognitive Map): It consults the grand library of the Cognitive Map to see what has worked best in the current market type over the long haul.
The Gut Instinct (Bin Learning): It keeps a small "mini-batch" of the most recent trades. If this batch shows a very strong, sudden pattern, it can trigger a rapid, reflexive adjustment, like pulling your hand away from a flame.
The Fusion Process: It then blends these three opinions together in a sophisticated way. It gives more weight to the opinions it's more confident in (e.g., a Cognitive Map square with hundreds of trades of experience) and uses your Adaptation Intensity (dialK) input to decide how much to listen to its "gut instinct." The final decision is then smoothed to ensure the indicator's parameters change in a stable, intelligent way.
Chapter 3: The Control Panel - A Granular Guide to the Inputs
Every input is a lever to tune the engine. Let's demystify them.
🧾 Signal Engine (Original): These inputs control the "Turning Point" signal logic.
What they are: Toggles for Reversal Mode (catch tops/bottoms) and Breakout Mode (follow the trend), plus filters like Require New Extreme to ensure signals come from points of extension.
How to use them: For a ranging market, you might favor Reversal mode. For a strongly trending market, Breakout mode might be better. These settings fine-tune the final alert, which is powered by the adaptive engine.
🎛️ Master Control:
Adaptation Intensity (dialK): THIS IS THE MOST IMPORTANT INPUT. It controls the personality of the learning engine.
Low Setting (1-5): Creates a "Wise Old Professor" engine. It's patient, learns from larger batches of data, and makes slow, deliberate, and highly confident adjustments. Use this for stable assets like indices or blue-chip stocks.
High Setting (15-20): Creates a "Hyper-Reactive Day Trader" engine. It learns from tiny samples, trusts its gut instinct, and makes large, aggressive adjustments to keep up with a frantic market. Use this for highly volatile assets like crypto or meme stocks.
🧠 Adaptive Engine & 🎯 Learning:
What they are: The deep mechanics of the learning process. Base Learn Rate is the fundamental step size of adjustments. Rolling Window Size is the length of its "short-term memory." Adaptation Momentum controls how smoothly the parameters transition to their new learned values.
How to use them: For most users, the defaults are well-balanced. Advanced users can tweak these to make the engine even more or less sensitive to new information.
🗺️ Cognitive Map, STM & Checkpoints:
What they are: Controls for the engine's brain. Enable Cognitive Map turns on the long-term memory.
The Checkpoint System - Your "Save Game" Feature: This is incredibly powerful.
To Save: Toggle Emit Checkpoint Now. Go to your alert log, and you will see a very long string of text. Copy this entire string.
To Load: Paste that string into the Memory Checkpoint input box. Toggle Apply Checkpoint On Next Bar. The script will instantly load its entire "brain"—every learned parameter and all 64 cells of the Cognitive Map. You can train the engine on one chart and transfer its intelligence to another.
Chapter 4: The Command Center - Decoding the Dashboard
This is your window into the engine's mind. Do not be intimidated. Let's break it down.
PANEL A (INFLECTION NEXUS): The high-level overview.
Market Context: See how the engine classifies the market's Trend and Regime (personality).
Shadow Portfolio Summary: The engine's report card. Watch the Win Rate and Avg P&L to see the quality of the raw data it's learning from.
PANEL B (SHADOW PORTFOLIO ADAPTIVE): The deep diagnostics.
Performance Metrics: Advanced stats like Sharpe Ratio (return vs. risk) and Sortino Ratio (return vs. downside risk). This tells you about the quality and consistency of the market movements the engine is analyzing.
Adaptive Parameters (Live vs Base): THIS IS THE MOST IMPORTANT SECTION. It shows the engine's Live parameters right next to your (Base) inputs.
How to interpret it: If you see the Live ATR Len is 45 while your Base input is 20, the engine is telling you: "The market is in a long, smooth trend right now. Short-term noise is a trap. I have learned that we must use a longer-term perspective to see clearly." This section translates the engine's learning directly into actionable insight.
Memory Log: A live ticker of the engine's thoughts, showing every trade it learns from and every adaptation it makes.
Chapter 5: Reading the Canvas - On-Chart Visuals
The Bands (Green/Blue Lines): These are not static Supertrend lines. They are the
physical manifestation of the engine's current thinking. As the engine learns and adapts its ATR Period and Multiplier, you will see these bands widen, tighten, and adjust their distance from price. They are alive.
The Labels (BUY/SELL): These are the final output of the "Turning Point" logic, now supercharged and informed by the fully adaptive SPA engine.
The Purple Pulse (Dot and Background Glow): This is your visual cue that the engine is "thinking." Every time you see this pulse, it means the SPA has just completed a learning cycle and updated its parameters. It is actively recalibrating itself to the market.
Chapter 6: A Personal Manifesto on Innovation
I want to conclude with a personal note on why I dedicate countless hours to building systems like this and sharing them openly.
My purpose is to drive innovation, period. I am not in this space to follow the crowd or to re-package old ideas. The world does not need a 100th version of a slightly modified MACD. Real progress comes from venturing into the wilderness, from asking difficult questions, and from pursuing concepts that lie at the very edge of possibility.
I am not afraid of being wrong. I am not afraid of being bested by my peers. In fact, I welcome it. If another developer takes an idea from this engine, improves it, and builds something even more magnificent, that is a profound win for our entire community. The only failure I recognize is the failure to try. The only trap I fear is the creative complacency of producing sterile, recycled work just to appease the status quo.
I love this community, and I believe with every fiber of my being that we have barely scratched the surface of what can be discovered and created. This script is my contribution to that shared journey. It is a tool, an idea, and a challenge to all of us: let's keep pushing.
DISCLAIMER: This script is an experimental framework provided for educational and research purposes ONLY. It is not financial advice. All trading involves substantial risk of loss. Past performance is not indicative of future results. Please use this tool responsibly and as part of a comprehensive trading plan.
As the great computer scientist Herbert A. Simon, a pioneer of artificial intelligence, famously said:
"Learning is any process by which a system improves performance from experience."
May this engine enhance your experience.
— Dskyz, for DAFE Trading Systems
SMC BOS - Structure Breaks & Median Continuation ProjectionsThis tool shows what usually happens after a Break of Structure (BOS).
It scans past BOS events on your chart, finds the ones most similar to the latest break (using ATR to filter by volatility), and then plots the median continuation path.
Optional percentile bands (P10–P90) display the possible range of outcomes around the median.
Key features:
• Automatic detection of bullish and bearish BOS events
• Library of past BOS with adjustable size and spacing
• ATR-based similarity and recency weighting
• Median continuation projections with optional percentile bands
• Customizable colors, signals, and stats table
• Works on any market and timeframe
Use cases:
• See how price typically behaves after a BOS
• Support SMC analysis with data-driven projections
• Improve trade planning by visualizing likely continuations
• Apply across crypto, forex, stocks, and futures
Originality:
Instead of only marking BOS, this script learns from history and projects forward the median path of the most similar past cases, adjusted for volatility. It turns BOS signals into practical continuation scenarios.
Instructions:
Add the indicator to your chart. When a BOS is detected, the projection is drawn automatically.
Use the settings to adjust the library, ATR weighting, projection style, percentile bands, and the display of signals or stats.
For questions or customization, contact Julien Eche (Julien_Eche) on TradingView.

EMA50 + SR Boxes + VP Right + ATR + SL% + Entries + SentimentThis indicator combines several pro-grade building blocks to read the market at a glance:
EMA50 as a trend filter.
Smart Support/Resistance zones (rectangles) detected where price has touched multiple times.
“U / Inverted U” markers (confirmed pivots).
Optional Buy/Sell signals: only when a U appears inside a support zone with price above the EMA50 (buy), or an inverted U inside a resistance zone with price below the EMA50 (sell).
Simplified right-side Volume Profile (with a special Forex fallback if volume isn’t usable).
ATR & SL%: displays current ATR and an SL% based on ATR(100) Daily / Close × 100, attached to the latest candle.

SFI MAGIC
// Join our channel for more free tools: t.me
//@version=5
indicator("SFI MAGIC", overlay=true, max_labels_count=500)
//------------------------------------------------------------------------------
// Input Settings
useBody = input(false, 'Use Candle Body')
signalMode = input.string('Simple Entry + Exits', 'Signal Strategy', , tooltip='Change Your Signal Appearance And Strategies')
sensitivity = input.float(2.3, "Sensitivity", 0.6, 15.1, step=0.1, tooltip='Change Your Signal Sensitivity And Accuracy')
strongSignalOnly = input(false, "STRONG Only", inline='BasicFilters')
noRepainting = input(false, 'No Repainting', inline='BasicFilters', tooltip='Disables all signals except strong signals Disables repainting for signals')
Multiplier = input.float(1.5, "ATR Multiplier", step=0.1)
align_with_supertrend = input.bool(false, "Align Signals with Supertrend", tooltip="Enable to align buy/sell signals with Supertrend direction")
//------------------------------------------------------------------------------
// ATR and Supertrend Calculation
atr = ta.atr(14)
st_atr_length = input.int(10, "Supertrend ATR Length", minval=1)
st_multiplier = input.float(3.0, "Supertrend Multiplier", step=0.1)
upper_band = ta.sma(close, st_atr_length) + st_multiplier * atr
lower_band = ta.sma(close, st_atr_length) - st_multiplier * atr
var float supertrend = na
supertrend := close > nz(supertrend ) ? math.max(lower_band, nz(supertrend )) : math.min(upper_band, nz(supertrend ))
supertrend_up = close > supertrend
supertrend_down = close < supertrend
//------------------------------------------------------------------------------
// Signal Logic
src = close
smoothrng(x, t, m) =>
wper = t * 2 - 1
avrng = ta.ema(math.abs(x - x ), t)
smoothrng = ta.ema(avrng, wper) * m
smoothrng
smrng = smoothrng(close, 100, sensitivity)
rngfilt(x, r) =>
rngfilt = x
rngfilt := x > nz(rngfilt ) ? x - r < nz(rngfilt ) ? nz(rngfilt ) : x - r : x + r > nz(rngfilt ) ? nz(rngfilt ) : x + r
rngfilt
filt = rngfilt(src, smrng)
var float upward = na
var float downward = na
var int CondIni = na
upward := filt > filt ? nz(upward ) + 1 : filt < filt ? 0 : nz(upward )
downward := filt < filt ? nz(downward ) + 1 : filt > filt ? 0 : nz(downward )
longCond = src > filt and src > src and upward > 0 or src > filt and src < src and upward > 0
shortCond = src < filt and src < src and downward > 0 or src < filt and src > src and downward > 0
CondIni := longCond ? 1 : shortCond ? -1 : nz(CondIni )
buyCond = longCond and CondIni == -1
strongBuyCond = buyCond and close <= filt - smrng
sellCond = shortCond and CondIni == 1
strongSellCond = sellCond and open >= filt + smrng
if noRepainting
buyCond := buyCond and barstate.isconfirmed
strongBuyCond := strongBuyCond and barstate.isconfirmed
sellCond := sellCond and barstate.isconfirmed
strongSellCond := strongSellCond and barstate.isconfirmed
//------------------------------------------------------------------------------
// Tradingview indicators. Join ->>> t.me
// -------------------- 👆👆👆👆👆👆 ---------------
//------------------------------------------------------------------------------
// ATR-Based Book Profit and Wait for Supertrend Break
var float buy_entry_price = na
var float sell_entry_price = na
var bool buy_profit_plotted = false
var bool sell_profit_plotted = false
if (buyCond or strongBuyCond)
buy_entry_price := close
buy_profit_plotted := false
if (sellCond or strongSellCond)
sell_entry_price := close
sell_profit_plotted := false
buy_target = buy_entry_price + (atr * Multiplier)
sell_target = sell_entry_price - (atr * Multiplier)
if (not na(buy_entry_price) and close >= buy_target and not buy_profit_plotted)
label.new(bar_index, high, "Book Profit", color=#00db0a, style=label.style_label_down, textcolor=color.white, size=size.normal)
buy_profit_plotted := true
label.new(bar_index, high - atr, "Wait for Supertrend to break", color=color.orange, style=label.style_label_down, textcolor=color.white, size=size.normal)
if (not na(sell_entry_price) and close <= sell_target and not sell_profit_plotted)
label.new(bar_index, low, "Book Profit", color=#ff0000, style=label.style_label_up, textcolor=color.white, size=size.normal)
sell_profit_plotted := true
label.new(bar_index, low + atr, "Wait for Supertrend to break", color=color.orange, style=label.style_label_up, textcolor=color.white, size=size.normal)
//------------------------------------------------------------------------------
// Candle Coloring
barcolor_cond = src > filt and upward > 0 ? color.new(#00db0a, 5) : src < filt and downward > 0 ? color.new(#c90505, 5) : na
barcolor(barcolor_cond, title='Candle Colors')
// Plot Signals
plotshape(buyCond and not strongSignalOnly, 'Buy', shape.labelup, location.belowbar, color.new(#21ff30, 0), size=size.small, textcolor=color.black, text='BUY')
plotshape(strongBuyCond, 'Strong Buy', shape.labelup, location.belowbar, color.new(#09ff00, 0), size=size.small, textcolor=color.black, text='BUY')
plotshape(sellCond and not strongSignalOnly, 'Sell', shape.labeldown, location.abovebar, color.new(#ff0000, 0), size=size.small, textcolor=color.black, text='SELL')
plotshape(strongSellCond, 'Strong Sell', shape.labeldown, location.abovebar, color.new(#ff0000, 0), size=size.small, textcolor=color.black, text='SELL')
// Supertrend Plot
plot(supertrend, color=supertrend_up ? color.green : color.red, title="Supertrend", linewidth=2)
// ==========================================================================================
// === Dashboard with Telegram Link ===
var table myTable = table.new(position.top_center, 1, 1, border_width=1, frame_color=color.black, bgcolor=color.white)
// Add Telegram Message to Dashboard
table.cell(myTable, 0, 0, "Join Telegram @mrexpert_ai", bgcolor=color.blue, text_color=color.white, text_size=size.normal)

AI Agent XAU Scalper V1AI Agent XAU Scalper V1 is a custom indicator designed to help traders read the XAU/USD (Gold) market direction more quickly and clearly, especially on lower timeframes (M1–M15).
This indicator provides automatic BUY/SELL signals along with a dynamic trail line that can be used as a guide for moving support and resistance levels. With a clean and informative display, it is suitable for day traders who need fast decision-making in the highly volatile gold market.
🎯 Key Features
Automatic BUY/SELL signals with clear and easy-to-read labels.
Dynamic trail line as a guide for support and resistance.
Optional Heikin Ashi mode for smoother trend visualization.
Alert system → supports TradingView notifications so traders never miss an entry.
Optimized for XAU/USD scalping → works best on M1, M5, and M15 timeframes.
⚡ How to Use
Add the indicator to the XAU/USD chart.
Adjust the parameters as needed:
ATR Period (default 10)
Sensitivity (default 1.0)
Heikin Ashi mode: optional
Follow the signals:
Green label = BUY
Red label = SELL
Trail line = dynamic support/resistance guide
📌 Notes
This indicator is not a guaranteed profit tool. Always apply proper risk management and trading discipline.
Recommended for scalping on lower timeframes, but can also be tested on higher timeframes depending on the trader’s style.

Guardeer//@version=5
indicator("Guardeer", shorttitle = "Guardeer", overlay = true, max_lines_count = 500, max_labels_count = 500, max_boxes_count = 500, max_bars_back = 500, max_polylines_count = 100)
//-----------------------------------------------------------------------------{
//Boolean set
//-----------------------------------------------------------------------------{
s_BOS = 0
s_CHoCH = 1
i_BOS = 2
i_CHoCH = 3
i_pp_CHoCH = 4
green_candle = 5
red_candle = 6
s_CHoCHP = 7
i_CHoCHP = 8
boolean =
array.from(
false
, false
, false
, false
, false
, false
, false
, false
, false
)
//-----------------------------------------------------------------------------{
// User inputs
//-----------------------------------------------------------------------------{
show_swing_ms = input.string ("All" , "Swing " , inline = "1", group = "MARKET STRUCTURE" , options = )
show_internal_ms = input.string ("All" , "Internal " , inline = "2", group = "MARKET STRUCTURE" , options = )
internal_r_lookback = input.int (5 , "" , inline = "2", group = "MARKET STRUCTURE" , minval = 2)
swing_r_lookback = input.int (50 , "" , inline = "1", group = "MARKET STRUCTURE" , minval = 2)
ms_mode = input.string ("Manual" , "Market Structure Mode" , inline = "a", group = "MARKET STRUCTURE" , tooltip = " Use selected lenght Use automatic lenght" ,options = )
show_mtf_str = input.bool (true , "MTF Scanner" , inline = "9", group = "MARKET STRUCTURE" , tooltip = "Display Multi-Timeframe Market Structure Trend Directions. Green = Bullish. Red = Bearish")
show_eql = input.bool (false , "Show EQH/EQL" , inline = "6", group = "MARKET STRUCTURE")
plotcandle_bool = input.bool (false , "Plotcandle" , inline = "3", group = "MARKET STRUCTURE" , tooltip = "Displays a cleaner colored candlestick chart in place of the default candles. (requires hiding the current ticker candles)")
barcolor_bool = input.bool (false , "Bar Color" , inline = "4", group = "MARKET STRUCTURE" , tooltip = "Color the candle bodies according to market strucutre trend")
i_ms_up_BOS = input.color (#089981 , "" , inline = "2", group = "MARKET STRUCTURE")
i_ms_dn_BOS = input.color (#f23645 , "" , inline = "2", group = "MARKET STRUCTURE")
s_ms_up_BOS = input.color (#089981 , "" , inline = "1", group = "MARKET STRUCTURE")
s_ms_dn_BOS = input.color (#f23645 , "" , inline = "1", group = "MARKET STRUCTURE")
lvl_daily = input.bool (false , "Day " , inline = "1", group = "HIGHS & LOWS MTF")
lvl_weekly = input.bool (false , "Week " , inline = "2", group = "HIGHS & LOWS MTF")
lvl_monthly = input.bool (false , "Month" , inline = "3", group = "HIGHS & LOWS MTF")
lvl_yearly = input.bool (false , "Year " , inline = "4", group = "HIGHS & LOWS MTF")
css_d = input.color (color.blue , "" , inline = "1", group = "HIGHS & LOWS MTF")
css_w = input.color (color.blue , "" , inline = "2", group = "HIGHS & LOWS MTF")
css_m = input.color (color.blue , "" , inline = "3", group = "HIGHS & LOWS MTF")
css_y = input.color (color.blue , "" , inline = "4", group = "HIGHS & LOWS MTF")
s_d = input.string ('⎯⎯⎯' , '' , inline = '1', group = 'HIGHS & LOWS MTF' , options = )
s_w = input.string ('⎯⎯⎯' , '' , inline = '2', group = 'HIGHS & LOWS MTF' , options = )
s_m = input.string ('⎯⎯⎯' , '' , inline = '3', group = 'HIGHS & LOWS MTF' , options = )
s_y = input.string ('⎯⎯⎯' , '' , inline = '4', group = 'HIGHS & LOWS MTF' , options = )
ob_show = input.bool (true , "Show Last " , inline = "1", group = "VOLUMETRIC ORDER BLOCKS" , tooltip = "Display volumetric order blocks on the chart Ammount of volumetric order blocks to show")
ob_num = input.int (5 , "" , inline = "1", group = "VOLUMETRIC ORDER BLOCKS" , tooltip = "Orderblocks number", minval = 1, maxval = 10)
ob_metrics_show = input.bool (true , "Internal Buy/Sell Activity" , inline = "2", group = "VOLUMETRIC ORDER BLOCKS" , tooltip = "Display volume metrics that have formed the orderblock")
css_metric_up = input.color (color.new(#089981, 50) , " " , inline = "2", group = "VOLUMETRIC ORDER BLOCKS")
css_metric_dn = input.color (color.new(#f23645 , 50) , "" , inline = "2", group = "VOLUMETRIC ORDER BLOCKS")
ob_swings = input.bool (false , "Swing Order Blocks" , inline = "a", group = "VOLUMETRIC ORDER BLOCKS" , tooltip = "Display swing volumetric order blocks")
css_swing_up = input.color (color.new(color.gray , 90) , " " , inline = "a", group = "VOLUMETRIC ORDER BLOCKS")
css_swing_dn = input.color (color.new(color.silver, 90) , "" , inline = "a", group = "VOLUMETRIC ORDER BLOCKS")
ob_filter = input.string ("None" , "Filtering " , inline = "d", group = "VOLUMETRIC ORDER BLOCKS" , tooltip = "Filter out volumetric order blocks by BOS/CHoCH/CHoCH+", options = )
ob_mitigation = input.string ("Absolute" , "Mitigation " , inline = "4", group = "VOLUMETRIC ORDER BLOCKS" , tooltip = "Trigger to remove volumetric order blocks", options = )
ob_pos = input.string ("Precise" , "Positioning " , inline = "k", group = "VOLUMETRIC ORDER BLOCKS" , tooltip = "Position of the Order Block Cover the whole candle Cover half candle Adjust to volatility Same as Accurate but more precise", options = )
use_grayscale = input.bool (false , "Grayscale" , inline = "6", group = "VOLUMETRIC ORDER BLOCKS" , tooltip = "Use gray as basic order blocks color")
use_show_metric = input.bool (true , "Show Metrics" , inline = "7", group = "VOLUMETRIC ORDER BLOCKS" , tooltip = "Show volume associated with the orderblock and his relevance")
use_middle_line = input.bool (true , "Show Middle-Line" , inline = "8", group = "VOLUMETRIC ORDER BLOCKS" , tooltip = "Show mid-line order blocks")
use_overlap = input.bool (true , "Hide Overlap" , inline = "9", group = "VOLUMETRIC ORDER BLOCKS" , tooltip = "Hide overlapping order blocks")
use_overlap_method = input.string ("Previous" , "Overlap Method " , inline = "Z", group = "VOLUMETRIC ORDER BLOCKS" , tooltip = " Preserve the most recent volumetric order blocks Preserve the previous volumetric order blocks", options = )
ob_bull_css = input.color (color.new(#089981 , 90) , "" , inline = "1", group = "VOLUMETRIC ORDER BLOCKS")
ob_bear_css = input.color (color.new(#f23645 , 90) , "" , inline = "1", group = "VOLUMETRIC ORDER BLOCKS")
show_acc_dist_zone = input.bool (false , "" , inline = "1", group = "Accumulation And Distribution")
zone_mode = input.string ("Fast" , "" , inline = "1", group = "Accumulation And Distribution" , tooltip = " Find small zone pattern formation Find bigger zone pattern formation" ,options = )
acc_css = input.color (color.new(#089981 , 60) , "" , inline = "1", group = "Accumulation And Distribution")
dist_css = input.color (color.new(#f23645 , 60) , "" , inline = "1", group = "Accumulation And Distribution")
show_lbl = input.bool (true , "Show swing point" , inline = "1", group = "High and Low" , tooltip = "Display swing point")
show_mtb = input.bool (true , "Show High/Low/Equilibrium" , inline = "2", group = "High and Low" , tooltip = "Display Strong/Weak High And Low and Equilibrium")
toplvl = input.color (color.red , "Premium Zone " , inline = "3", group = "High and Low")
midlvl = input.color (color.gray , "Equilibrium Zone" , inline = "4", group = "High and Low")
btmlvl = input.color (#089981 , "Discount Zone " , inline = "5", group = "High and Low")
fvg_enable = input.bool (false , " " , inline = "1", group = "FAIR VALUE GAP" , tooltip = "Display fair value gap")
what_fvg = input.string ("FVG" , "" , inline = "1", group = "FAIR VALUE GAP" , tooltip = "Display fair value gap", options = )
fvg_num = input.int (5 , "Show Last " , inline = "1a", group = "FAIR VALUE GAP" , tooltip = "Number of fvg to show")
fvg_upcss = input.color (color.new(#089981, 80) , "" , inline = "1", group = "FAIR VALUE GAP")
fvg_dncss = input.color (color.new(color.red , 80) , "" , inline = "1", group = "FAIR VALUE GAP")
fvg_extend = input.int (10 , "Extend FVG" , inline = "2", group = "FAIR VALUE GAP" , tooltip = "Extend the display of the FVG.")
fvg_src = input.string ("Close" , "Mitigation " , inline = "3", group = "FAIR VALUE GAP" , tooltip = " Use the close of the body as trigger Use the extreme point of the body as trigger", options = )
fvg_tf = input.timeframe ("" , "Timeframe " , inline = "4", group = "FAIR VALUE GAP" , tooltip = "Timeframe of the fair value gap")
t = color.t (ob_bull_css)
invcol = color.new (color.white , 100)
//{----------------------------------------------------------------------------------------------------------------------------------------------}
//{----------------------------------------------------------------------------------------------------------------------------------------------}
//{----------------------------------------------------------------------------------------------------------------------------------------------}
//{----------------------------------------------------------------------------------------------------------------------------------------------}
//{ - UDT }
//{----------------------------------------------------------------------------------------------------------------------------------------------}
//{----------------------------------------------------------------------------------------------------------------------------------------------}
//{----------------------------------------------------------------------------------------------------------------------------------------------}
//{----------------------------------------------------------------------------------------------------------------------------------------------}
type bar
float o = open
float c = close
float h = high
float l = low
float v = volume
int n = bar_index
int t = time
type Zphl
line top
line bottom
label top_label
label bottom_label
bool stopcross
bool sbottomcross
bool itopcross
bool ibottomcross
string txtup
string txtdn
float topy
float bottomy
float topx
float bottomx
float tup
float tdn
int tupx
int tdnx
float itopy
float itopx
float ibottomy
float ibottomx
float uV
float dV
type FVG
box box
line ln
bool bull
float top
float btm
int left
int right
type ms
float p
int n
float l
type msDraw
int n
float p
color css
string txt
bool bull
type obC
float top
float btm
int left
float avg
float dV
float cV
int wM
int blVP
int brVP
int dir
float h
float l
int n
type obD
box ob
box eOB
box blB
box brB
line mL
type zone
chart.point points
float p
int c
int t
type hqlzone
box pbx
box ebx
box lbx
label plb
label elb
label lbl
type ehl
float pt
int t
float pb
int b
type pattern
string found = "None"
bool isfound = false
int period = 0
bool bull = false
type alerts
bool chochswing = false
bool chochplusswing = false
bool swingbos = false
bool chochplus = false
bool choch = false
bool bos = false
bool equal = false
bool ob = false
bool swingob = false
bool zone = false
bool fvg = false
bool obtouch = false
//{----------------------------------------------------------------------------------------------------------------------------------------------}
//{----------------------------------------------------------------------------------------------------------------------------------------------}
//{----------------------------------------------------------------------------------------------------------------------------------------------}
//{----------------------------------------------------------------------------------------------------------------------------------------------}
//{ - End }
//{----------------------------------------------------------------------------------------------------------------------------------------------}
//{----------------------------------------------------------------------------------------------------------------------------------------------}
//{----------------------------------------------------------------------------------------------------------------------------------------------}
//{----------------------------------------------------------------------------------------------------------------------------------------------}
//{----------------------------------------------------------------------------------------------------------------------------------------------}
//{----------------------------------------------------------------------------------------------------------------------------------------------}
//{----------------------------------------------------------------------------------------------------------------------------------------------}
//{----------------------------------------------------------------------------------------------------------------------------------------------}
//{ - General Setup }
//{----------------------------------------------------------------------------------------------------------------------------------------------}
//{----------------------------------------------------------------------------------------------------------------------------------------------}
//{----------------------------------------------------------------------------------------------------------------------------------------------}
//{----------------------------------------------------------------------------------------------------------------------------------------------}
bar b = bar.new()
var pattern p = pattern.new()
alerts blalert = alerts.new()
alerts bralert = alerts.new()
if p.isfound
p.period += 1
if p.period == 50
p.period := 0
p.found := "None"
p.isfound := false
p.bull := na
switch
b.c > b.o => boolean.set(green_candle, true)
b.c < b.o => boolean.set(red_candle , true)
f_zscore(src, lookback) =>
(src - ta.sma(src, lookback)) / ta.stdev(src, lookback)
var int iLen = internal_r_lookback
var int sLen = swing_r_lookback
vv = f_zscore(((close - close ) / close ) * 100,iLen)
if ms_mode == "Dynamic"
switch
vv >= 1.5 or vv <= -1.5 => iLen := 10
vv >= 1.6 or vv <= -1.6 => iLen := 9
vv >= 1.7 or vv <= -1.7 => iLen := 8
vv >= 1.8 or vv <= -1.8 => iLen := 7
vv >= 1.9 or vv <= -1.9 => iLen := 6
vv >= 2.0 or vv <= -2.0 => iLen := 5
=> iLen
var msline = array.new(0)
iH = ta.pivothigh(high, iLen, iLen)
sH = ta.pivothigh(high, sLen, sLen)
iL = ta.pivotlow (low , iLen, iLen)
sL = ta.pivotlow (low , sLen, sLen)
//{----------------------------------------------------------------------------------------------------------------------------------------------}
//{----------------------------------------------------------------------------------------------------------------------------------------------}
//{----------------------------------------------------------------------------------------------------------------------------------------------}
//{----------------------------------------------------------------------------------------------------------------------------------------------}
//{ - End }
//{----------------------------------------------------------------------------------------------------------------------------------------------}
//{----------------------------------------------------------------------------------------------------------------------------------------------}
//{----------------------------------------------------------------------------------------------------------------------------------------------}
//{----------------------------------------------------------------------------------------------------------------------------------------------}
//{----------------------------------------------------------------------------------------------------------------------------------------------}
//{----------------------------------------------------------------------------------------------------------------------------------------------}
//{----------------------------------------------------------------------------------------------------------------------------------------------}
//{----------------------------------------------------------------------------------------------------------------------------------------------}
//{ - ARRAYS }
//{----------------------------------------------------------------------------------------------------------------------------------------------}
//{----------------------------------------------------------------------------------------------------------------------------------------------}
//{----------------------------------------------------------------------------------------------------------------------------------------------}
//{----------------------------------------------------------------------------------------------------------------------------------------------}
hl () =>
= request.security(syminfo.tickerid , 'D' , hl() , lookahead = barmerge.lookahead_on)
= request.security(syminfo.tickerid , 'W' , hl() , lookahead = barmerge.lookahead_on)
= request.security(syminfo.tickerid , 'M' , hl() , lookahead = barmerge.lookahead_on)
= request.security(syminfo.tickerid , '12M', hl() , lookahead = barmerge.lookahead_on)
lstyle(style) =>
out = switch style
'⎯⎯⎯' => line.style_solid
'----' => line.style_dashed
'····' => line.style_dotted
mtfphl(h, l ,tf ,css, pdhl_style) =>
var line hl = line.new(
na
, na
, na
, na
, xloc = xloc.bar_time
, color = css
, style = lstyle(pdhl_style)
)
var line ll = line.new(
na
, na
, na
, na
, xloc = xloc.bar_time
, color = css
, style = lstyle(pdhl_style)
)
var label lbl = label.new(
na
, na
, xloc = xloc.bar_time
, text = str.format('P{0}L', tf)
, color = invcol
, textcolor = css
, size = size.small
, style = label.style_label_left
)
var label hlb = label.new(
na
, na
, xloc = xloc.bar_time
, text = str.format('P{0}H', tf)
, color = invcol
, textcolor = css
, size = size.small
, style = label.style_label_left
)
hy = ta.valuewhen(h != h , h , 1)
hx = ta.valuewhen(h == high , time , 1)
ly = ta.valuewhen(l != l , l , 1)
lx = ta.valuewhen(l == low , time , 1)
if barstate.islast
extension = time + (time - time ) * 50
line.set_xy1(hl , hx , hy)
line.set_xy2(hl , extension , hy)
label.set_xy(hlb, extension , hy)
line.set_xy1(ll , lx , ly)
line.set_xy2(ll , extension , ly)
label.set_xy(lbl, extension , ly)
if lvl_daily
mtfphl(pdh , pdl , 'D' , css_d, s_d)
if lvl_weekly
mtfphl(pwh , pwl , 'W' , css_w, s_w)
if lvl_monthly
mtfphl(pmh , pml, 'M' , css_m, s_m)
if lvl_yearly
mtfphl(pyh , pyl , '12M', css_y, s_y)
//{----------------------------------------------------------------------------------------------------------------------------------------------}
//{----------------------------------------------------------------------------------------------------------------------------------------------}
//{----------------------------------------------------------------------------------------------------------------------------------------------}
//{----------------------------------------------------------------------------------------------------------------------------------------------}
//{ - End }
//{----------------------------------------------------------------------------------------------------------------------------------------------}
//{----------------------------------------------------------------------------------------------------------------------------------------------}
//{----------------------------------------------------------------------------------------------------------------------------------------------}
//{----------------------------------------------------------------------------------------------------------------------------------------------}
//{----------------------------------------------------------------------------------------------------------------------------------------------}
//{----------------------------------------------------------------------------------------------------------------------------------------------}
//{----------------------------------------------------------------------------------------------------------------------------------------------}
//{----------------------------------------------------------------------------------------------------------------------------------------------}
//{ - Market Structure }
//{----------------------------------------------------------------------------------------------------------------------------------------------}
//{----------------------------------------------------------------------------------------------------------------------------------------------}
//{----------------------------------------------------------------------------------------------------------------------------------------------}
//{----------------------------------------------------------------------------------------------------------------------------------------------}
method darkcss(color css, float factor, bool bull) =>
blue = color.b(css) * (1 - factor)
red = color.r(css) * (1 - factor)
green = color.g(css) * (1 - factor)
color.rgb(red, green, blue, 0)
method f_line(msDraw d, size, style) =>
var line id = na
var label lbl = na
id := line.new(
d.n
, d.p
, b.n
, d.p
, color = d.css
, width = 1
, style = style
)
if msline.size() >= 250
line.delete(msline.shift())
msline.push(id)
lbl := label.new(
int(math.avg(d.n, b.n))
, d.p
, d.txt
, color = invcol
, textcolor = d.css
, style = d.bull ? label.style_label_down : label.style_label_up
, size = size
, text_font_family = font.family_monospace
)
structure(bool mtf) =>
msDraw drw = na
bool isdrw = false
bool isdrwS = false
var color css = na
var color icss = na
var int itrend = 0
var int trend = 0
bool bull_ob = false
bool bear_ob = false
bool s_bull_ob = false
bool s_bear_ob = false
n = bar_index
var ms up = ms.new(
array.new()
, array.new< int >()
, array.new()
)
var ms dn = ms.new(
array.new()
, array.new< int >()
, array.new()
)
var ms sup = ms.new(
array.new()
, array.new< int >()
, array.new()
)
var ms sdn = ms.new(
array.new()
, array.new< int >()
, array.new()
)
switch show_swing_ms
"All" => boolean.set(s_BOS , true ), boolean.set(s_CHoCH, true ) , boolean.set(s_CHoCHP, true )
"CHoCH" => boolean.set(s_BOS , false), boolean.set(s_CHoCH, true ) , boolean.set(s_CHoCHP, false )
"CHoCH+" => boolean.set(s_BOS , false), boolean.set(s_CHoCH, false) , boolean.set(s_CHoCHP, true )
"BOS" => boolean.set(s_BOS , true ), boolean.set(s_CHoCH, false) , boolean.set(s_CHoCHP, false )
"None" => boolean.set(s_BOS , false), boolean.set(s_CHoCH, false) , boolean.set(s_CHoCHP, false )
=> na
switch show_internal_ms
"All" => boolean.set(i_BOS, true ), boolean.set(i_CHoCH, true ), boolean.set(i_CHoCHP, true )
"CHoCH" => boolean.set(i_BOS, false), boolean.set(i_CHoCH, true ), boolean.set(i_CHoCHP, false)
"CHoCH+" => boolean.set(i_BOS, false), boolean.set(i_CHoCH, false ), boolean.set(i_CHoCHP, true )
"BOS" => boolean.set(i_BOS, true ), boolean.set(i_CHoCH, false ), boolean.set(i_CHoCHP, false)
"None" => boolean.set(i_BOS, false), boolean.set(i_CHoCH, false ), boolean.set(i_CHoCHP, false)
=> na
switch
iH =>
up.p.unshift(b.h )
up.l.unshift(b.h )
up.n.unshift(n )
iL =>
dn.p.unshift(b.l )
dn.l.unshift(b.l )
dn.n.unshift(n )
sL =>
sdn.p.unshift(b.l )
sdn.l.unshift(b.l )
sdn.n.unshift(n )
sH =>
sup.p.unshift(b.h )
sup.l.unshift(b.h )
sup.n.unshift(n )
// INTERNAL BULLISH STRUCTURE
if up.p.size() > 0 and dn.l.size() > 1
if ta.crossover(b.c, up.p.first())
bool CHoCH = na
string txt = na
if itrend < 0
CHoCH := true
switch
not CHoCH =>
txt := "BOS"
css := i_ms_up_BOS
blalert.bos := true
if boolean.get(i_BOS) and mtf == false and na(drw)
isdrw := true
drw := msDraw.new(
up.n.first()
, up.p.first()
, i_ms_up_BOS
, txt
, true
)
CHoCH =>
dn.l.first() > dn.l.get(1) ? blalert.chochplus : blalert.choch
txt := dn.l.first() > dn.l.get(1) ? "CHoCH+" : "CHoCH"
css := i_ms_up_BOS.darkcss(0.25, true)
if (dn.l.first() > dn.l.get(1) ? boolean.get(i_CHoCHP) : boolean.get(i_CHoCH)) and mtf == false and na(drw)
isdrw := true
drw := msDraw.new(
up.n.first()
, up.p.first()
, i_ms_up_BOS.darkcss(0.25, true)
, txt
, true
)
if mtf == false
switch
ob_filter == "None" => bull_ob := true
ob_filter == "BOS" and txt == "BOS" => bull_ob := true
ob_filter == "CHoCH" and txt == "CHoCH" => bull_ob := true
ob_filter == "CHoCH+" and txt == "CHoCH+" => bull_ob := true
itrend := 1
up.n.clear()
up.p.clear()
// INTERNAL BEARISH STRUCTURE
if dn.p.size() > 0 and up.l.size() > 1
if ta.crossunder(b.c, dn.p.first())
bool CHoCH = na
string txt = na
if itrend > 0
CHoCH := true
switch
not CHoCH =>
bralert.bos := true
txt := "BOS"
css := i_ms_dn_BOS
if boolean.get(i_BOS) and mtf == false and na(drw)
isdrw := true
drw := msDraw.new(
dn.n.first()
, dn.p.first()
, i_ms_dn_BOS
, txt
, false
)
CHoCH =>
if up.l.first() < up.l.get(1)
bralert.chochplus := true
else
bralert.choch := true
txt := up.l.first() < up.l.get(1) ? "CHoCH+" : "CHoCH"
css := i_ms_dn_BOS.darkcss(0.25, false)
if (up.l.first() < up.l.get(1) ? boolean.get(i_CHoCHP) : boolean.get(i_CHoCH)) and mtf == false and na(drw)
isdrw := true
drw := msDraw.new(
dn.n.first()
, dn.p.first()
, i_ms_dn_BOS.darkcss(0.25, false)
, txt
, false
)
if mtf == false
switch
ob_filter == "None" => bear_ob := true
ob_filter == "BOS" and txt == "BOS" => bear_ob := true
ob_filter == "CHoCH" and txt == "CHoCH" => bear_ob := true
ob_filter == "CHoCH+" and txt == "CHoCH+" => bear_ob := true
itrend := -1
dn.n.clear()
dn.p.clear()
// SWING BULLISH STRUCTURE
if sup.p.size() > 0 and sdn.l.size() > 1
if ta.crossover(b.c, sup.p.first())
bool CHoCH = na
string txt = na
if trend < 0
CHoCH := true
switch
not CHoCH =>
blalert.swingbos := true
txt := "BOS"
icss := s_ms_up_BOS
if boolean.get(s_BOS) and mtf == false and na(drw)
isdrwS := true
drw := msDraw.new(
sup.n.first()
, sup.p.first()
, s_ms_up_BOS
, txt
, true
)
CHoCH =>
if sdn.l.first() > sdn.l.get(1)
blalert.chochplusswing := true
else
blalert.chochswing := true
txt := sdn.l.first() > sdn.l.get(1) ? "CHoCH+" : "CHoCH"
icss := s_ms_up_BOS.darkcss(0.25, true)
if (sdn.l.first() > sdn.l.get(1) ? boolean.get(s_CHoCHP) : boolean.get(s_CHoCH)) and mtf == false and na(drw)
isdrwS := true
drw := msDraw.new(
sup.n.first()
, sup.p.first()
, s_ms_up_BOS.darkcss(0.25, true)
, txt
, true
)
if mtf == false
switch
ob_filter == "None" => s_bull_ob := true
ob_filter == "BOS" and txt == "BOS" => s_bull_ob := true
ob_filter == "CHoCH" and txt == "CHoCH" => s_bull_ob := true
ob_filter == "CHoCH+" and txt == "CHoCH+" => s_bull_ob := true
trend := 1
sup.n.clear()
sup.p.clear()
// SWING BEARISH STRUCTURE
if sdn.p.size() > 0 and sup.l.size() > 1
if ta.crossunder(b.c, sdn.p.first())
bool CHoCH = na
string txt = na
if trend > 0
CHoCH := true
switch
not CHoCH =>
bralert.swingbos := true
txt := "BOS"
icss := s_ms_dn_BOS
if boolean.get(s_BOS) and mtf == false and na(drw)
isdrwS := true
drw := msDraw.new(
sdn.n.first()
, sdn.p.first()
, s_ms_dn_BOS
, txt
, false
)
CHoCH =>
if sup.l.first() < sup.l.get(1)
bralert.chochplusswing := true
else
bralert.chochswing := true
txt := sup.l.first() < sup.l.get(1) ? "CHoCH+" : "CHoCH"
icss := s_ms_dn_BOS.darkcss(0.25, false)
if (sup.l.first() < sup.l.get(1) ? boolean.get(s_CHoCHP) : boolean.get(s_CHoCH)) and mtf == false and na(drw)
isdrwS := true
drw := msDraw.new(
sdn.n.first()
, sdn.p.first()
, s_ms_dn_BOS.darkcss(0.25, false)
, txt
, false
)
if mtf == false
switch
ob_filter == "None" => s_bear_ob := true
ob_filter == "BOS" and txt == "BOS" => s_bear_ob := true
ob_filter == "CHoCH" and txt == "CHoCH" => s_bear_ob := true
ob_filter == "CHoCH+" and txt == "CHoCH+" => s_bear_ob := true
trend := -1
sdn.n.clear()
sdn.p.clear()
= structure(false)
if isdrw
f_line(drw, size.small, line.style_dashed)
if isdrwS
f_line(drw, size.small, line.style_solid)
= request.security("", "15" , structure(true))
= request.security("", "60" , structure(true))
= request.security("", "240" , structure(true))
= request.security("", "1440" , structure(true))
if show_mtf_str
var tab = table.new(position = position.top_right, columns = 10, rows = 10, bgcolor = na, frame_color = color.rgb(54, 58, 69, 0), frame_width = 1, border_color = color.rgb(54, 58, 69, 100), border_width = 1)
table.cell(tab, 0, 1, text = "15" , text_color = color.silver, text_halign = text.align_center, text_size = size.normal, bgcolor = chart.bg_color, text_font_family = font.family_monospace, width = 2)
table.cell(tab, 0, 2, text = "1H" , text_color = color.silver, text_halign = text.align_center, text_size = size.normal, bgcolor = chart.bg_color, text_font_family = font.family_monospace, width = 2)
table.cell(tab, 0, 3, text = "4H" , text_color = color.silver, text_halign = text.align_center, text_size = size.normal, bgcolor = chart.bg_color, text_font_family = font.family_monospace, width = 2)
table.cell(tab, 0, 4, text = "1D" , text_color = color.silver, text_halign = text.align_center, text_size = size.normal, bgcolor = chart.bg_color, text_font_family = font.family_monospace, width = 2)
table.cell(tab, 1, 1, text = itrend15 == 1 ? "BULLISH" : itrend15 == -1 ? "BEARISH" : na , text_halign = text.align_center, text_size = size.normal, text_color = itrend15 == 1 ? i_ms_up_BOS.darkcss(-0.25, true) : itrend15 == -1 ? i_ms_dn_BOS.darkcss(0.25, false) : color.gray, bgcolor = chart.bg_color, text_font_family = font.family_monospace)
table.cell(tab, 1, 2, text = itrend1H == 1 ? "BULLISH" : itrend1H == -1 ? "BEARISH" : na , text_halign = text.align_center, text_size = size.normal, text_color = itrend1H == 1 ? i_ms_up_BOS.darkcss(-0.25, true) : itrend1H == -1 ? i_ms_dn_BOS.darkcss(0.25, false) : color.gray, bgcolor = chart.bg_color, text_font_family = font.family_monospace)
table.cell(tab, 1, 3, text = itrend4H == 1 ? "BULLISH" : itrend4H == -1 ? "BEARISH" : na , text_halign = text.align_center, text_size = size.normal, text_color = itrend4H == 1 ? i_ms_up_BOS.darkcss(-0.25, true) : itrend4H == -1 ? i_ms_dn_BOS.darkcss(0.25, false) : color.gray, bgcolor = chart.bg_color, text_font_family = font.family_monospace)
table.cell(tab, 1, 4, text = itrend1D == 1 ? "BULLISH" : itrend1D == -1 ? "BEARISH" : na , text_halign = text.align_center, text_size = size.normal, text_color = itrend1D == 1 ? i_ms_up_BOS.darkcss(-0.25, true) : itrend1D == -1 ? i_ms_dn_BOS.darkcss(0.25, false) : color.gray, bgcolor = chart.bg_color, text_font_family = font.family_monospace)
table.cell(tab, 0, 5, text = "Detected Pattern", text_halign = text.align_center, text_size = size.normal, text_color = color.silver, bgcolor = chart.bg_color, text_font_family = font.family_monospace)
table.cell(tab, 0, 6, text = p.found, text_halign = text.align_center, text_size = size.normal, text_color = na(p.bull) ? color.white : p.bull ? i_ms_up_BOS.darkcss(-0.25, true) : p.bull == false ? i_ms_dn_BOS.darkcss(0.25, false) : na, bgcolor = chart.bg_color, text_font_family = font.family_monospace)
table.merge_cells(tab, 0, 5, 1, 5)
table.merge_cells(tab, 0, 6, 1, 6)
//{----------------------------------------------------------------------------------------------------------------------------------------------}
//{----------------------------------------------------------------------------------------------------------------------------------------------}
//{----------------------------------------------------------------------------------------------------------------------------------------------}
//{----------------------------------------------------------------------------------------------------------------------------------------------}
//{ - End }
//{----------------------------------------------------------------------------------------------------------------------------------------------}
//{----------------------------------------------------------------------------------------------------------------------------------------------}
//{----------------------------------------------------------------------------------------------------------------------------------------------}
//{----------------------------------------------------------------------------------------------------------------------------------------------}
//{----------------------------------------------------------------------------------------------------------------------------------------------}
//{----------------------------------------------------------------------------------------------------------------------------------------------}
//{----------------------------------------------------------------------------------------------------------------------------------------------}
//{----------------------------------------------------------------------------------------------------------------------------------------------}
//{ - Strong/Weak High/Low And Equilibrium }
//{----------------------------------------------------------------------------------------------------------------------------------------------}
//{----------------------------------------------------------------------------------------------------------------------------------------------}
//{----------------------------------------------------------------------------------------------------------------------------------------------}
//{----------------------------------------------------------------------------------------------------------------------------------------------}
var phl = Zphl.new(
na
, na
, label.new(na , na , color = invcol , textcolor = i_ms_dn_BOS , style = label.style_label_down , size = size.tiny , text = "")
, label.new(na , na , color = invcol , textcolor = i_ms_up_BOS , style = label.style_label_up , size = size.tiny , text = "")
, true
, true
, true
, true
, ""
, ""
, 0
, 0
, 0
, 0
, high
, low
, 0
, 0
, 0
, 0
, 0
, 0
, na
, na
)
zhl(len)=>
upper = ta.highest(len)
lower = ta.lowest(len)
var float out = 0
out := b.h > upper ? 0 : b.l < lower ? 1 : out
top = out == 0 and out != 0 ? b.h : 0
btm = out == 1 and out != 1 ? b.l : 0
= zhl(sLen)
= zhl(iLen)
upphl(trend) =>
var label lbl = label.new(
na
, na
, color = invcol
, textcolor = toplvl
, style = label.style_label_down
, size = size.small
)
if top
phl.stopcross := true
phl.txtup := top > phl.topy ? "HH" : "HL"
if show_lbl
topl = label.new(
b.n - swing_r_lookback
, top
, phl.txtup
, color = invcol
, textcolor = toplvl
, style = label.style_label_down
, size = size.small
)
line.delete(phl.top )
phl.top := line.new(
b.n - sLen
, top
, b.n
, top
, color = toplvl)
phl.topy := top
phl.topx := b.n - sLen
phl.tup := top
phl.tupx := b.n - sLen
if itop
phl.itopcross := true
phl.itopy := itop
phl.itopx := b.n - iLen
phl.tup := math.max(high, phl.tup)
phl.tupx := phl.tup == high ? b.n : phl.tupx
phl.uV := phl.tup != phl.tup ? b.v : phl.uV
if barstate.islast
line.set_xy1(
phl.top
, phl.tupx
, phl.tup
)
line.set_xy2(
phl.top
, b.n + 50
, phl.tup
)
label.set_x(
lbl
, b.n + 50
)
label.set_y(
lbl
, phl.tup
)
dist = math.abs(phl.uV / (phl.uV + phl.dV)) * 100
label.set_text (lbl, trend < 0
? "Strong High | " + str.tostring(phl.uV, format.volume) + " (" + str.tostring(math.round(dist,0)) + "%)"
: "Weak High | " + str.tostring(phl.uV, format.volume) + " (" + str.tostring(math.round(dist,0)) + "%)")
dnphl(trend) =>
var label lbl = label.new(
na
, na
, color = invcol
, textcolor = btmlvl
, style = label.style_label_up
, size = size.small
)
if btm
phl.sbottomcross := true
phl.txtdn := btm > phl.bottomy ? "LH" : "LL"
if show_lbl
btml = label.new(
b.n - swing_r_lookback
, btm, phl.txtdn
, color = invcol
, textcolor = btmlvl
, style = label.style_label_up
, size = size.small
)
line.delete(phl.bottom )
phl.bottom := line.new(
b.n - sLen
, btm
, b.n
, btm
, color = btmlvl
)
phl.bottomy := btm
phl.bottomx := b.n - sLen
phl.tdn := btm
phl.tdnx := b.n - sLen
if ibtm
phl.ibottomcross := true
phl.ibottomy := ibtm
phl.ibottomx := b.n - iLen
phl.tdn := math.min(low, phl.tdn)
phl.tdnx := phl.tdn == low ? b.n : phl.tdnx
phl.dV := phl.tdn != phl.tdn ? b.v : phl.dV
if barstate.islast
line.set_xy1(
phl.bottom
, phl.tdnx
, phl.tdn
)
line.set_xy2(
phl.bottom
, b.n + 50
, phl.tdn
)
label.set_x(
lbl
, b.n + 50
)
label.set_y(
lbl
, phl.tdn
)
dist = math.abs(phl.dV / (phl.uV + phl.dV)) * 100
label.set_text (lbl, trend > 0
? "Strong Low | " + str.tostring(phl.dV, format.volume) + " (" + str.tostring(math.round(dist,0)) + "%)"
: "Weak Low | " + str.tostring(phl.uV, format.volume) + " (" + str.tostring(math.round(dist,0)) + "%)")
midphl() =>
avg = math.avg(phl.bottom.get_y2(), phl.top.get_y2())
var line l = line.new(
y1 = avg
, y2 = avg
, x1 = b.n - sLen
, x2 = b.n + 50
, color = midlvl
, style = line.style_solid
)
var label lbl = label.new(
x = b.n + 50
, y = avg
, text = "Equilibrium"
, style = label.style_label_left
, color = invcol
, textcolor = midlvl
, size = size.small
)
if barstate.islast
more = (phl.bottom.get_x1() + phl.bottom.get_x2()) > (phl.top.get_x1() + phl.top.get_x2()) ? phl.top.get_x1() : phl.bottom.get_x1()
line.set_xy1(l , more , avg)
line.set_xy2(l , b.n + 50, avg)
label.set_x (lbl , b.n + 50 )
label.set_y (lbl , avg )
dist = math.abs((l.get_y2() - close) / close) * 100
label.set_text (lbl, "Equilibrium (" + str.tostring(math.round(dist,0)) + "%)")
hqlzone() =>
if barstate.islast
var hqlzone dZone = hqlzone.new(
box.new(
na
, na
, na
, na
, bgcolor = color.new(toplvl, 70)
, border_color = na
)
, box.new(
na
, na
, na
, na
, bgcolor = color.new(midlvl, 70)
, border_color = na
)
, box.new(
na
, na
, na
, na
, bgcolor = color.new(btmlvl, 70)
, border_color = na
)
, label.new(na, na, text = "Premium" , color = invcol, textcolor = toplvl, style = label.style_label_down, size = size.small)
, label.new(na, na, text = "Equilibrium", color = invcol, textcolor = midlvl, style = label.style_label_left, size = size.small)
, label.new(na, na, text = "Discount" , color = invcol, textcolor = btmlvl, style = label.style_label_up , size = size.small)
)
dZone.pbx.set_lefttop(int(math.max(phl.topx, phl.bottomx)) , phl.tup)
dZone.pbx.set_rightbottom(b.n + 50 , 0.95 * phl.tup + 0.05 * phl.tdn)
dZone.ebx.set_lefttop(int(math.max(phl.topx, phl.bottomx)), 0.525 * phl.tup + 0.475 * phl.tdn)
dZone.ebx.set_rightbottom(b.n + 50 , 0.525 * phl.tdn + 0.475 * phl.tup)
dZone.lbx.set_lefttop(int(math.max(phl.topx, phl.bottomx)), 0.95 * phl.tdn + 0.05 * phl.tup)
dZone.lbx.set_rightbottom(b.n + 50 , phl.tdn)
dZone.plb.set_xy( int(math.avg(math.max(phl.topx, phl.bottomx), int(b.n + 50))) , phl.tup)
dZone.elb.set_xy( int(b.n + 50) , math.avg(phl.tup, phl.tdn))
dZone.lbl.set_xy( int(math.avg(math.max(phl.topx, phl.bottomx), int(b.n + 50))) , phl.tdn)
if show_mtb
upphl (trend)
dnphl (trend)
hqlzone()
//{----------------------------------------------------------------------------------------------------------------------------------------------}
//{----------------------------------------------------------------------------------------------------------------------------------------------}
//{----------------------------------------------------------------------------------------------------------------------------------------------}
//{----------------------------------------------------------------------------------------------------------------------------------------------}
//{ - End }
//{----------------------------------------------------------------------------------------------------------------------------------------------}
//{----------------------------------------------------------------------------------------------------------------------------------------------}
//{----------------------------------------------------------------------------------------------------------------------------------------------}
//{----------------------------------------------------------------------------------------------------------------------------------------------}
//{----------------------------------------------------------------------------------------------------------------------------------------------}
//{----------------------------------------------------------------------------------------------------------------------------------------------}
//{----------------------------------------------------------------------------------------------------------------------------------------------}
//{----------------------------------------------------------------------------------------------------------------------------------------------}
//{ - Volumetric Order Block }
//{----------------------------------------------------------------------------------------------------------------------------------------------}
//{----------------------------------------------------------------------------------------------------------------------------------------------}
//{----------------------------------------------------------------------------------------------------------------------------------------------}
//{----------------------------------------------------------------------------------------------------------------------------------------------}
method eB(box b, bool ext, color css, bool swing) =>
b.unshift(
box.new(
na
, na
, na
, na
, xloc = xloc.bar_time
, text_font_family = font.family_monospace
, extend = ext ? extend.right : extend.none
, border_color = swing ? color.new(css, 0) : color.new(color.white,100)
, bgcolor = css
, border_width = 1
)
)
method eL(line l, bool ext, bool solid, color css) =>
l.unshift(
line.new(
na
, na
, na
, na
, width = 1
, color = css
, xloc = xloc.bar_time
, extend = ext ? extend.right : extend.none
, style = solid ? line.style_solid : line.style_dashed
)
)
method drawVOB(bool cdn, bool bull, color css, int loc, bool swing) =>
= request.security(
syminfo.tickerid
, ""
,
, lookahead = barmerge.lookahead_off
)
var obC obj = obC.new(
array.new()
, array.new()
, array.new< int >()
, array.new()
, array.new()
, array.new()
, array.new< int >()
, array.new< int >()
, array.new< int >()
, array.new< int >()
, array.new()
, array.new()
, array.new< int >()
)
var obD draw = obD.new(
array.new()
, array.new()
, array.new()
, array.new()
, array.new()
)
if barstate.isfirst
for i = 0 to ob_num - 1
draw.mL .eL(false, false, use_grayscale ? color.new(color.gray, 0) : color.new(css,0))
draw.ob .eB(false, use_grayscale ? color.new(color.gray, 90) : css, swing)
draw.blB.eB(false, css_metric_up , swing)
draw.brB.eB(false, css_metric_dn , swing)
draw.eOB.eB(true , use_grayscale ? color.new(color.gray, 90) : css, swing)
float pos = ob_pos == "Full"
? (bull ? high : low)
: ob_pos == "Middle"
? ohlc4
: ob_pos == "Accurate"
? hl2
: hl2
if cdn
obj.h.clear()
obj.l.clear()
obj.n.clear()
for i = 0 to math.abs((loc - b.n)) - 1
obj.h.push(hH )
obj.l.push(lL )
obj.n.push(b.t )
// obj.h.reverse()
// obj.l.reverse()
int iU = obj.l.indexof(obj.l.min()) + 1
int iD = obj.h.indexof(obj.h.max()) + 1
obj.dir.unshift(
bull
? (b.c > b.o ? 1 : -1)
: (b.c > b.o ? 1 : -1)
)
obj.top.unshift(
bull
? pos
: obj.h.max()
)
obj.btm.unshift(
bull
? obj.l.min()
: pos
)
obj.left.unshift(
bull
? obj.n.get(obj.l.indexof(obj.l.min()))
: obj.n.get(obj.h.indexof(obj.h.max()))
)
obj.avg.unshift(
math.avg(obj.top.first(), obj.btm.first())
)
obj.cV.unshift(
bull
? b.v
: b.v
)
if ob_pos == "Precise"
switch bull
true =>
if obj.avg.get(0) < (b.c < b.o ? b.c : b.o ) and obj.top.get(0) > hlcc4
obj.top.set(0, obj.avg.get(0))
obj.avg.set(0, math.avg(obj.top.first(), obj.btm.first()))
false =>
if obj.avg.get(0) > (b.c < b.o ? b.o : b.c ) and obj.btm.get(0) < hlcc4
obj.btm.set(0, obj.avg.get(0))
obj.avg.set(0, math.avg(obj.top.first(), obj.btm.first()))
obj.blVP.unshift ( 0 )
obj.brVP.unshift ( 0 )
obj.wM .unshift ( 1 )
if use_overlap
int rmP = use_overlap_method == "Recent" ? 1 : 0
if obj.avg.size() > 1
if bull
? obj.btm.first() < obj.top.get(1)
: obj.top.first() > obj.btm.get(1)
obj.wM .remove(rmP)
obj.cV .remove(rmP)
obj.dir .remove(rmP)
obj.top .remove(rmP)
obj.avg .remove(rmP)
obj.btm .remove(rmP)
obj.left .remove(rmP)
obj.blVP .remove(rmP)
obj.brVP .remove(rmP)
if barstate.isconfirmed
for x = 0 to ob_num - 1
tg = switch ob_mitigation
"Middle" => obj.avg
"Absolute" => bull ? obj.btm : obj.top
for in tg
if (bull ? cC < pt : cC > pt)
obj.wM .remove(idx)
obj.cV .remove(idx)
obj.dir .remove(idx)
obj.top .remove(idx)
obj.avg .remove(idx)
obj.btm .remove(idx)
obj.left .remove(idx)
obj.blVP .remove(idx)
obj.brVP .remove(idx)
if barstate.islast
if obj.avg.size() > 0
// Alert
if bull
? ta.crossunder(low , obj.top.get(0))
: ta.crossover (high, obj.btm.get(0))
switch bull
true => blalert.obtouch := true
false => bralert.obtouch := true
float tV = 0
obj.dV.clear()
seq = math.min(ob_num - 1, obj.avg.size() - 1)
for j = 0 to seq
tV += obj.cV.get(j)
if j == seq
for y = 0 to seq
obj.dV.unshift(
math.floor(
(obj.cV.get(y) / tV) * 100)
)
obj.dV.reverse()
for i = 0 to math.min(ob_num - 1, obj.avg.size() - 1)
dmL = draw.mL .get(i)
dOB = draw.ob .get(i)
dblB = draw.blB.get(i)
dbrB = draw.brB.get(i)
deOB = draw.eOB.get(i)
dOB.set_lefttop (obj.left .get(i) , obj.top.get(i))
deOB.set_lefttop (b.t , obj.top.get(i))
dOB.set_rightbottom (b.t , obj.btm.get(i))
deOB.set_rightbottom(b.t + (b.t - b.t ) * 100 , obj.btm.get(i))
if use_middle_line
dmL.set_xy1(obj.left.get(i), obj.avg.get(i))
dmL.set_xy2(b.t , obj.avg.get(i))
if ob_metrics_show
dblB.set_lefttop (obj.left.get(i), obj.top.get(i))
dbrB.set_lefttop (obj.left.get(i), obj.avg.get(i))
dblB.set_rightbottom(obj.left.get(i), obj.avg.get(i))
dbrB.set_rightbottom(obj.left.get(i), obj.btm.get(i))
rpBL = dblB.get_right()
rpBR = dbrB.get_right()
dbrB.set_right(rpBR + (b.t - b.t ) * obj.brVP.get(i))
dblB.set_right(rpBL + (b.t - b.t ) * obj.blVP.get(i))
if use_show_metric
txt = switch
obj.cV.get(i) >= 1000000000 => str.tostring(math.round(obj.cV.get(i) / 1000000000,3)) + "B"
obj.cV.get(i) >= 1000000 => str.tostring(math.round(obj.cV.get(i) / 1000000,3)) + "M"
obj.cV.get(i) >= 1000 => str.tostring(math.round(obj.cV.get(i) / 1000,3)) + "K"
obj.cV.get(i) < 1000 => str.tostring(math.round(obj.cV.get(i)))
deOB.set_text(
str.tostring(
txt + " (" + str.tostring(obj.dV.get(i)) + "%)")
)
deOB.set_text_size (size.auto)
deOB.set_text_halign(text.align_left)
deOB.set_text_color (use_grayscale ? color.silver : color.new(css, 0))
if ob_metrics_show and barstate.isconfirmed
if obj.wM.size() > 0
for i = 0 to obj.avg.size() - 1
switch obj.dir.get(i)
1 =>
switch obj.wM.get(i)
1 => obj.blVP.set(i, obj.blVP.get(i) + 1), obj.wM.set(i, 2)
2 => obj.blVP.set(i, obj.blVP.get(i) + 1), obj.wM.set(i, 3)
3 => obj.brVP.set(i, obj.brVP.get(i) + 1), obj.wM.set(i, 1)
-1 =>
switch obj.wM.get(i)
1 => obj.brVP.set(i, obj.brVP.get(i) + 1), obj.wM.set(i, 2)
2 => obj.brVP.set(i, obj.brVP.get(i) + 1), obj.wM.set(i, 3)
3 => obj.blVP.set(i, obj.blVP.get(i) + 1), obj.wM.set(i, 1)
var hN = array.new(1, b.n)
var lN = array.new(1, b.n)
var hS = array.new(1, b.n)
var lS = array.new(1, b.n)
if iH
hN.pop()
hN.unshift(int(b.n ))
if iL
lN.pop()
lN.unshift(int(b.n ))
if sH
hS.pop()
hS.unshift(int(b.n ))
if sL
lS.pop()
lS.unshift(int(b.n ))
if ob_show
bull_ob.drawVOB(true , ob_bull_css, hN.first(), false)
bear_ob.drawVOB(false, ob_bear_css, lN.first(), false)
if ob_swings
s_bull_ob.drawVOB(true , css_swing_up, hS.first(), true)
s_bear_ob.drawVOB(false, css_swing_dn, lS.first(), true)
if bull_ob
blalert.ob := true
if bear_ob
bralert.ob := true
if s_bull_ob
blalert.swingob := true
if s_bear_ob
blalert.swingob := true
//{----------------------------------------------------------------------------------------------------------------------------------------------}
//{----------------------------------------------------------------------------------------------------------------------------------------------}
//{----------------------------------------------------------------------------------------------------------------------------------------------}
//{----------------------------------------------------------------------------------------------------------------------------------------------}
//{ - End }
//{----------------------------------------------------------------------------------------------------------------------------------------------}
//{----------------------------------------------------------------------------------------------------------------------------------------------}
//{----------------------------------------------------------------------------------------------------------------------------------------------}
//{----------------------------------------------------------------------------------------------------------------------------------------------}
//{----------------------------------------------------------------------------------------------------------------------------------------------}
//{----------------------------------------------------------------------------------------------------------------------------------------------}
//{----------------------------------------------------------------------------------------------------------------------------------------------}
//{----------------------------------------------------------------------------------------------------------------------------------------------}
//{ - FVG | VI | OG }
//{----------------------------------------------------------------------------------------------------------------------------------------------}
//{----------------------------------------------------------------------------------------------------------------------------------------------}
//{----------------------------------------------------------------------------------------------------------------------------------------------}
//{----------------------------------------------------------------------------------------------------------------------------------------------}
ghl() => request.security(syminfo.tickerid, fvg_tf, [high , low , close , open ])
tfG() => request.security(syminfo.tickerid, fvg_tf, )
cG(bool bull) =>
= ghl()
= tfG()
var FVG draw = FVG.new(
array.new()
, array.new()
)
var FVG cords = array.new()
float pup = na
float pdn = na
bool cdn = na
int pos = 2
cc = timeframe.change(fvg_tf)
if barstate.isfirst
for i = 0 to fvg_num - 1
draw.box.unshift(box.new (na, na, na, na, border_color = color.new(color.white, 100), xloc = xloc.bar_time))
draw.ln.unshift (line.new(na, na, na, na, xloc = xloc.bar_time, width = 1, style = line.style_solid))
switch what_fvg
"FVG" =>
pup := bull ? gl : l
pdn := bull ? h : gh
cdn := bull ? gl > h and cc : gh < l and cc
pos := 2
"VI" =>
pup := bull
? (gc > go
? go
: gc)
: (gc > go
? go
: gc )
pdn := bull
? (gc > go
? gc
: go )
: (gc > go
? gc
: go)
cdn := bull
? go > gc and gh > gl and gc > gc and go > go and gh < math.min(gc, go) and cc
: go < gc and gl < gh and gc < gc and go < go and gl > math.max(gc, go) and cc
pos := 1
"OG" =>
pup := bull ? b.l : gl
pdn := bull ? gh : gh
cdn := bull ? gl > gh and cc : gh < gl and cc
pos := 1
if not na(cdn ) and cdn
cords.unshift(
FVG.new(
na
, na
, bull
? true

Futures Playbook: VWAP + OR + Cross-Asset TellsFutures Playbook: VWAP + OR + Cross-Asset Tells (with Trade Messages + Coach Panel)
This all-in-one futures trading toolkit combines Opening Range (OR) levels, VWAP, and cross-asset signals to help traders quickly read intraday structure, manage execution, and filter noise.
Core Features
• Opening Range (OR):
• Customizable OR window with High/Low and Midpoint.
• Automatic shading of the OR zone.
• VWAP & Bands:
• Built-in or session-anchored VWAP.
• Optional standard deviation bands for context.
• Cross-Asset Tells:
• Live reads on US 10Y yield, DXY, Crude, and Gold.
• Regime detection: rates risk, USD strength, energy softness, and real-rate easing.
• Confirmations:
• Volume vs. moving average filter.
• Cumulative delta with smoothing.
• ATR-based chop filter to avoid low-quality trends.
Trade Messages + Coach Panel
• Trade Messages (labels): Automatic on-chart prompts for OR completion, VWAP reclaim/loss, long/short setups, and EU close flows.
• Coach Panel (table): Real-time dashboard with regime context, directional bias, execution notes, risk reminders, and key levels (ORH, ORL, VWAP).
Alerts
• OR breakout (long/short with confirmations).
• VWAP reclaim or loss.
• 10Y yield crossing risk threshold.
Use Case
Designed for futures traders and scalpers who rely on VWAP + OR dynamics and need cross-asset confirmation before committing to trades. Great for structuring entries, managing risk, and filtering market noise throughout the session.

Golden Cross Master Filter by Carlos ChavezForget noisy Golden/Death Cross signals.
This is the **Golden Cross Master Filter** – built for traders who demand institutional-level confirmation.
✅ Exact EMA cross points with circle markers
✅ ATR / ADX / DI+ / DI- / Volume filters
✅ Gap% detection
✅ Visual OK/X dashboard
✅ Instant BUY/SELL labels & ready-to-use alerts
Cut the noise. Trade only the strongest crosses. 🚀
Golden Cross Master Filter is a professional tool to detect Golden and Death Crosses with institutional-grade filtering.
🚀 Features:
- ✅ ATR / ADX / DI+/DI- / Volume conditions
- ✅ Gap% detection (daily gap between yesterday’s close and today’s open)
- ✅ Visual dashboard with OK/X status
- ✅ Exact circle markers at EMA cross points
- ✅ Ready-to-use BUY/SELL labels when filters are confirmed
- ✅ Built-in alerts for easy automation
This indicator is designed for intraday and swing traders who rely on EMA crosses but want to eliminate false signals.
It works across multiple timeframes (10m, 1h, 4h, Daily) and adapts to different trading styles.
Whether you trade CALLs/PUTs or just want stronger confirmation for Golden/Death Crosses, this filter helps you focus only on high-probability setups.
JFC 21:52JFC 21:52 — Brief Description
Concept: Pure time/price rule, no indicators.
Reference: Close at 21:20 (chart/exchange timezone).
Entry (21:52):
– LONG if price is below the 21:20 close.
– SHORT if price is above the 21:20 close.
– Equal → no trade.
Exit: Force close at 22:13.
Frequency: Max one trade per day.
Note: Use 1-minute resolution and the correct chart timezone; market must be trading at those times.
SuperSmoother MA OscillatorSuperSmoother MA Oscillator - Ehlers-Inspired Lag-Minimized Signal Framework
Overview
The SuperSmoother MA Oscillator is a crossover and momentum detection framework built on the pioneering work of John F. Ehlers, who introduced digital signal processing (DSP) concepts into technical analysis. Traditional moving averages such as SMA and EMA are prone to two persistent flaws: excessive lag, which delays recognition of trend shifts, and high-frequency noise, which produces unreliable whipsaw signals. Ehlers’ SuperSmoother filter was designed to specifically address these flaws by creating a low-pass filter with minimal lag and superior noise suppression, inspired by engineering methods used in communications and radar systems.
This oscillator extends Ehlers’ foundation by combining the SuperSmoother filter with multi-length moving average oscillation, ATR-based normalization, and dynamic color coding. The result is a tool that helps traders identify market momentum, detect reliable crossovers earlier than conventional methods, and contextualize volatility and phase shifts without being distracted by transient price noise.
Unlike conventional oscillators, which either oversimplify price structure or overload the chart with reactive signals, the SuperSmoother MA Oscillator is designed to balance responsiveness and stability. By preprocessing price data with the SuperSmoother filter, traders gain a signal framework that is clean, robust, and adaptable across assets and timeframes.
Theoretical Foundation
Traditional MA oscillators such as MACD or dual-EMA systems react to raw or lightly smoothed price inputs. While effective in some conditions, these signals are often distorted by high-frequency oscillations inherent in market data, leading to false crossovers and poor timing. The SuperSmoother approach modifies this dynamic: by attenuating unwanted frequencies, it preserves structural price movements while eliminating meaningless noise.
This is particularly useful for traders who need to distinguish between genuine market cycles and random short-term price flickers. In practical terms, the oscillator helps identify:
Early trend continuations (when fast averages break cleanly above/below slower averages).
Preemptive breakout setups (when compressed oscillator ranges expand).
Exhaustion phases (when oscillator swings flatten despite continued price movement).
Its multi-purpose design allows traders to apply it flexibly across scalping, day trading, swing setups, and longer-term trend positioning, without needing separate tools for each.
The oscillator’s visual system - fast/slow lines, dynamic coloration, and zero-line crossovers - is structured to provide trend clarity without hiding nuance. Strong green/red momentum confirms directional conviction, while neutral gray phases emphasize uncertainty or low conviction. This ensures traders can quickly gauge the market state without losing access to subtle structural signals.
How It Works
The SuperSmoother MA Oscillator builds signals through a layered process:
SuperSmoother Filtering (Ehlers’ Method)
At its core lies Ehlers’ two-pole recursive filter, mathematically engineered to suppress high-frequency components while introducing minimal lag. Compared to traditional EMA smoothing, the SuperSmoother achieves better spectral separation - it allows meaningful cyclical market structures to pass through, while eliminating erratic spikes and aliasing. This makes it a superior preprocessing stage for oscillator inputs.
Fast and Slow Line Construction
Within the oscillator framework, the filtered price series is used to build two internal moving averages: a fast line (short-term momentum) and a slow line (longer-term directional bias). These are not plotted directly on the chart - instead, their relationship is transformed into the oscillator values you see.
The interaction between these two internal averages - crossovers, separation, and compression - forms the backbone of trend detection:
Uptrend Signal : Fast MA rises above the slow MA with expanding distance, generating a positive oscillator swing.
Downtrend Signal : Fast MA falls below the slow MA with widening divergence, producing a negative oscillator swing.
Neutral/Transition : Lines compress, flattening the oscillator near zero and often preceding volatility expansion.
This design ensures traders receive the information content of dual-MA crossovers while keeping the chart visually clean and focused on the oscillator’s dynamics.
ATR-Based Normalization
Markets vary in volatility. To ensure the oscillator behaves consistently across assets, ATR (Average True Range) normalization scales outputs relative to prevailing volatility conditions. This prevents the oscillator from appearing overly sensitive in calm markets or too flat during high-volatility regimes.
Dynamic Color Coding
Color transitions reflect underlying market states:
Strong Green : Bullish alignment, momentum expanding.
Strong Red : Bearish alignment, momentum expanding.
These visual cues allow traders to quickly gauge trend direction and strength at a glance, with expanding colors indicating increasing conviction in the underlying momentum.
Interpretation
The oscillator offers a multi-dimensional view of price dynamics:
Trend Analysis : Fast/slow line alignment and zero-line interactions reveal trend direction and strength. Expansions indicate momentum building; contractions flag weakening conditions or potential reversals.
Momentum & Volatility : Rapid divergence between lines reflects increasing momentum. Compression highlights periods of reduced volatility and possible upcoming expansion.
Cycle Awareness : Because of Ehlers’ DSP foundation, the oscillator captures market cycles more cleanly than conventional MA systems, allowing traders to anticipate turning points before raw price action confirms them.
Divergence Detection : When oscillator momentum fades while price continues in the same direction, it signals exhaustion - a cue to tighten stops or anticipate reversals.
By focusing on filtered, volatility-adjusted signals, traders avoid overreacting to noise while gaining early access to structural changes in momentum.
Strategy Integration
The SuperSmoother MA Oscillator adapts across multiple trading approaches:
Trend Following
Enter when fast/slow alignment is strong and expanding:
A fast line crossing above the slow line with expanding green signals confirms bullish continuation.
Use ATR-normalized expansion to filter entries in line with prevailing volatility.
Breakout Trading
Periods of compression often precede breakouts:
A breakout occurs when fast lines diverge decisively from slow lines with renewed green/red strength.
Exhaustion and Reversals
Oscillator divergence signals weakening trends:
Flattening momentum while price continues trending may indicate overextension.
Traders can exit or hedge positions in anticipation of corrective phases.
Multi-Timeframe Confluence
Apply the oscillator on higher timeframes to confirm the directional bias.
Use lower timeframes for refined entries during compression → expansion transitions.
Technical Implementation Details
SuperSmoother Algorithm (Ehlers) : Recursive two-pole filter minimizes lag while removing high-frequency noise.
Oscillator Framework : Fast/slow MAs derived from filtered prices.
ATR Normalization : Ensures consistent amplitude across market regimes.
Dynamic Color Engine : Aligns visual cues with structural states (expansion and contraction).
Multi-Factor Analysis : Combines crossover logic, volatility context, and cycle detection for robust outputs.
This layered approach ensures the oscillator is highly responsive without overloading charts with noise.
Optimal Application Parameters
Asset-Specific Guidance:
Forex : Normalize with moderate ATR scaling; focus on slow-line confirmation.
Equities : Balance responsiveness with smoothing; useful for capturing sector rotations.
Cryptocurrency : Higher ATR multipliers recommended due to volatility.
Futures/Indices : Lower frequency settings highlight structural trends.
Timeframe Optimization:
Scalping (1-5min) : Higher sensitivity, prioritize fast-line signals.
Intraday (15m-1h) : Balance between fast/slow expansions.
Swing (4h-Daily) : Focus on slow-line momentum with fast-line timing.
Position (Daily-Weekly) : Slow lines dominate; fast lines highlight cycle shifts.
Performance Characteristics
High Effectiveness:
Trending environments with moderate-to-high volatility.
Assets with steady liquidity and clear cyclical structures.
Reduced Effectiveness:
Flat/choppy conditions with little directional bias.
Ultra-short timeframes (<1m), where noise dominates.
Integration Guidelines
Confluence : Combine with liquidity zones, order blocks, and volume-based indicators for confirmation.
Risk Management : Place stops beyond slow-line thresholds or ATR-defined zones.
Dynamic Trade Management : Use expansions/contractions to scale position sizes or tighten stops.
Multi-Timeframe Confirmation : Filter lower-timeframe entries with higher-timeframe momentum states.
Disclaimer
The SuperSmoother MA Oscillator is an advanced trend and momentum analysis tool, not a guaranteed profit system. Its effectiveness depends on proper parameter settings per asset and disciplined risk management. Traders should use it as part of a broader technical framework and not in isolation.

Alerta 10 Velas Consecutivas (Bull/Bear)despues de 10 velas alcista o bajitas probabilidad que haga reversion
Sessions Highs & Lows with MTF Zones [AlgoRich] Sessions Highs & Lows with MTF Zones — Description for Publication
What it does
This indicator marks and works with intra-session extremes and repeating liquidity zones:
Three configurable sessions (Asia / London / NY) with user-defined hours and colors. It shades the background during each session in your time zone (default UTC-3).
Session High/Low: while a session is open, it continuously updates its High/Low; when the session closes, it places labels at the exact bars where those extremes occurred (using the session name).
Equal Highs / Equal Lows (EQH / EQL) detection based on pivots and an ATR tolerance threshold. When two highs (or lows) are detected as “nearly equal,” it draws a line between them and tags EQH/EQL, highlighting potential liquidity/reaction areas.
How it works (under the hood)
The internal function f_sesion() checks whether a bar belongs to a session, whether it’s the start or end, and stores the session hi/lo and their bar_index. When the session ends, it creates the high/low labels.
Pivots are computed with ta.pivothigh / ta.pivotlow using pivotLength.
“Equality” between two extremes is decided by:
|Extreme1 − Extreme2| ≤ ATR(confluenceAtrLength) × threshold.
If Wait For Confirmation is enabled, the pivot must be fully formed (fewer signals, more robust). If disabled, it confirms with only 1 bar to the right (faster, more sensitive).
Parameters
General
UTC Zone: string like UTC-3 to evaluate session times correctly.
Session 1 / 2 / 3
Session name (e.g., Asia, London, NY).
Hours (format HHMM-HHMM, 24h).
Background shading ON/OFF and background color.
Label colors for the session’s High and Low.
Settings
Pivot Length: left/right bars to form a pivot.
ATR Length: ATR period used for the equality tolerance.
Threshold (0–1): ATR multiplier to decide whether two extremes are “equal” (e.g., 0.10 = difference ≤ 0.1 × ATR).
Wait For Confirmation: true = fully confirmed pivots; false = quicker confirmation (more anticipation, more noise).
Reading & suggested use
Session High/Low often act as liquidity references and potential resistance/support for the following session.
EQH/EQL can point to resting liquidity (areas prone to sweeps or breaks).
Use it as a map: combine these references with your plan (e.g., London/NY ORB, VWAP, order blocks).
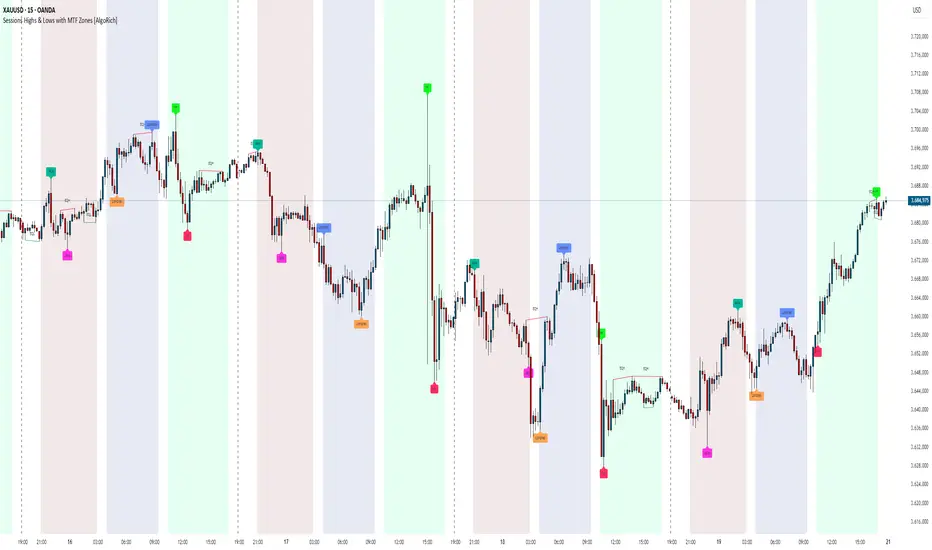
Pairs Trading Scanner [BackQuant]Pairs Trading Scanner
What it is
This scanner analyzes the relationship between your chart symbol and a chosen pair symbol in real time. It builds a normalized “spread” between them, tracks how tightly they move together (correlation), converts the spread into a Z-Score (how far from typical it is), and then prints clear LONG / SHORT / EXIT prompts plus an at-a-glance dashboard with the numbers that matter.
Why pairs at all?
Markets co-move. When two assets are statistically related, their relationship (the spread) tends to oscillate around a mean.
Pairs trading doesn’t require calling overall market direction you trade the relative mispricing between two instruments.
This scanner gives you a robust, visual way to find those dislocations, size their significance, and structure the trade.
How it works (plain English)
Step 1 Pick a partner: Select the Pair Symbol to compare against your chart symbol. The tool fetches synchronized prices for both.
Step 2 Build a spread: Choose a Spread Method that defines “relative value” (e.g., Log Spread, Price Ratio, Return Difference, Price Difference). Each lens highlights a different flavor of divergence.
Step 3 Validate relationship: A rolling Correlation checks if the pair is moving together enough to be tradable. If correlation is weak, the scanner stands down.
Step 4 Standardize & score: The spread is normalized (mean & variability over a lookback) to form a Z-Score . Large absolute Z means “stretched,” small means “near fair.”
Step 5 Signals: When the Z-Score crosses user-defined thresholds with sufficient correlation , entries print:
LONG = long chart symbol / short pair symbol,
SHORT = short chart symbol / long pair symbol,
EXIT = mean reversion into the exit zone or correlation failure.
Core concepts (the three pillars)
Spread Method Your definition of “distance” between the two series.
Guidance:
Log Spread: Focuses on proportional differences; robust when prices live on different scales.
Price Ratio: Classic relative value; good when you care about “X per Y.”
Return Difference: Emphasizes recent performance gaps; nimble for momentum-to-mean plays.
Price Difference: Straight subtraction; intuitive for similar-scale assets (e.g., two ETFs).
Correlation A rolling score of co-movement. The scanner requires it to be above your Min Correlation before acting, so you’re not trading random divergence.
Z-Score “How abnormal is today’s spread?” Positive = chart richer than pair; negative = cheaper. Thresholds define entries/exits with transparent, statistical context.
What you’ll see on the chart
Correlation plot (blue line) with a dashed Min Correlation guide. Above the line = green zone for signals; below = hands off.
Z-Score plot (white line) with colored, dashed Entry bands and dotted Exit bands. Zero line for mean.
Normalized spread (yellow) for a quick “shape read” of recent divergence swings.
Signal markers :
LONG (green label) when Z < –Entry and corr OK,
SHORT (red label) when Z > +Entry and corr OK,
EXIT (gray label) when Z returns inside the Exit band or correlation drops below the floor.
Background tint for active state (faint green for long-spread stance, faint red for short-spread stance).
The two built-in dashboards
Statistics Table (top-right)
Pair Symbol Your chosen partner.
Correlation Live value vs. your minimum.
Z-Score How stretched the spread is now.
Current / Pair Prices Real-time anchors.
Signal State NEUTRAL / LONG / SHORT.
Price Ratio Context for ratio-style setups.
Analysis Table (bottom-right)
Avg Correlation Typical co-movement level over your window.
Max |Z| The recent extremes of dislocation.
Spread Volatility How “lively” the spread has been.
Trade Signal A human-readable prompt (e.g., “LONG A / SHORT B” or “NO TRADE” / “LOW CORRELATION”).
Risk Level LOW / MEDIUM / HIGH based on current stretch (absolute Z).
Signals logic (plain English)
Entry (LONG): The spread is unusually negative (chart cheaper vs pair) and correlation is healthy. Expect mean reversion upward in the spread: long chart, short pair.
Entry (SHORT): The spread is unusually positive (chart richer vs pair) and correlation is healthy. Expect mean reversion downward in the spread: short chart, long pair.
Exit: The spread relaxes back toward normal (inside your exit band), or correlation deteriorates (relationship no longer trusted).
A quick, repeatable workflow
1) Choose your pair in context (same sector/theme or known macro link). Think: “Do these two plausibly co-move?”
2) Pick a spread lens that matches your narrative (ratio for relative value, returns for short-term performance gaps, etc.).
3) Confirm correlation is above your floor no corr, no trade.
4) Wait for a stretch (Z beyond Entry band) and a printed LONG / SHORT .
5) Manage to the mean (EXIT band) or correlation failure; let the scanners’ state/labels keep you honest.
Settings that matter (and why)
Spread Method Defines the “mispricing” you care about.
Correlation Period Longer = steadier regime read, shorter = snappier to regime change.
Z-Score Period The window that defines “normal” for the spread; it sets the yardstick.
Use Percentage Returns Normalizes series when using return-based logic; keep on for mixed-scale assets.
Entry / Exit Thresholds Set your stretch and your target reversion zone. Wider entries = rarer but stronger signals.
Minimum Correlation The gatekeeper. Raising it favors quality over quantity.
Choosing pairs (practical cheat sheet)
Same family: two index ETFs, two oil-linked names, two gold miners, two L1 tokens.
Hedge & proxy: stock vs. sector ETF, BTC vs. BTC index, WTI vs. energy ETF.
Cross-venue or cross-listing: instruments that are functionally the same exposure but price differently intraday.
Reading the cues like a pro
Divergence shape: The yellow normalized spread helps you see rhythm fast spike and snap-back versus slow grind.
Corr-first discipline: Don’t fight the “Min Correlation” line. Good pairs trading starts with a relationship you can trust.
Exit humility: When Z re-centers, let the EXIT do its job. The edge is the journey to the mean, not overstaying it.
Frequently asked (quick answers)
“Long/Short means what exactly?”
LONG = long the chart symbol and short the pair symbol.
SHORT = short the chart symbol and long the pair symbol.
“Do I need same price scales?” No. The spread methods normalize in different ways; choose the one that fits your use case (log/ratio are great for mixed scales).
“What if correlation falls mid-trade?” The scanner will neutralize the state and print EXIT . Relationship first; trade second.
Field notes & patterns
Snap-back days: After a one-sided session, return-difference spreads often flag cleaner intraday mean reversions.
Macro rotations: Ratio spreads shine during sector re-weights (e.g., value vs. growth ETFs); look for steady corr + elevated |Z|.
Event bleed-through: If one symbol reacts to news and its partner lags, Z often flags a high-quality, short-horizon re-centering.
Display controls at a glance
Show Statistics Table Live state & key numbers, top-right.
Show Analysis Table Context/risk read, bottom-right.
Show Correlation / Spread / Z-Score Toggle the sub-charts you want visible.
Show Entry/Exit Signals Turn markers on/off as needed.
Coloring Adjust Long/Short/Neutral and correlation line colors to match your theme.
Alerts (ready to route to your workflow)
Pairs Long Entry Z falls through the long threshold with correlation above minimum.
Pairs Short Entry Z rises through the short threshold with correlation above minimum.
Pairs Trade Exit Z returns to neutral or the relationship fails your correlation floor.
Correlation Breakdown Rolling correlation crosses your minimum; relationship caution.
Final notes
The scanner is designed to keep you systematic: require relationship (correlation), quantify dislocation (Z-Score), act when stretched, stand down when it normalizes or the relationship degrades. It’s a full, visual loop for relative-value trading that stays out of your way when it should and gets loud only when the numbers line up.

Adaptive Pivot Zones█ OVERVIEW
The "Adaptive Pivot Zones" indicator is a versatile tool designed to identify and visualize key pivot levels directly on the price chart. By detecting pivot highs and lows, the indicator calculates dynamic support and resistance zones based on user-defined levels (default: 0.382, 0.5, 0.618). These zones adapt to market volatility, providing traders with clear visual cues for potential reversal or continuation points. The indicator offers extensive customization options, such as adjusting colors, smoothing lines, and setting fill transparency, making it highly adaptable to various trading styles.
█ CONCEPTS
The "Adaptive Pivot Zones" indicator simplifies the identification of significant price levels by plotting three dynamic pivot lines, which can be smoothed to reduce market noise. The indicator dynamically changes the colors of the lines and fill zones based on price action, using bullish, bearish, or neutral colors to reflect market sentiment.
█ CALCULATIONS
The indicator relies on the following calculations:
- Pivot Detection: Pivot highs (ta.pivothigh) and pivot lows (ta.pivotlow) are identified using a user-defined pivot length (default: 10). Pivots represent significant price peaks and troughs. Higher pivot length values produce more stable levels but introduce a delay equal to the set value. For more aggressive strategies, the pivot length can be reduced.
- Pivot Levels: When both a pivot high and low are detected, the range between them is calculated (rng = drHigh - drLow). Three pivot levels are computed as:
Line 1: drLow + rng * pivotLevel1
Line 2: drLow + rng * pivotLevel2
Line 3: drLow + rng * pivotLevel3
- Smoothing: Pivot lines can be smoothed using a simple moving average (SMA) with a user-defined smoothing length (default: 1) to reduce noise and improve readability.
- Color Logic: Lines and fill zones are colored based on the price position relative to the pivot zones:
If the price is below the lowest pivot line, a bearish color is used (default: red).
If the price is above the highest pivot line, a bullish color is used (default: green).
If the price is within the pivot zones and the neutral color option is enabled, a neutral color is used (default: gray); otherwise, the previous color is retained.
- Fill Zones: The areas between pivot lines are filled with a user-defined transparency level (default: 80) to visually highlight support and resistance zones.
█ INDICATOR FEATURES
- Dynamic Pivot Lines: Three adaptive pivot lines (default levels: 0.382, 0.5, 0.618) are plotted on the price chart, adjusting to market volatility.
- Smoothing: User-defined smoothing length (default: 1) for pivot lines to reduce noise and enhance signal clarity.
- Dynamic Coloring: Lines and fill zones change color based on price action (bullish, bearish, or neutral when the price moves within the zone), reflecting market sentiment.
- Fill Zones: Transparent fills between pivot lines to visually highlight support and resistance zones.
- Customization: Options to adjust pivot length, pivot levels, smoothing, colors, transparency, and enable/disable neutral color logic.
█ HOW TO SET UP THE INDICATOR
- Add the "Adaptive Pivot Zones" indicator to your TradingView chart.
- Configure parameters in the settings, such as pivot length, pivot levels, smoothing length, and colors, to align with your trading strategy. Without smoothing, lines behave like levels; with smoothing, they act like bands. All three levels can be set to the same value to obtain a single level or a line behaving like a moving average derived from pivots.
- Enable or disable the neutral color option (for prices moving within the zone) and adjust fill transparency for optimal visualization.
- Adjust line thickness and style in the "Style" section to improve chart readability.
Example of bands – lines behave like support/resistance zones.
Example of a moving average derived from pivots – line behaves like a pivot-based MA.
█ HOW TO USE
Add the indicator to your chart, adjust the settings, and observe price interactions with the pivot lines and zones to identify potential trading opportunities. Key signals include:
- Price Interaction with Pivot Lines: When the price approaches or crosses a pivot line, it may indicate a potential support or resistance level. A bounce from a pivot line could signal a reversal, while a breakout might suggest trend continuation.
- Zone-Based Signals and Trend Line Usage: Price movement within or outside the filled zones can indicate market sentiment. Price below the lowest pivot line suggests bearish momentum, price above the highest pivot line suggests bullish momentum, and price within the zones may indicate consolidation. With higher pivot length values, the indicator can be used as a trend line, particularly during clear market movements.
- Color Changes: Shifts in line and fill colors (bullish, bearish, or neutral) provide visual cues about changing market conditions.
- Confirmation with Other Tools: Combine the indicator with tools like RSI or Bollinger Bands to validate signals and improve trade accuracy. For example, a buy signal from RSI in the oversold zone combined with a bounce from the lowest pivot line may indicate a strong entry point.
Entry Signals (Long/Short)The indicator visualizes precise entry signals for long and short setups directly on the price chart. Long is marked with a green triangle-up, short with a red triangle-down. To contextualize trend structure, the Fast EMA (5) is plotted in black and the Slow EMA (20) in blue (line width 1). Signals print only at bar close for reproducible execution. Applicable across all timeframes—ideal for top-down analysis from the 195-minute chart through daily to weekly.
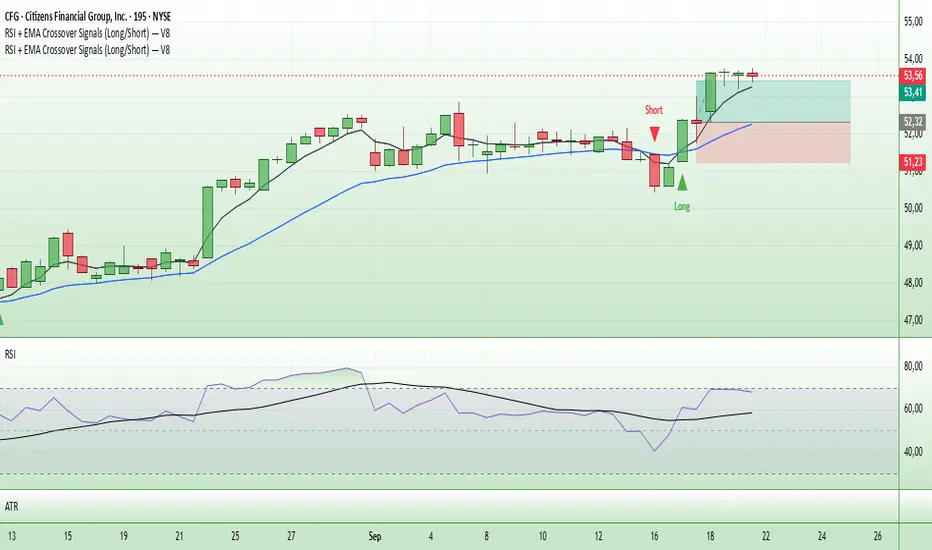
Short Monday , Long TuesdayKillaxbt create this concept. Often BTC create this pattern:
Monday Short ✔️
Tuesday Long ✔️
Wednesday... Lets give it a test during Asia. Just remember who shared this first. 😉
Thursday is pivot. Depending on the narrative leading into thursday... we determine direction. ⚡️
This concept is graphic, he show where you are and where we can go. He give you a plan for the week
Concept : @killaxbt
Code by @paulbri

Reversión 3 velas grandes lejos de EMA3reversión después de 3 velas grandes alcistas o bajistas en media movil de 3 periodos

Linear Regression Oscillato Alerts Revision 9/21 [ChartPrime]I published this last week but it didnt seem to do what I wanted so Ive revised it. I think Ive got it to where when the word reversal and the hollow diamond appear, it should send an alert. We'll find out tomorrow if it works. If not I'll keep trying.

ARO Pro — Adaptive Regime OscillatorARO Pro — Adaptive Regime Oscillator (v6)
ARO Pro turns your chart into a context-aware decision system. It classifies every bar as Trending (up or down) or Ranging in real time, then switches its math to match the regime: trend strength is measured with an ATR-normalized EMA spread, while range behavior is tracked with a center-based RSI oscillator. The result is cleaner entries, fewer false signals, and faster reads on regime shifts—without repainting.
⸻
How it works (under the hood)
1. Regime Detection (Kaufman ER):
ARO computes Kaufman’s Efficiency Ratio (ER) over a user-defined length.
- ER > threshold → Trending (direction from EMA fast vs. EMA slow)
- ER ≤ threshold → Ranging
2. Adaptive Oscillator Core:
- Trend mode: (EMA(fast) − EMA(slow)) / ATR * 100 → momentum normalized by volatility.
- Range mode: RSI(length) − 50 → mean-reversion pressure around zero.
3. Volatility Filter (optional):
Blocks signals if ATR as % of price is below a floor you set. This reduces noise in thin or quiet markets.
4. MTF Trend Filter (optional & non-repainting):
Confirms signals only if a higher timeframe EMA(fast) > EMA(slow) for longs (or < for shorts). Implemented with lookahead_off and gaps_on.
5. Confirmation & Alerts:
Signals are locked only on bar close (barstate.isconfirmed) and offered via three alert types: ARO Long, ARO Short, ARO Regime Shift.
⸻
What you see on the chart
• Background heat:
• Green = Trending Up, Red = Trending Down, Gray = Range.
• ARO line (panel): Adaptive oscillator (trend/value colors).
• Signal markers: ▲ Long / ▼ Short on confirmed bars.
• Guide lines: Upper/Lower thresholds (±K) and zero line.
• Info Panel (table): Regime, ER, ATR %, ARO, HTF status (OK/BLOCK/OFF), and a Confidence light.
• Debug Overlay (optional): Quick view of thresholds and raw conditions for tuning.
⸻
Inputs (quick reference)
• Signals: Fast/Slow EMA, RSI length, ER length & threshold, oscillator smoothing, signal threshold.
• Filters: ATR length, minimum ATR% (volatility floor), toggle for volatility filter.
• Visuals: Background on/off, Info Panel on/off, Debug overlay on/off.
• MTF (safe): Toggle + HTF timeframe (e.g., 240, D, W).
⸻
Interpreting signals
• Long: Trend regime AND fast EMA > slow EMA AND ARO ≥ +threshold (confirmed bar, filters passing).
• Short: Trend regime AND fast EMA < slow EMA AND ARO ≤ −threshold (confirmed bar, filters passing).
• Regime Shift: Alert when ER moves the market from Range → Trend or flips trend direction.
⸻
Practical use cases & examples
1) Intraday momentum alignment (scalps to day trades)
• Timeframes: 5–15m with HTF filter = 4H.
• Flow:
1. Wait for Trend Up background + HTF OK.
2. Enter on ▲ Long when ARO crosses above +threshold.
3. Stops: 1–1.5× ATR(14) below trigger bar or below last micro swing.
4. Exits: Partial at 1× ATR, trail remainder with an ATR stop or when ARO reverts to zero/Regime Shift.
• Why it works: You’re trading with the dominant higher-timeframe structure while avoiding low-volatility fakeouts.
2) Swing trend following (cleaner trend legs)
• Timeframes: 1H–4H with HTF filter = 1D.
• Flow:
1. Only act in Trend background aligned with HTF.
2. Add on subsequent ▲ signals as ARO maintains positive (or negative) territory.
3. Reduce or exit on Regime Shift (Trend → Range or direction flip) or when ARO crosses back through zero.
• Stops/targets: Initial 1.5–2× ATR; move to breakeven once the trade gains 1× ATR; trail with a multiple-ATR or structure lows/highs.
3) Range tactics (fade the extremes)
• Timeframes: 15m–1H or 1D on mean-reverting names.
• Flow:
1. Act only when background = Range.
2. Fade moves when ARO swings from ±extremes back toward zero near well-defined S/R.
3. Exit at the opposite band or zero line; abort if a Regime Shift to Trend occurs.
• Tip: Increase ER threshold (e.g., 0.35–0.40) to label more bars as Range on choppy instruments.
4) Event days & macro filters
• Approach: Raise the volatility floor (Min ATR%) on macro days (FOMC, CPI).
• Effect: You’ll ignore “fake” micro swings in the minutes leading up to releases and catch only post-event confirmed momentum.
⸻
Parameter tuning guide
• ER Threshold:
• Lower (0.20–0.30) = more Trend bars, more signals, higher noise.
• Higher (0.35–0.45) = stricter trend confirmation, fewer but cleaner signals.
• Signal Threshold (±K):
• Raise to reduce whipsaws; lower for earlier but noisier triggers.
• Volatility Floor (ATR%):
• Thin/quiet assets benefit from a higher floor (e.g., 0.3–0.6).
• Highly liquid futures/forex can work with lower floors.
• HTF Filter:
• Keep it ON when you want higher win consistency; turn OFF for tactical counter-trend plays.
⸻
Alerts (recommended setup)
• “ARO Long” / “ARO Short”: Entry-style alerts on confirmed signals.
• “ARO Regime Shift”: Context alert to scale in/out or switch playbooks (trend vs. range).
All alerts are non-repainting and fire only when the bar closes.
⸻
Best practices & combinations
• Price action & S/R: Use ARO to define when to engage, and price structure to define where (breakout levels, pullback zones).
• VWAP/Session tools: In intraday trends, ▲ signals above VWAP tend to carry; avoid shorts below session VWAP in strong downtrends.
• Risk first: Size by ATR; never let a single ARO event override your max risk per trade.
• Portfolio filter: On indices/ETFs, enable HTF filter and a stricter ER threshold to ride regime legs.
⸻
Non-repaint and implementation notes
• The script does not repaint:
• Signals are computed and locked on bar close (barstate.isconfirmed).
• All higher-timeframe data uses request.security(..., lookahead_off, gaps_on).
• No future indexing or negative offsets are used.
• The Info Panel and Debug overlay are purely visual aids and do not change signal logic.
⸻
Limitations & tips
• Chop sensitivity: In hyper-choppy symbols, consider raising ER threshold and the signal threshold, and enable HTF filter.
• Instrument personality: EMAs/RSI lengths and volatility floor often need a quick 2–3 minute tune per asset class (FX vs. crypto vs. equities).
• No guarantees: ARO improves context and timing, but it is not a promise of profitability—always combine with risk management.
⸻
Quick start (TL;DR)
1. Timeframes: 5–15m intraday (HTF = 4H); 1H–4H swing (HTF = 1D).
2. Use defaults, then tune ER threshold (0.25–0.40) and Signal threshold (±20).
3. Enable Volatility Floor (e.g., 0.2–0.5 ATR%) on quiet assets.
4. Trade ▲ / ▼ only in matching Trend background; fade extremes only in Range background.
5. Set alerts for Long, Short, and Regime Shift; manage risk with ATR stops.
⸻
Author’s note: ARO Pro is designed to be clear, adaptive, and operational out of the box. If you publish variants (e.g., different ER logic, alternative trend cores), please credit the original and document any changes so users can compare behavior reliably.

ASX Historical Price Projection [360 Days Auto]The ASX Price Projection indicator is a forecasting tool that projects future price movement based on historical price action and user-defined parameters. Inspired by the cyclical nature of markets, this tool helps traders visualize how price could behave in the future — not with certainty, but as a modeled possibility based on past behavior patterns.
What It Does:
This tool replicates the price action from a chosen historical period and projects it into the future, optionally applying a drift factor (growth or contraction). This projection is visualized directly on the chart, helping traders anticipate potential future price paths based on recognizable past behavior.
How It Works:
The indicator automatically uses the most recent 360 bars of historical data as the projection template. This is fixed and not user-selectable.
The selected price segment is replicated and extended into the future to simulate a possible price path.
A Drift Factor (Growth Multiplier) can be applied to simulate bullish (positive) or bearish (negative) price drift.
An Area Width parameter defines how wide the projection zone appears around the forecast line, helping to visualize uncertainty or price range tolerance.
The projected path and its surrounding band are plotted forward from the current bar.
Why It’s Unique:
This script offers a simple yet powerful way to model potential future price action based on automatic historical pattern detection:
No manual selection required — the last 360 bars are always used.
The Drift Factor allows scenario testing for growth or decline.
Area Width gives a realistic band around the projected path.
Designed for visual modeling and hypothetical exploration — not predictive accuracy.
How to Use:
Load the indicator on any chart.
The system automatically pulls the last 360 bars to generate the projection.
Adjust the Drift Factor to simulate optimistic or pessimistic market scenarios.
Set the Area Width to control the visual range around the projected line.
Use the forecast to explore how price might evolve under similar conditions.

Katz Candle Momentum Reversal Indicator v4.1Katz Candle Momentum Reversal Indicator (CMRI) v4.1
Overview
The Katz CMRI is a comprehensive trading indicator designed to identify trend direction, momentum shifts, and potential market reversals. It combines several different concepts into a single, cohesive visual tool.
At its core, the indicator uses a custom Line Break chart calculation to filter out market noise and a Heikin-Ashi-style formula to smooth price action. This combination helps to more clearly define the underlying trend. The main output is a dynamic, multi-colored trend line accompanied by various signals that appear directly on your chart. It's designed to help traders stay with the trend while also spotting key moments of expansion, contraction, and potential reversal.
How to Interpret the Indicator
The indicator has several key visual components:
Main Trend Line: This is the thick, central line that changes color.
Green: Indicates a bullish (upward) trend.
Red: Indicates a bearish (downward) trend.
Faded/Light Colors: Suggest a potential loss of momentum or a pullback within the trend.
White: Signals a significant break in the trend structure.
Trend Cloud: The shaded area between the main trend line and the white midline (mid). A green cloud shows the trend is above the midpoint, while a red cloud shows it's below.
Upper/Lower Bands: The aqua (Trend Up) and yellow (Trend Down) lines represent the recent highs and lows of the established trend. When price is pushing against these bands, it signals trend strength.
Background Colors:
Gray: A "Contraction Zone." This indicates that the trend is losing momentum and consolidating, warning of potential chop or a reversal.
Blue: An "Expansion Event." This highlights a sudden increase in momentum in the direction of the trend.
Signal Shapes:
Diamonds: These are the primary entry signals. A green diamond below a candle signals a potential long entry, while a red diamond above a candle signals a potential short entry.
⬆️⬇️ Arrows: These are secondary momentum signals. They can be used as confirmation that the trend is continuing.
Trading Strategy & Rules
This strategy uses the primary diamond signals for entries and trend changes for exits.
Long Trade (Buy) Rules
Entry: Wait for a green diamond to appear below the price candles. For confirmation, the main trend line should turn solid green, and the price should ideally be above the white midline.
Exit:
Stop Loss: Place a stop loss below the recent swing low or below the candle where the green diamond appeared.
Take Profit: Consider exiting the trade when a red diamond appears above the candles, signaling a potential trend reversal. Alternatively, a trader might exit if the background turns gray (Contraction Zone), indicating the bullish momentum has faded.
Short Trade (Sell) Rules
Entry: Wait for a red diamond to appear above the price candles. For confirmation, the main trend line should turn solid red, and the price should ideally be below the white midline.
Exit:
Stop Loss: Place a stop loss above the recent swing high or above the candle where the red diamond appeared.
Take Profit: Consider exiting the trade when a green diamond appears below the candles. A gray "Contraction Zone" can also serve as an early warning to exit as bearish momentum wanes.
Indicator Filters Explained
The indicator includes a "Trend Filter Type" setting that allows you to adjust its sensitivity. This can help reduce false signals in choppy markets.
Raw: This is the most sensitive setting. It will generate a trend change signal as soon as the basic conditions are met. Use this for scalping or in strongly trending markets, but be aware that it may produce more false signals.
OutStep: This is the default, balanced setting. It adds an extra layer of confirmation by requiring the main trend line itself to be moving in the direction of the new trend. For example, a new green signal will only be confirmed if the trend line's value is higher than its previous value. This helps filter out weak signals.
FullStep: This is the most conservative and filtered setting. It includes the "OutStep" logic and adds further conditions related to the upper and lower trend bands. This setting will produce the fewest signals, but they are generally the highest quality, making it suitable for swing trading or avoiding choppy market conditions.
Disclaimer
This indicator is a tool for technical analysis and should not be considered financial advice. All trading involves substantial risk, including the possible loss of principal. Past performance is not indicative of future results. The signals generated by this indicator are for educational and informational purposes only. You are solely responsible for any trading decisions you make. Use this indicator at your own risk.
