PROTECTED SOURCE SCRIPT
[PRINCESS FOREX STRATEGY]
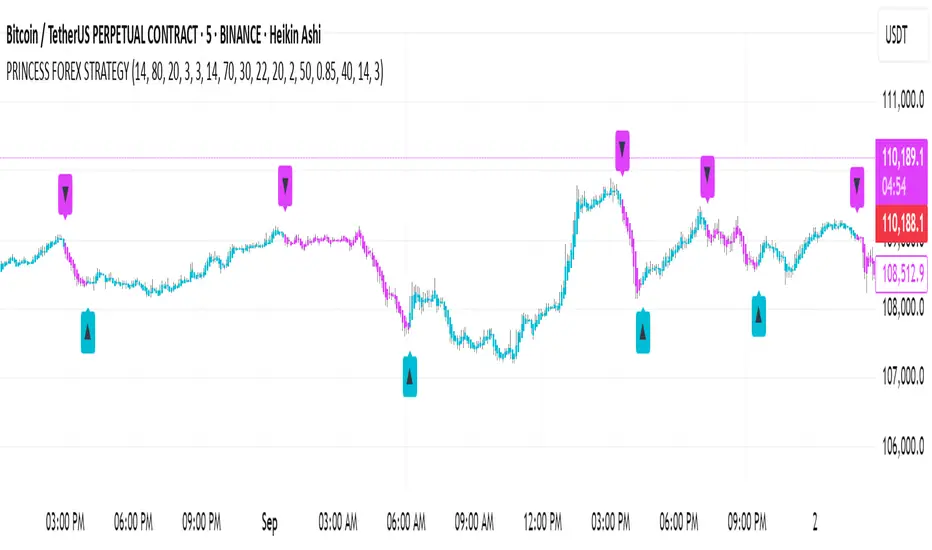
PRINCESS FOREX STRATEGY (BUY + SELL BY USING HEKINASHI CANDEL CHART)
This indicator combines Stochastic, RSI, and a modified Williams VIX Fix filter to generate high-probability BUY and SELL signals, with automatic candle coloring for improved visual clarity.
How It Works
By Using Hekinashi Candel (Chart)
Stochastic Oscillator (Slow)
Measures momentum and overbought/oversold zones.
Adjustable inputs for %K, %D smoothing and thresholds.
Relative Strength Index (RSI)
Confirms strength of price movement.
Helps identify reversal zones around 30 (oversold) and 70 (overbought).
Williams VIX Fix (Volatility Filter)
Detects potential bottoms/tops based on volatility spikes.
Includes Bollinger Band and percentile-based filtering to avoid false signals.
Sequential Signal Logic
Prevents back-to-back conflicting signals.
Position state: 0 = Flat, 1 = After Buy, -1 = After Sell.
Candle Coloring
Aqua candles highlight bullish sequences after a BUY signal.
Fuchsia candles highlight bearish sequences after a SELL signal.
Neutral candles remain uncolored for clean visualization.
When to Use
Works well on Forex, indices, commodities, and cryptocurrency pairs.
Can be applied to any timeframe — from scalping on M5 charts to swing trading on H4 or daily charts.
Best used with price action, support/resistance zones, and volume analysis for confirmation.
How to Interpret Signals
BUY ▲ (Aqua):
Price strength confirmed with bullish momentum.
Volatility filter supports potential upward reversal.
SELL ▼ (Fuchsia):
Price weakness confirmed with bearish momentum.
Volatility filter supports potential downward reversal.
Colored candles continue until an opposite signal is generated.
Key Features
Full input customization (RSI, Stoch, VIX Fix parameters).
No repainting — signals print on confirmed candle closes.
Clean, visual signals with built-in candle highlighting.
Skrypt chroniony
Ten skrypt został opublikowany jako zamknięty kod źródłowy. Możesz jednak używać go swobodnie i bez żadnych ograniczeń – więcej informacji tutaj.
Wyłączenie odpowiedzialności
Informacje i publikacje przygotowane przez TradingView lub jego użytkowników, prezentowane na tej stronie, nie stanowią rekomendacji ani porad handlowych, inwestycyjnych i finansowych i nie powinny być w ten sposób traktowane ani wykorzystywane. Więcej informacji na ten temat znajdziesz w naszym Regulaminie.