TMFlow‴ | Trend Momentum Flow‴
4
What does it do?
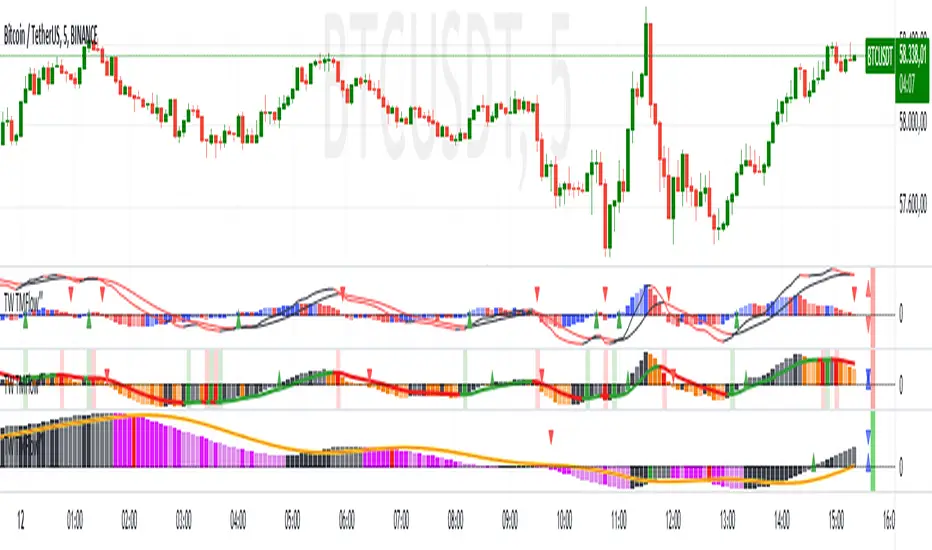
Converts MACD indicator into a powerfull long and short term trend momentum indicator. This is a 3in1 indicator, you have a (1) MACD or a (2) Long or (3) Short Termo Trend TMFlow indicator.
The chart presents a top TMFlow, this is the Long Term Trend TMFlow. The chart presents a bottom TMFlow, this is the Short Term Trend TMFlow, which provides you with pullback or long term trend reversal.
How does it work?
You can choose to use the TMFlow as a long term indicator that provides you with a long trend monitoring. If you choose to use the TMFlow as a short term momentum indicador, it will provide you with movement advance followed with a pullback movement, but this pullback could end up being a trend reversal in case it crosses the zero line which, in this case, will revert also the long term momentum trend (Long Term TMFlow mentioned above).
What's my filling?
definitively this is an indicator that MUST BE part of any trading system.
Indicator features:
- original MACD indicator;
- Long Term Trend TMFlow top/bottom wave reversal after a movement advance suggests long term trend reversal (signaled by bar color change);
- Short Term Trend TMFlow top/bottom wave reversal after a movement advance suggests pullback (signaled by bar color change) that could end up being a trend reversal in case it crosses under/above the zero line;
- TMFlow Moving Average Line that suggests 1st buy/sell sign once crossed by bar uptrend/downtrend, which is signaled by a blue/red bar;
- light green and red background bar provides with the histogram bar crossing above/under the TMFlow Moving Average Line, respectively;
- bar gradiant color to indicate acceleration or slowdown bars development;
To have access to this indicator, please DM me.
Don't contact me in the comment area.
- divergence line in the MACD indicator;
- divergence line in the Short Term Trend TMFlow indicator.
Now it has a more intuitive interface.
1. the menu was reorganized with Titles
2. new Trend Line within the TMFlow Long period histogram
3. new histogram colors (Green and Red) within the TMFlow Long period histogram, therefore when the histogram crosses above the new Trend Line the indicator will plot a Green histogram, and when the histogram crosses under the new Trend Line the indicator will plot a Red histogram.
1. script converted to PINE-5
2. indicator setup adjustment
3. menu simplified
Skrypt tylko na zaproszenie
Dostęp do tego skryptu mają wyłącznie użytkownicy zatwierdzeni przez autora. Aby z niego korzystać, należy poprosić o zgodę i ją uzyskać. Zgoda jest zazwyczaj udzielana po dokonaniu płatności. Więcej informacji można znaleźć w instrukcjach autora poniżej lub kontaktując się bezpośrednio z MarceloTorres.
TradingView NIE zaleca płacenia za skrypt ani korzystania z niego, jeśli nie ma pełnego zaufania do jego autora i nie rozumie się zasad jego działania. Można również znaleźć darmowe, otwartoźródłowe alternatywy w skryptach społeczności.
Instrukcje autora
marcelo@tradewiser.pro
Vídeo-Análise completa diária no YouTube:
youtube.com/c/TradeWiserPro
Curso/AE
CursoAE.TradeWiser.pro
@TradeWiserPro
Telegram, Twitter, Facebook, LinkedIn, Instagram
Wyłączenie odpowiedzialności
Skrypt tylko na zaproszenie
Dostęp do tego skryptu mają wyłącznie użytkownicy zatwierdzeni przez autora. Aby z niego korzystać, należy poprosić o zgodę i ją uzyskać. Zgoda jest zazwyczaj udzielana po dokonaniu płatności. Więcej informacji można znaleźć w instrukcjach autora poniżej lub kontaktując się bezpośrednio z MarceloTorres.
TradingView NIE zaleca płacenia za skrypt ani korzystania z niego, jeśli nie ma pełnego zaufania do jego autora i nie rozumie się zasad jego działania. Można również znaleźć darmowe, otwartoźródłowe alternatywy w skryptach społeczności.
Instrukcje autora
marcelo@tradewiser.pro
Vídeo-Análise completa diária no YouTube:
youtube.com/c/TradeWiserPro
Curso/AE
CursoAE.TradeWiser.pro
@TradeWiserPro
Telegram, Twitter, Facebook, LinkedIn, Instagram