The Multi Touch Confluence Indicator Subplot
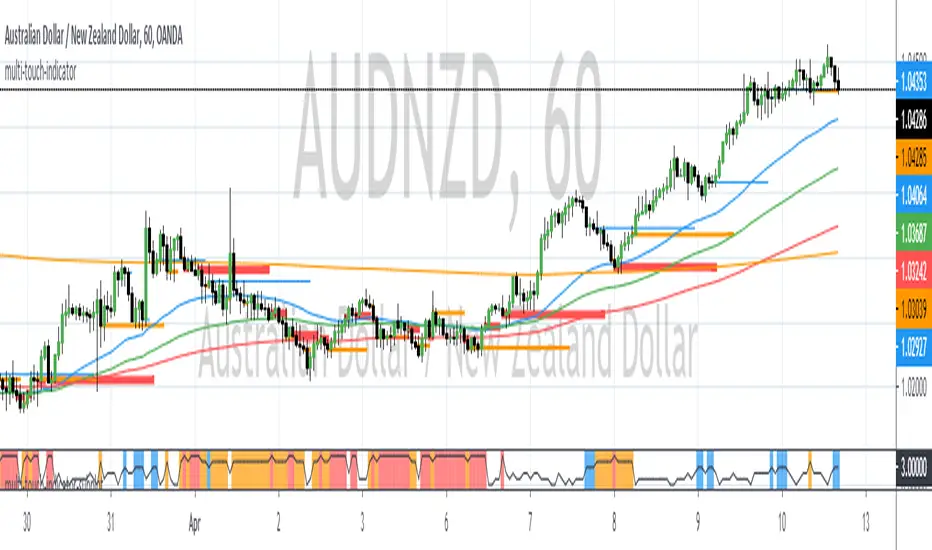
The confluence zone is specified as a point difference.
When confluence is found, the indicator will paint vertical lines of different color and width.
- Blue Zones indicate a confluence of 3 EMAs across all time frames
- Orange Zones indicate a confluence of 4 EMAs across all time frames
- Red Zones indicate a confluence of 5 or more EMAs across all time frames.
The maximum number of time frames being used is 6.
The maximum number of EMAs per time frame is 4.
When confluence occurs it usually indicates a precursor of price expansion. This indicator can be used to determine when momentum is about to come back into the market.
Skrypt tylko na zaproszenie
Dostęp do tego skryptu mają wyłącznie użytkownicy zatwierdzeni przez autora. Aby z niego korzystać, należy poprosić o zgodę i ją uzyskać. Zgoda jest zazwyczaj udzielana po dokonaniu płatności. Więcej informacji można znaleźć w instrukcjach autora poniżej lub kontaktując się bezpośrednio z LiquidityTracker.
TradingView NIE zaleca płacenia za skrypt ani korzystania z niego, jeśli nie ma pełnego zaufania do jego autora i nie rozumie się zasad jego działania. Można również znaleźć darmowe, otwartoźródłowe alternatywy w skryptach społeczności.
Instrukcje autora
Wyłączenie odpowiedzialności
Skrypt tylko na zaproszenie
Dostęp do tego skryptu mają wyłącznie użytkownicy zatwierdzeni przez autora. Aby z niego korzystać, należy poprosić o zgodę i ją uzyskać. Zgoda jest zazwyczaj udzielana po dokonaniu płatności. Więcej informacji można znaleźć w instrukcjach autora poniżej lub kontaktując się bezpośrednio z LiquidityTracker.
TradingView NIE zaleca płacenia za skrypt ani korzystania z niego, jeśli nie ma pełnego zaufania do jego autora i nie rozumie się zasad jego działania. Można również znaleźć darmowe, otwartoźródłowe alternatywy w skryptach społeczności.