PROTECTED SOURCE SCRIPT
Exponential Smoothed RSI

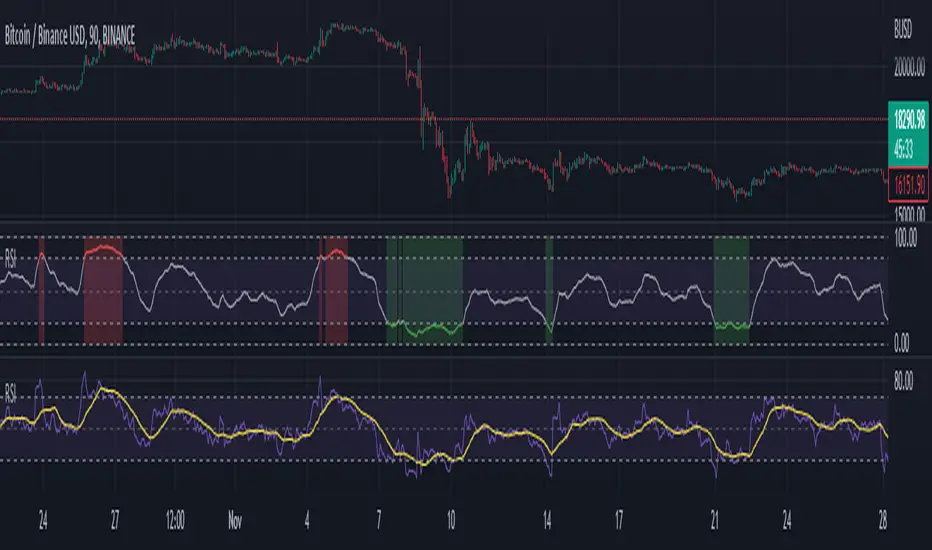
I wanted to create a custom RSI to get clearer signals, so I coded this. It is an RSI average (to prevent the classic RSI in and out oversold/overbought zones) that is approaching the 0 and 100 levels with an exponential math formula.
If the "RSI smoothing factor" input increases, the rsi gets easily closer to the 0 and 100 limits.
This RSI will never be lower than 0 or higher than 100, its smoothing is asymptotic to the limits levels
I also added the possibility to change timeframe if you need
Note: the image is a simple confrontation between built-in RSI and exponentially smoothed RSI
Skrypt chroniony
Ten skrypt został opublikowany jako zamknięty kod źródłowy. Można z tego korzystać swobodnie i bez żadnych ograniczeń — więcej informacji znajduje się tutaj.
Wyłączenie odpowiedzialności
Informacje i publikacje nie stanowią i nie powinny być traktowane jako porady finansowe, inwestycyjne, tradingowe ani jakiekolwiek inne rekomendacje dostarczane lub zatwierdzone przez TradingView. Więcej informacji znajduje się w Warunkach użytkowania.