PROTECTED SOURCE SCRIPT
Zaktualizowano Session Highs and Lows - TW

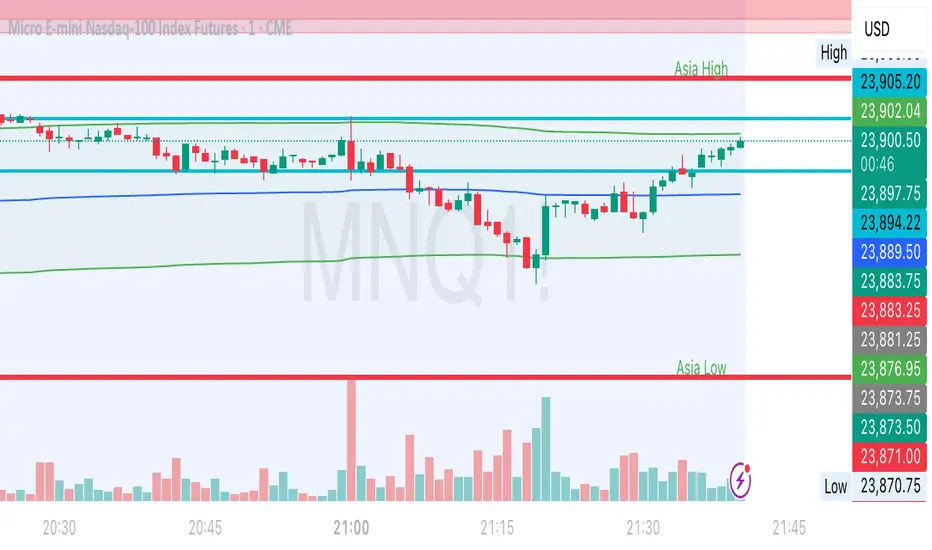
This indicator plots the following:
- Previous day's high and low (based on previous daily candle) - purple
- Asia high and low (1800-0200) - red
- London high and low (0300-0930) - blue
Once a high or low is hit or passed during the NY session, the line reduces in thickness to show that this point of interest has been taken. The thinner lines remain on the chart as a reference so it's easy to discern POIs that are still in play vs. those that have been taken.
Informacje o Wersji
This indicator plots the following:- Previous day's high and low (based on previous daily candle) - purple
- Asia high and low (1800-0200) - red
- London high and low (0300-0930) - blue
Once a high or low is hit or passed during the NY session, the line reduces in thickness to show that this point of interest has been taken. The thinner lines remain on the chart as a reference so it's easy to discern POIs that are still in play vs. those that have been taken.
Informacje o Wersji
Updated to fix some bugs and change the label color to be visible on dark or light backgrounds.Skrypt chroniony
Ten skrypt został opublikowany jako zamknięty kod źródłowy. Można z tego korzystać swobodnie i bez żadnych ograniczeń — więcej informacji znajduje się tutaj.
Wyłączenie odpowiedzialności
Informacje i publikacje nie stanowią i nie powinny być traktowane jako porady finansowe, inwestycyjne, tradingowe ani jakiekolwiek inne rekomendacje dostarczane lub zatwierdzone przez TradingView. Więcej informacji znajduje się w Warunkach użytkowania.
Skrypt chroniony
Ten skrypt został opublikowany jako zamknięty kod źródłowy. Można z tego korzystać swobodnie i bez żadnych ograniczeń — więcej informacji znajduje się tutaj.
Wyłączenie odpowiedzialności
Informacje i publikacje nie stanowią i nie powinny być traktowane jako porady finansowe, inwestycyjne, tradingowe ani jakiekolwiek inne rekomendacje dostarczane lub zatwierdzone przez TradingView. Więcej informacji znajduje się w Warunkach użytkowania.