PROTECTED SOURCE SCRIPT
Consecutive Close Scanner
Overview
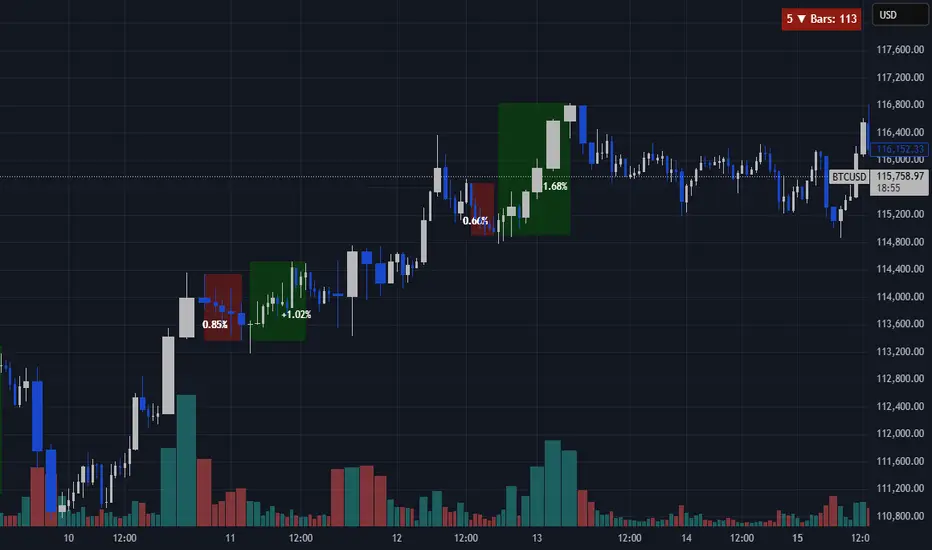
Continuous Close Scanner (CCS) highlights and quantifies runs of consecutive bullish or bearish closes. The indicator draws boxes around qualifying runs (configurable minimum consecutive closes), optionally displays the percent move for each run, counts run starts inside a configurable lookback window, and can show the immediate reverse move until two confirming bars on the opposite side.
Key features
• Detects runs of N consecutive closes (input Consecutive bars).
• Shades active runs with colored boxes and optionally prints percent move.
• Counts how many qualifying runs started within the lookback window (table).
• Optional reverse-move tracker: shows live and final reverse move after a run ends (stops when two confirming opposite closes occur).
• Configurable colors, transparency, table position, and lookback.
• Built in safeguards for TradingView limits (box/label caps configured).
How it works (brief)
When the number of consecutive bullish (close>open) or bearish (close<open) bars reaches the minRun threshold, a box is created covering that run’s high/low. The script computes the run’s percentage move (low→high for bullish, high→low for bearish) and places a label in the visually emptiest spot inside the box. The lookback window controls the counting and culling of historical labels to avoid platform overload.
Inputs
Direction: Bullish / Bearish / Both
Consecutive bars (minRun) — integer ≥3
Lookback bars — window for counting and visuals (respect platform limits)
Colors & transparency for bullish / bearish boxes
Show: Info table, Percentages on chart, Reverse move tracking, Table position
Important notes & limitations
• Uses boxes and labels; TradingView has element limits (max 500). If you use large lookbacks or many markets, you may hit limits — lower lookback or disable persistent labels.
• On TradingView Free plans keep lookback ≤ 4999 to reduce risk of platform; paid accounts can use all the way to 9999 bars lookback.
• Percent calculations are price-based from run extremes; small/near-zero prices can produce large percentages — interpret accordingly.
• Designed as a visual/analytical tool — not a signal generator.
Disclaimer
This script is provided for educational/analytical use only. It is not financial advice. Use at your own risk.
Skrypt chroniony
Ten skrypt został opublikowany jako zamknięty kod źródłowy. Można z tego korzystać swobodnie i bez żadnych ograniczeń — więcej informacji znajduje się tutaj.
Wyłączenie odpowiedzialności
Informacje i publikacje nie stanowią i nie powinny być traktowane jako porady finansowe, inwestycyjne, tradingowe ani jakiekolwiek inne rekomendacje dostarczane lub zatwierdzone przez TradingView. Więcej informacji znajduje się w Warunkach użytkowania.