PROTECTED SOURCE SCRIPT
Zaktualizowano CVDD + Terminal Price Indicator + Z-SCORE
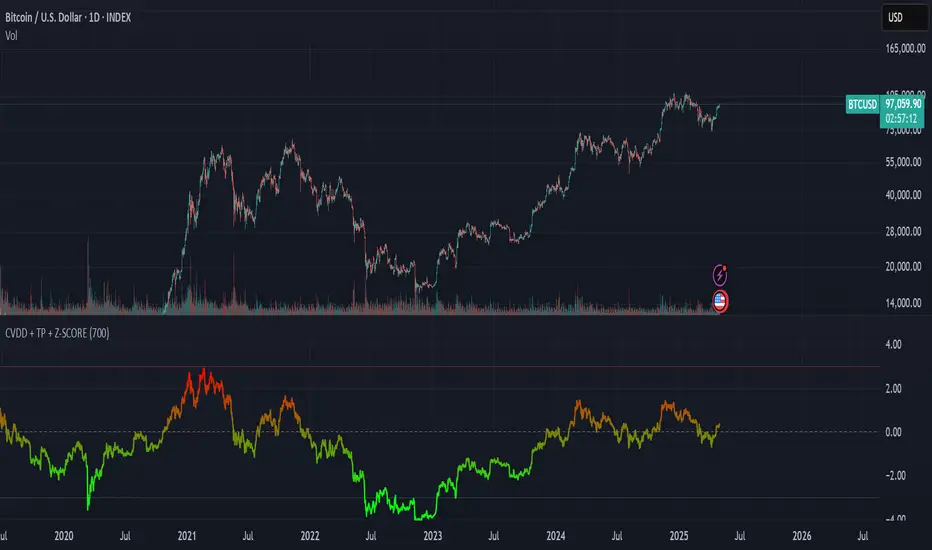
This custom indicator is designed to help identify major overvaluation and undervaluation zones in Bitcoin's market cycles by analyzing price behavior relative to long-term on-chain benchmarks.
It leverages two well-known valuation models — CVDD (Cumulative Value Days Destroyed) and Terminal Price — to define a dynamic valuation range that adapts over time. These reference points are combined with a custom Z-score framework to evaluate how extended price is compared to long-term value zones.
The result is a normalized oscillator that highlights extremes in market sentiment, ranging from –3 (potential deep value) to +3 (potential overheated conditions), with a gradient color scale for quick visual interpretation.
This tool is especially useful for long-term investors and macro analysts seeking signals of potential market tops and bottoms based on deep on-chain behavior — rather than short-term technicals.
Informacje o Wersji
This custom indicator is designed to help identify major overvaluation and undervaluation zones in Bitcoin's market cycles by analyzing price behavior relative to long-term on-chain benchmarks.It leverages two well-known valuation models — CVDD (Cumulative Value Days Destroyed) and Terminal Price — to define a dynamic valuation range that adapts over time. These reference points are combined with a custom Z-score framework to evaluate how extended price is compared to long-term value zones.
The result is a normalized oscillator that highlights extremes in market sentiment, ranging from –3 (potential deep value) to +3 (potential overheated conditions), with a gradient color scale for quick visual interpretation.
This tool is especially useful for long-term investors and macro analysts seeking signals of potential market tops and bottoms based on deep on-chain behavior — rather than short-term technicals.
Skrypt chroniony
Ten skrypt został opublikowany jako zamknięty kod źródłowy. Można z tego korzystać swobodnie i bez żadnych ograniczeń — więcej informacji znajduje się tutaj.
Wyłączenie odpowiedzialności
Informacje i publikacje nie stanowią i nie powinny być traktowane jako porady finansowe, inwestycyjne, tradingowe ani jakiekolwiek inne rekomendacje dostarczane lub zatwierdzone przez TradingView. Więcej informacji znajduje się w Warunkach użytkowania.