PROTECTED SOURCE SCRIPT
Zaktualizowano MTF RSI Channel Smoothed (Linear Regression)
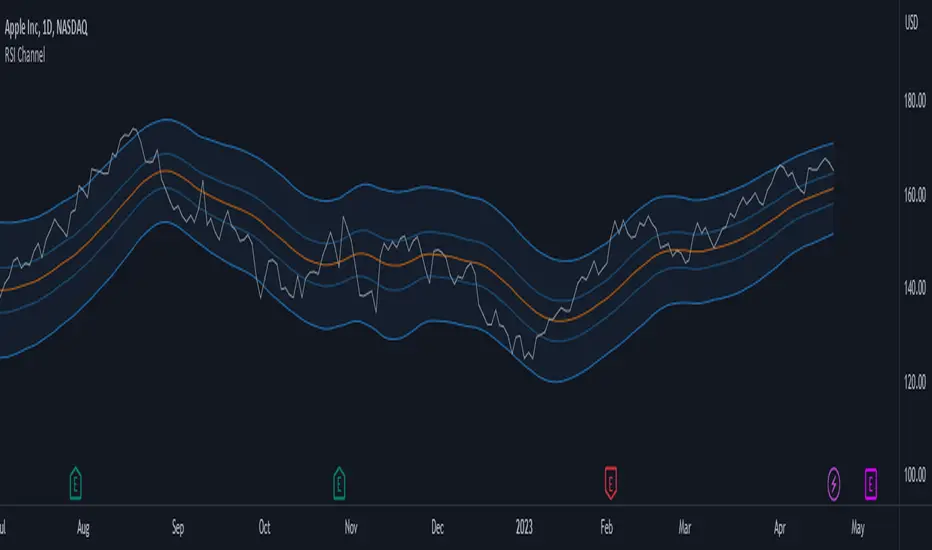
The "MTF RSI Channel Smoothed (Linear Regression)" indicator is a momentum oscillator that displays smoothed RSI bands across multiple timeframes.
What sets this indicator apart is that it uses linear regression to smooth the RSI bands. Linear regression is a statistical technique that helps filter out the noise in the data, resulting in smoother and more precise RSI bands. This provides traders with a more advanced and reliable tool for monitoring the RSI bands across multiple timeframes.
One of the primary advantages of using linear regression to smooth the RSI bands is that it provides a more accurate and reliable way to identify overbought and oversold levels of the asset. The linear regression method smooths out the data by reducing the impact of temporary price fluctuations, allowing traders to see the underlying trend more clearly. This helps traders to make more informed trading decisions by identifying key levels of support and resistance, and spotting potential entry and exit points.
Another advantage of the "Multi-Timeframe Smoothed RSI Bands" indicator is that it allows traders to adjust the length of the smoothing period using the "Smooth Period" parameter. This flexibility gives traders the ability to fine-tune the indicator to their specific trading style and preferences, resulting in a more personalized and effective trading tool.
Overall, the "Multi-Timeframe Smoothed RSI Bands" indicator is a powerful tool for traders looking to monitor the RSI bands across multiple timeframes. By using linear regression to smooth the data, this indicator provides traders with a more accurate and reliable way to identify potential trading opportunities, and make more informed trading decisions.
Informacje o Wersji
minor changesSkrypt chroniony
Ten skrypt został opublikowany jako zamknięty kod źródłowy. Można z tego korzystać swobodnie i bez żadnych ograniczeń — więcej informacji znajduje się tutaj.
Plan the trade ⚡ Trade the plan
Wyłączenie odpowiedzialności
Informacje i publikacje nie stanowią i nie powinny być traktowane jako porady finansowe, inwestycyjne, tradingowe ani jakiekolwiek inne rekomendacje dostarczane lub zatwierdzone przez TradingView. Więcej informacji znajduje się w Warunkach użytkowania.
Skrypt chroniony
Ten skrypt został opublikowany jako zamknięty kod źródłowy. Można z tego korzystać swobodnie i bez żadnych ograniczeń — więcej informacji znajduje się tutaj.
Plan the trade ⚡ Trade the plan
Wyłączenie odpowiedzialności
Informacje i publikacje nie stanowią i nie powinny być traktowane jako porady finansowe, inwestycyjne, tradingowe ani jakiekolwiek inne rekomendacje dostarczane lub zatwierdzone przez TradingView. Więcej informacji znajduje się w Warunkach użytkowania.