PROTECTED SOURCE SCRIPT
Zaktualizowano Red-E Market Structure
Red-E Market Structure
📊 Overview
Red-E Market Structure is a comprehensive technical analysis tool that combines automated pivot detection, market structure analysis, volume delta tracking, and intelligent buy/sell signals into one powerful indicator. This script was created with the community in mind - we don't believe in gatekeeping tools that help traders succeed together.
🎯 What This Indicator Does
1. Intelligent Candle Coloring System
Royal Blue Candles: Strong bullish signals with high conviction
Baby Blue Candles: Moderate bullish signals for cautious entries
White Candles: Neutral market conditions
Orange Candles: Moderate bearish signals indicating potential weakness
Red Candles: Strong bearish signals with high conviction
2. Automated Pivot Point Detection
Automatically identifies and marks significant pivot highs and lows on your chart, helping you recognize key reversal zones and support/resistance levels without manual drawing.
3. Market Structure Analysis
Tracks and labels critical market structure patterns:
Higher Highs (HH): Bullish trend continuation
Higher Lows (HL): Bullish trend confirmation
Lower Highs (LH): Bearish trend formation
Lower Lows (LL): Bearish trend continuation
4. Automated Trendline Drawing
Connects pivot points with color-coded dashed trendlines (green for bullish, red for bearish), helping visualize trend direction and potential breakout zones.
5. Dynamic Buy/Sell Signals
Generates clear entry signals based on multiple factors including RSI, price vs moving average, and momentum analysis:
"STRONG BUY" labels for high-conviction long entries
"BUY" labels for moderate bullish opportunities
"SELL" labels for moderate bearish signals
"STRONG SELL" labels for high-conviction short entries
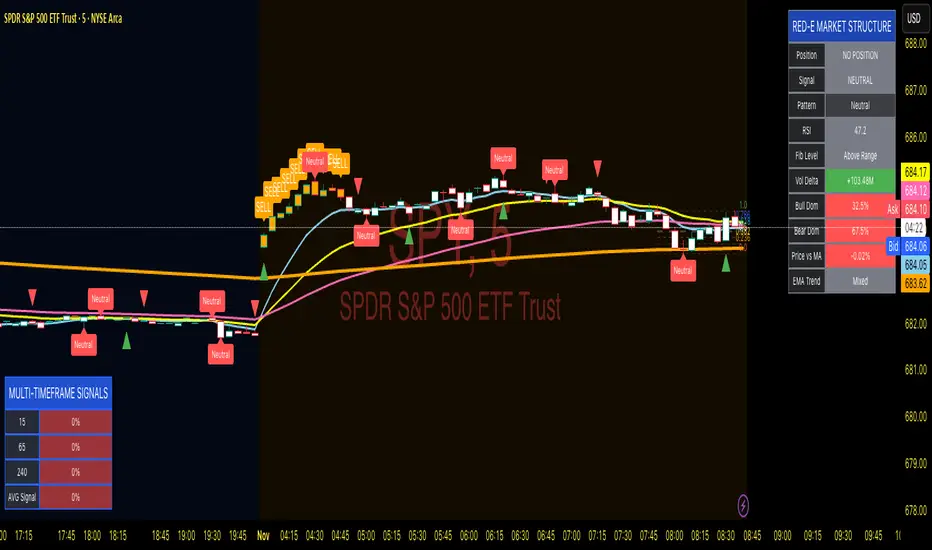
6. Real-Time Dashboard
A comprehensive dashboard displays:
Current signal status (Buy/Sell/Neutral)
Active market structure pattern
RSI value with color-coded zones
Volume Delta (cumulative buying vs selling pressure)
Bullish Dominance percentage
Bearish Dominance percentage
Price position relative to moving average
🔧 How to Use
Installation
Copy the Pine Script code
Open TradingView and navigate to the Pine Editor
Paste the code and click "Add to Chart"
Basic Setup
For Swing Trading:
Pivot Length: 7-10
RSI Length: 14
MA Length: 50
For Day Trading:
Pivot Length: 3-5
RSI Length: 14
MA Length: 20
For Scalping:
Pivot Length: 2-3
RSI Length: 7
MA Length: 9
Reading the Signals
Entry Signals:
Look for STRONG BUY labels combined with royal blue candles and Higher Lows for long entries
Look for STRONG SELL labels combined with red candles and Lower Highs for short entries
Confirm entries when volume dominance aligns with your direction (>55%)
Trend Confirmation:
Use the market structure labels to confirm trend direction
Higher Highs + Higher Lows = Uptrend intact
Lower Highs + Lower Lows = Downtrend intact
Exit Signals:
Exit longs when you see Lower Highs forming or orange/red candles appearing
Exit shorts when you see Higher Lows forming or blue candles appearing
Watch for trendline breaks as potential reversal signals
Volume Analysis:
Volume Delta above zero = Net buying pressure
Volume Delta below zero = Net selling pressure
Bullish Dominance >55% = Strong buying interest
Bearish Dominance >55% = Strong selling pressure
Dashboard Interpretation
RSI >70: Overbought - watch for reversals
RSI <30: Oversold - potential bounce zone
Price vs MA: Shows strength relative to trend (positive = above MA, negative = below MA)
💡 Why This Indicator Is Original
Red-E Market Structure is unique because it synthesizes multiple advanced concepts into a single, cohesive system:
Multi-Factor Signal Generation: Unlike single-indicator systems, this combines RSI, moving averages, volume analysis, and market structure into weighted signals
Adaptive Candle Coloring: The five-tier color system provides instant visual feedback on market conditions
Integrated Volume Delta: Real-time cumulative volume tracking shows institutional pressure
Automated Market Structure: Removes subjectivity by automatically identifying and labeling swing points
Comprehensive Dashboard: All critical metrics in one place for faster decision-making
🤝 Our Philosophy
We believe in empowering the trading community, not gatekeeping valuable tools. This indicator is shared freely because we all win when we share knowledge. Trading is challenging enough without artificial barriers to information and tools.
If this indicator helps your trading, pay it forward by helping other traders in your community. Success is more meaningful when it's shared.
⚙️ Customization Options
All settings are adjustable in the indicator settings panel:
Pivot Length: Sensitivity of pivot detection
RSI Parameters: Overbought/oversold levels
MA Length: Trend reference period
Dashboard Position: Top/Bottom, Left/Right placement
Toggle Features: Show/hide pivots, trendlines, or dashboard
⚠️ Disclaimer
This indicator is a technical analysis tool designed to assist in market analysis. It is not financial advice and should not be used as the sole basis for trading decisions. Always:
Use proper risk management
Combine with your own analysis
Practice on a demo account first
Never risk more than you can afford to lose
Consider multiple timeframes and confirmations
📈 Best Practices
Use Multiple Timeframes: Confirm signals on higher timeframes
Wait for Confirmation: Don't chase - wait for the signal and candle color to align
Respect Risk Management: Use stop losses below pivot lows (long) or above pivot highs (short)
Context Matters: Consider overall market conditions and major support/resistance zones
Volume Confirms: Stronger signals when volume dominance aligns with direction
🔄 Updates and Support
This script is provided as-is for the trading community. Feel free to modify and adapt it to your trading style. Share improvements with the community to help everyone succeed!
Remember: No indicator is perfect. This tool is designed to give you an edge, but successful trading requires discipline, risk management, and continuous learning. Trade responsibly and may your risk be ever in your favor! 📊✨
📊 Overview
Red-E Market Structure is a comprehensive technical analysis tool that combines automated pivot detection, market structure analysis, volume delta tracking, and intelligent buy/sell signals into one powerful indicator. This script was created with the community in mind - we don't believe in gatekeeping tools that help traders succeed together.
🎯 What This Indicator Does
1. Intelligent Candle Coloring System
Royal Blue Candles: Strong bullish signals with high conviction
Baby Blue Candles: Moderate bullish signals for cautious entries
White Candles: Neutral market conditions
Orange Candles: Moderate bearish signals indicating potential weakness
Red Candles: Strong bearish signals with high conviction
2. Automated Pivot Point Detection
Automatically identifies and marks significant pivot highs and lows on your chart, helping you recognize key reversal zones and support/resistance levels without manual drawing.
3. Market Structure Analysis
Tracks and labels critical market structure patterns:
Higher Highs (HH): Bullish trend continuation
Higher Lows (HL): Bullish trend confirmation
Lower Highs (LH): Bearish trend formation
Lower Lows (LL): Bearish trend continuation
4. Automated Trendline Drawing
Connects pivot points with color-coded dashed trendlines (green for bullish, red for bearish), helping visualize trend direction and potential breakout zones.
5. Dynamic Buy/Sell Signals
Generates clear entry signals based on multiple factors including RSI, price vs moving average, and momentum analysis:
"STRONG BUY" labels for high-conviction long entries
"BUY" labels for moderate bullish opportunities
"SELL" labels for moderate bearish signals
"STRONG SELL" labels for high-conviction short entries
6. Real-Time Dashboard
A comprehensive dashboard displays:
Current signal status (Buy/Sell/Neutral)
Active market structure pattern
RSI value with color-coded zones
Volume Delta (cumulative buying vs selling pressure)
Bullish Dominance percentage
Bearish Dominance percentage
Price position relative to moving average
🔧 How to Use
Installation
Copy the Pine Script code
Open TradingView and navigate to the Pine Editor
Paste the code and click "Add to Chart"
Basic Setup
For Swing Trading:
Pivot Length: 7-10
RSI Length: 14
MA Length: 50
For Day Trading:
Pivot Length: 3-5
RSI Length: 14
MA Length: 20
For Scalping:
Pivot Length: 2-3
RSI Length: 7
MA Length: 9
Reading the Signals
Entry Signals:
Look for STRONG BUY labels combined with royal blue candles and Higher Lows for long entries
Look for STRONG SELL labels combined with red candles and Lower Highs for short entries
Confirm entries when volume dominance aligns with your direction (>55%)
Trend Confirmation:
Use the market structure labels to confirm trend direction
Higher Highs + Higher Lows = Uptrend intact
Lower Highs + Lower Lows = Downtrend intact
Exit Signals:
Exit longs when you see Lower Highs forming or orange/red candles appearing
Exit shorts when you see Higher Lows forming or blue candles appearing
Watch for trendline breaks as potential reversal signals
Volume Analysis:
Volume Delta above zero = Net buying pressure
Volume Delta below zero = Net selling pressure
Bullish Dominance >55% = Strong buying interest
Bearish Dominance >55% = Strong selling pressure
Dashboard Interpretation
RSI >70: Overbought - watch for reversals
RSI <30: Oversold - potential bounce zone
Price vs MA: Shows strength relative to trend (positive = above MA, negative = below MA)
💡 Why This Indicator Is Original
Red-E Market Structure is unique because it synthesizes multiple advanced concepts into a single, cohesive system:
Multi-Factor Signal Generation: Unlike single-indicator systems, this combines RSI, moving averages, volume analysis, and market structure into weighted signals
Adaptive Candle Coloring: The five-tier color system provides instant visual feedback on market conditions
Integrated Volume Delta: Real-time cumulative volume tracking shows institutional pressure
Automated Market Structure: Removes subjectivity by automatically identifying and labeling swing points
Comprehensive Dashboard: All critical metrics in one place for faster decision-making
🤝 Our Philosophy
We believe in empowering the trading community, not gatekeeping valuable tools. This indicator is shared freely because we all win when we share knowledge. Trading is challenging enough without artificial barriers to information and tools.
If this indicator helps your trading, pay it forward by helping other traders in your community. Success is more meaningful when it's shared.
⚙️ Customization Options
All settings are adjustable in the indicator settings panel:
Pivot Length: Sensitivity of pivot detection
RSI Parameters: Overbought/oversold levels
MA Length: Trend reference period
Dashboard Position: Top/Bottom, Left/Right placement
Toggle Features: Show/hide pivots, trendlines, or dashboard
⚠️ Disclaimer
This indicator is a technical analysis tool designed to assist in market analysis. It is not financial advice and should not be used as the sole basis for trading decisions. Always:
Use proper risk management
Combine with your own analysis
Practice on a demo account first
Never risk more than you can afford to lose
Consider multiple timeframes and confirmations
📈 Best Practices
Use Multiple Timeframes: Confirm signals on higher timeframes
Wait for Confirmation: Don't chase - wait for the signal and candle color to align
Respect Risk Management: Use stop losses below pivot lows (long) or above pivot highs (short)
Context Matters: Consider overall market conditions and major support/resistance zones
Volume Confirms: Stronger signals when volume dominance aligns with direction
🔄 Updates and Support
This script is provided as-is for the trading community. Feel free to modify and adapt it to your trading style. Share improvements with the community to help everyone succeed!
Remember: No indicator is perfect. This tool is designed to give you an edge, but successful trading requires discipline, risk management, and continuous learning. Trade responsibly and may your risk be ever in your favor! 📊✨
Informacje o Wersji
Here’s a concise version of your TradingView description that keeps all key details but reads tighter and faster:---
# **Red-E Market Structure**
## 📊 **Overview**
An all-in-one trading system for pivots, structure, volume delta, MTF signals, EMAs, Fibonacci, and precision entries with six take-profit levels. Built for the community — no gatekeeping, just results.
## 🎯 **Core Features**
* **Smart Candles:** Royal Blue = Strong Buy, Baby Blue = Buy, White = Neutral, Orange = Sell, Red = Strong Sell
* **Precision Entries:** Buy/Sell triangles, 6 TP levels (1.5 % – 15 %), smart SL (% or ATR), risk : reward display
* **4 Custom EMAs:** Adjustable (9 / 21 / 50 / 200 default), colors, styles, toggles
* **MTF Dashboard:** Three timeframes (15 m / 4 h / D) with %-based bullish strength
* **Automation:** Market structure labels (HH, HL, LH, LL), auto trendlines + Fibs, volume delta dominance
## ⚙️ **Quick Setup**
**Swing:** Pivot 7–10 | MA 50 | 1 h / 4 h / D | TP 1.5 – 15 %
**Day:** Pivot 3–5 | MA 20 | 5 m / 15 m / 1 h | TP 1 – 7 %
**Scalp:** Pivot 2–3 | MA 9 | 1 m / 5 m / 15 m | TP 0.5 – 3 %
## 📈 **How to Trade**
**Entry:** Triangle signal + EMA alignment + MTF ≥ 70 %.
**Exit:** Scale 25 % each at TP 1–3, trail final 25 % to TP 6.
**Confirm:** HH/HL for longs or LH/LL for shorts + volume > 55 %.
## 💡 **Why It’s Different**
One script handles entries, 6 TPs, SL, R:R, auto Fibs, market structure, volume delta, and MTF confirmation — no extras needed.
## ⚙️ **Customization**
Edit everything: pivots, RSI/MA lengths, TPs, SL rules, EMA styles, timeframes, Fibs, and dashboards.
## ⚠️ **Disclaimer**
Not financial advice. Risk 1–2 % per trade. Use demo first and adjust TP/SL for volatility.
Informacje o Wersji
Red-E Market Structure Updated V2📊 Overview
An all-in-one trading system for pivots, structure, volume delta, MTF signals, EMAs, Fibonacci, and precision entries with six take-profit levels. Built for the community — no gatekeeping, just results.
🎯 Core Features
Smart Candles: Royal Blue = Strong Buy, Baby Blue = Buy, White = Neutral, Orange = Sell, Red = Strong Sell
Precision Entries: Buy/Sell triangles, 6 TP levels (1.5 % – 15 %), smart SL (% or ATR), risk : reward display
4 Custom EMAs: Adjustable (9 / 21 / 50 / 200 default), colors, styles, toggles
MTF Dashboard: Three timeframes (15 m / 4 h / D) with %-based bullish strength
Automation: Market structure labels (HH, HL, LH, LL), auto trendlines + Fibs, volume delta dominance
⚙️ Quick Setup
Swing: Pivot 7–10 | MA 50 | 1 h / 4 h / D | TP 1.5 – 15 %
Day: Pivot 3–5 | MA 20 | 5 m / 15 m / 1 h | TP 1 – 7 %
Scalp: Pivot 2–3 | MA 9 | 1 m / 5 m / 15 m | TP 0.5 – 3 %
📈 How to Trade
Entry: Triangle signal + EMA alignment + MTF ≥ 70 %.
Exit: Scale 25 % each at TP 1–3, trail final 25 % to TP 6.
Confirm: HH/HL for longs or LH/LL for shorts + volume > 55 %.
💡 Why It’s Different
One script handles entries, 6 TPs, SL, R:R, auto Fibs, market structure, volume delta, and MTF confirmation — no extras needed.
⚙️ Customization
Edit everything: pivots, RSI/MA lengths, TPs, SL rules, EMA styles, timeframes, Fibs, and dashboards.
⚠️ Disclaimer
Not financial advice. Risk 1–2 % per trade. Use demo first and adjust TP/SL for volatility.
Informacje o Wersji
🔧 Key Fixes:EMAs Now Calculate Dynamically:
Moved the toggle check (showEMA1 ? ... : na) into the EMA calculation itself
This ensures EMAs always calculate as proper series data
They now move smoothly with candles and respond to auto-fit
Fibonacci Levels Recalculate Every Bar:
Removed var declarations that were locking values
Added showFib condition directly into each Fib level calculation
Returns na when toggled off, but calculates fresh when on
Now updates dynamically on every chart interaction
Plot Functions Updated:
EMAs plot directly without conditional wrapping
Fibonacci levels plot with built-in toggle check
All use proper series values that TradingView can scale
✅ This Should Now Work:
✅ Auto-fit button moves EMAs with candles
✅ Zooming in/out updates Fibonacci levels
✅ Changing timeframes recalculates everything
✅ Scrolling through history shows dynamic updates
✅ All visual elements scale with price action
The issue was that some values were being calculated as fixed points rather than series data. Now everything is properly dynamic! 🚀
Skrypt chroniony
Ten skrypt został opublikowany jako zamknięty kod źródłowy. Możesz jednak używać go swobodnie i bez żadnych ograniczeń – więcej informacji tutaj.
MARK N. ROGERS, MBA
Rogers1906.com
Rogers1906.com
Wyłączenie odpowiedzialności
Informacje i publikacje przygotowane przez TradingView lub jego użytkowników, prezentowane na tej stronie, nie stanowią rekomendacji ani porad handlowych, inwestycyjnych i finansowych i nie powinny być w ten sposób traktowane ani wykorzystywane. Więcej informacji na ten temat znajdziesz w naszym Regulaminie.