PROTECTED SOURCE SCRIPT
Zaktualizowano Daily Engulfing Pattern Detector
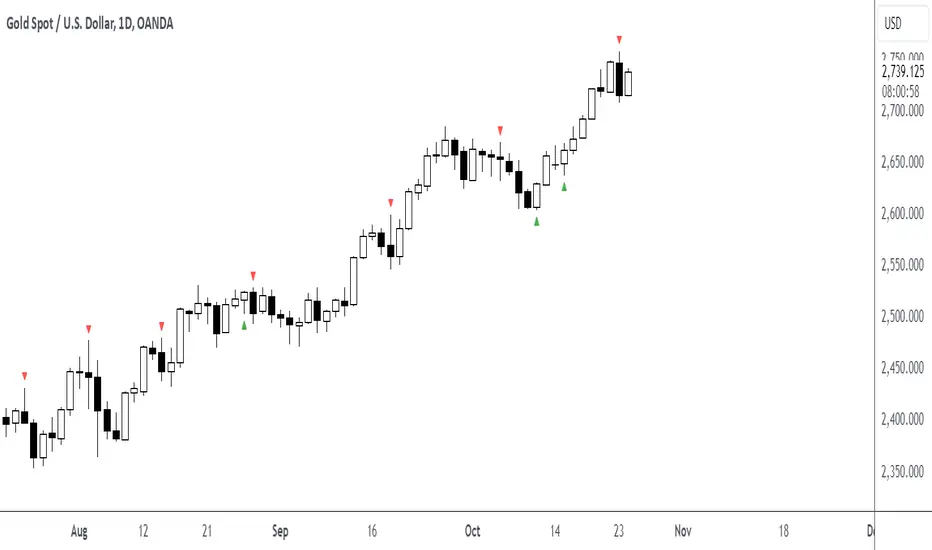
This indicator identifies bullish and bearish engulfing patterns on daily timeframes.
A bullish engulfing pattern occurs when a green candle completely engulfs the previous red candle,
taking out its low and closing above both its open and close prices. This suggests a potential trend reversal from bearish to bullish.
A bearish engulfing pattern occurs when a red candle completely engulfs the previous green candle,
taking out its high and closing below both its open and close prices. This suggests a potential trend reversal from bullish to bearish.
Features:
- Works on daily timeframe by default (customizable)
- Displays visual markers: green triangles for bullish patterns, red triangles for bearish patterns
- Includes built-in alerts for both pattern types
Set up alerts by right-clicking the indicator and selecting "Create Alert"
Informacje o Wersji
This indicator identifies bullish and bearish engulfing patterns on daily timeframes.A bullish engulfing pattern occurs when a green candle completely engulfs the previous red candle,
taking out its low and closing above both its open and close prices. This suggests a potential trend reversal from bearish to bullish.
A bearish engulfing pattern occurs when a red candle completely engulfs the previous green candle,
taking out its high and closing below both its open and close prices. This suggests a potential trend reversal from bullish to bearish.
Features:
- Works on daily timeframe by default (customizable)
- Displays visual markers: green triangles for bullish patterns, red triangles for bearish patterns
- Includes built-in alerts for both pattern types
Set up alerts by right-clicking the indicator and selecting "Create Alert"
Skrypt chroniony
Ten skrypt został opublikowany jako zamknięty kod źródłowy. Można z tego korzystać swobodnie i bez żadnych ograniczeń — więcej informacji znajduje się tutaj.
Wyłączenie odpowiedzialności
Informacje i publikacje nie stanowią i nie powinny być traktowane jako porady finansowe, inwestycyjne, tradingowe ani jakiekolwiek inne rekomendacje dostarczane lub zatwierdzone przez TradingView. Więcej informacji znajduje się w Warunkach użytkowania.