PROTECTED SOURCE SCRIPT
Money Flow Profile
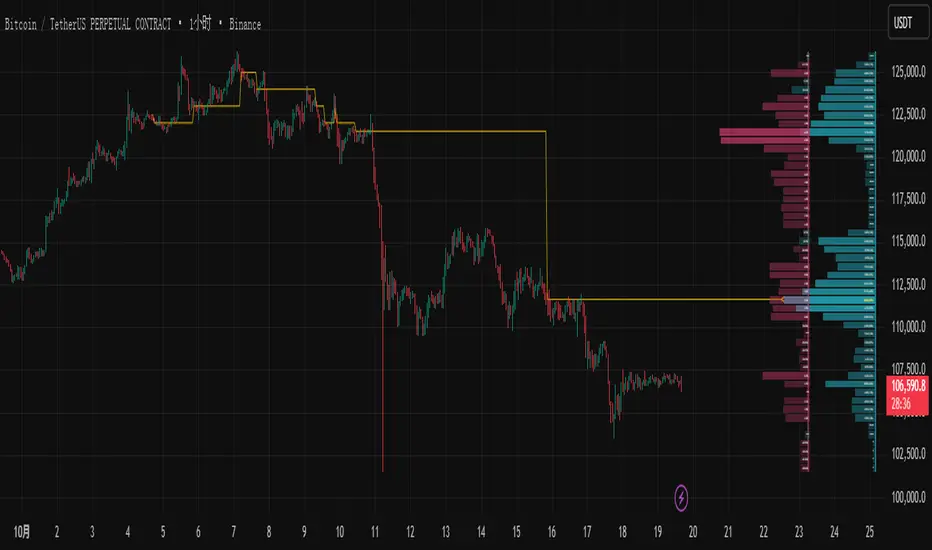
**Delta Profile** displays the difference in buying and selling pressure at specific price levels:
1. **Blue Zones**: Indicates price ranges with strong buying power. Displayed when buying power exceeds selling power.
2. **Red Zones**: Indicates price ranges with strong selling power. Displayed when selling power exceeds buying power.
3. **Calculation Method**: Determines the relative buying and selling power of each price range based on your selected "Polarity Method" (Kanabi Polarity or Kanabi Buy/Sell Pressure).
This histogram helps you identify price levels with strong buying or selling pressure, thereby assessing market sentiment and potential turning points.
## Money Flow Profile
The histogram on the right displays the **Money Flow Profile**, which represents the total money flow at a specific price level:
1. **Normalized Display**: The length of each price level is expressed as a percentage of the highest volume level for easier comparison.
2. **Color Gradient**: Uses different shades of color based on trading volume, with higher volume indicating darker colors.
3. **Number Display**: If enabled, displays the specific Money Flow value and percentage.
This histogram helps you identify price levels with the most trading activity; these levels often serve as important support or resistance levels.
## Combining the Two
- When strong buying (blue) is displayed on the left and high volume is displayed on the right, it indicates strong buying support at that price level.
- When strong selling (red) is displayed on the left and high volume is displayed on the right, it indicates strong selling pressure at that price level.
- Combining high volume points (on the right) with shifts in buying and selling power (color change on the left) helps identify potential price turning points.
This combined analysis method allows you to simultaneously understand market activity and the balance of buying and selling power, providing a more comprehensive basis for trading decisions.
Skrypt chroniony
Ten skrypt został opublikowany jako zamknięty kod źródłowy. Możesz jednak używać go swobodnie i bez żadnych ograniczeń – więcej informacji tutaj.
Wyłączenie odpowiedzialności
Informacje i publikacje przygotowane przez TradingView lub jego użytkowników, prezentowane na tej stronie, nie stanowią rekomendacji ani porad handlowych, inwestycyjnych i finansowych i nie powinny być w ten sposób traktowane ani wykorzystywane. Więcej informacji na ten temat znajdziesz w naszym Regulaminie.