PROTECTED SOURCE SCRIPT
Steel Step Assistant: Trend Visualizer + Divergence Signal 1.0

Disclaimer: Nobody should use this indicator as a confirmation signal for entry/exit for your trades. Please message me on how to use this indicator correctly. This indicator was designed to be used in conjunction with my Steel Step strategy, hence the name.
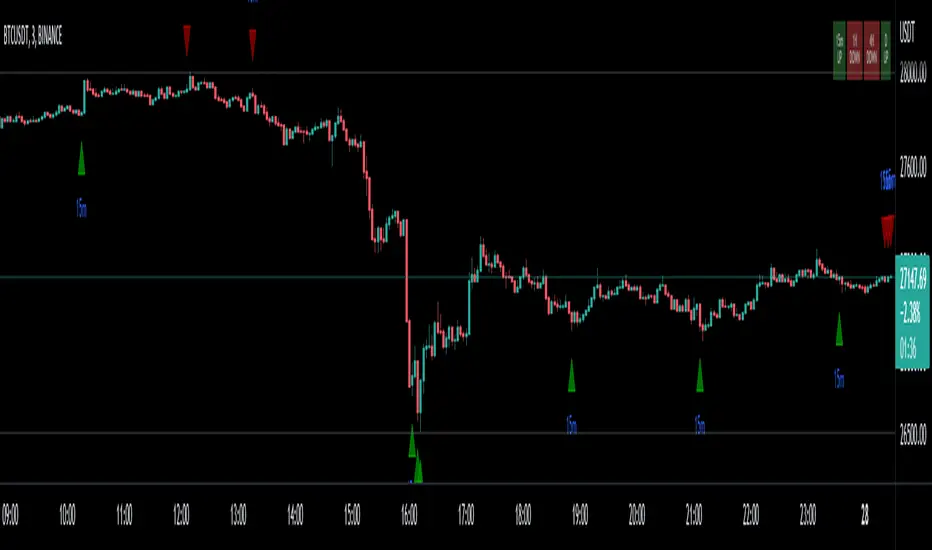
This indicator simply gives you a signal of trend reversals.
The trend visualizer is an ordinary table that shows you the trends of different time frames.
The signal is designed with the Steel Step strategy for determining the more important reversals/pivots.
Being an indicator, it is prone to a certain extent of inaccuracy. It is programmed to provide an accurate market trend reversal to the best of its abilities.
Always remember that the Steel Step strategy does not rely on indicators to trade.
This indicator can be used on all charts and markets; crypto, commodities, forex, stock, indices, etc.
It is suitable for intra-day traders. Another version with all time frames is being made as I publish this.
One way of using this is to enhance your information gathering on trends in order to understand the market structure or direction better.
This indicator helps educate users on the market structure. Users can quickly break down the market into layers, analyze the layers and connect them all to understand the market as a whole. After users understand the market, users need to decide and choose a specific trend they want to trade. The basic idea is to flow with the market.
This indicator can be combined with EW theory to understand the market structure easily.
When I understand the whole market structure, it boosts my trading performance to the maximum.
The user inputs (settings) should be very straightforward. The default settings produce directions that are very similar to what I use for my strategy. You can change the settings as desired.
The default settings are configured to show you the trend reversal or market direction of "one layer" above "the current time frame layer". You can find educational materials about the layer logic from my Steel Step strategy.
Find the instructions on how to view signals below.
***SIGNAL GUIDE***
To view signals/set signal alerts:
- To view 15min signals, use 3min chart
- To view 1H signals, use 15min chart
A second version to include more time frames and trends will be published soon. Look forward to it!
Please comment below or message me if you have any questions. Enjoy!
Skrypt chroniony
Ten skrypt został opublikowany jako zamknięty kod źródłowy. Można z tego korzystać swobodnie i bez żadnych ograniczeń — więcej informacji znajduje się tutaj.
Learn Steep Step, make money every single day.
Trade together: discord.gg/9VPWxxVBCX
Buy Me a Coffee: ko-fi.com/empower
Trade together: discord.gg/9VPWxxVBCX
Buy Me a Coffee: ko-fi.com/empower
Wyłączenie odpowiedzialności
Informacje i publikacje nie stanowią i nie powinny być traktowane jako porady finansowe, inwestycyjne, tradingowe ani jakiekolwiek inne rekomendacje dostarczane lub zatwierdzone przez TradingView. Więcej informacji znajduje się w Warunkach użytkowania.