PROTECTED SOURCE SCRIPT
Buy Sell signals for indicators
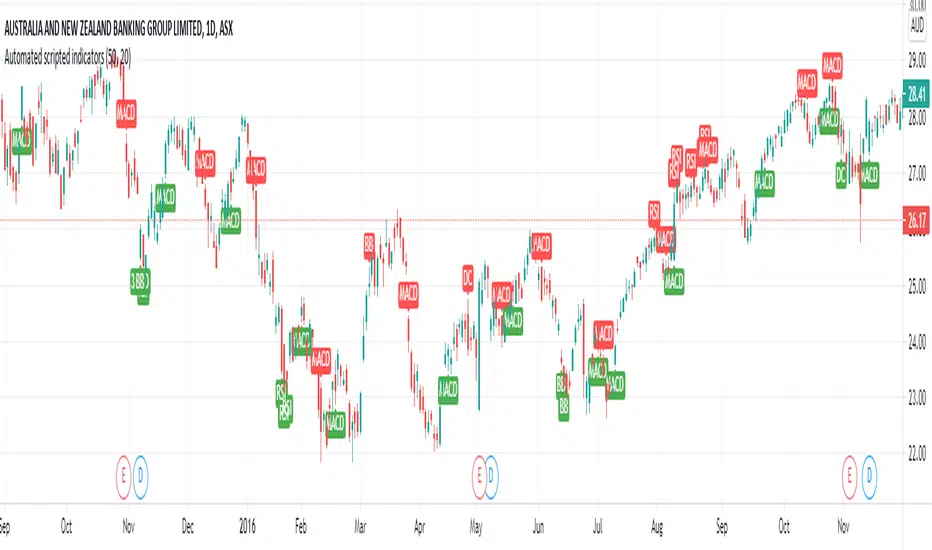
This is a simple script where I have compiled my most commonly used overlays and given each unique buy/sell signals. I have found this to greatly simply my searching for future trades as it quickly outlines the current technical postion of the stock.
Some cons of this script though is the visualization can get messy due to multiple alerts being set off.
--> RSI
Buy signal at or above 70
Sell Signal at or below 30
--> MACD
Buy signal at crossover between macd line and signal line aswell as the histogram line being above 0
Sell signal at crossover between signal line and macd line aswell as the histogram line being below 0
--> Standard Deviations from Mean
Buy signal when the price is 3 standard deviations from the mean.
Sell signal when the price is 3 standard deviations from the mean.
Mean can be adjusted in settings
--> Donchian Channels
Buy signal when the lowest length value is greater than or equal to low aswell as rsi > 45 to help eliminate false signals
Sell signal when the highest length value is greater than or equal to high aswell as rsi < 55 to help eliminate false signals
--> Bollinger bands
Buy when low is at or below the lower band
Sell when high is at or above the higher band
Soon to come:
--> Linear regression
--> ATR
--> CCI
--> Volume
PS. I can also add candlestick patterns, Gann and Fib levels aswell if it will help people out :)
Skrypt chroniony
Ten skrypt został opublikowany jako zamknięty kod źródłowy. Można z tego korzystać swobodnie i bez żadnych ograniczeń — więcej informacji znajduje się tutaj.
Wyłączenie odpowiedzialności
Informacje i publikacje nie stanowią i nie powinny być traktowane jako porady finansowe, inwestycyjne, tradingowe ani jakiekolwiek inne rekomendacje dostarczane lub zatwierdzone przez TradingView. Więcej informacji znajduje się w Warunkach użytkowania.