PROTECTED SOURCE SCRIPT
Zaktualizowano Sentival | QuantEdgeB
Introducing Sentival by QuantEdgeB.
An Adaptive Multi-Factor Indicator for Market Valuation & Trend Strength
____
Overview
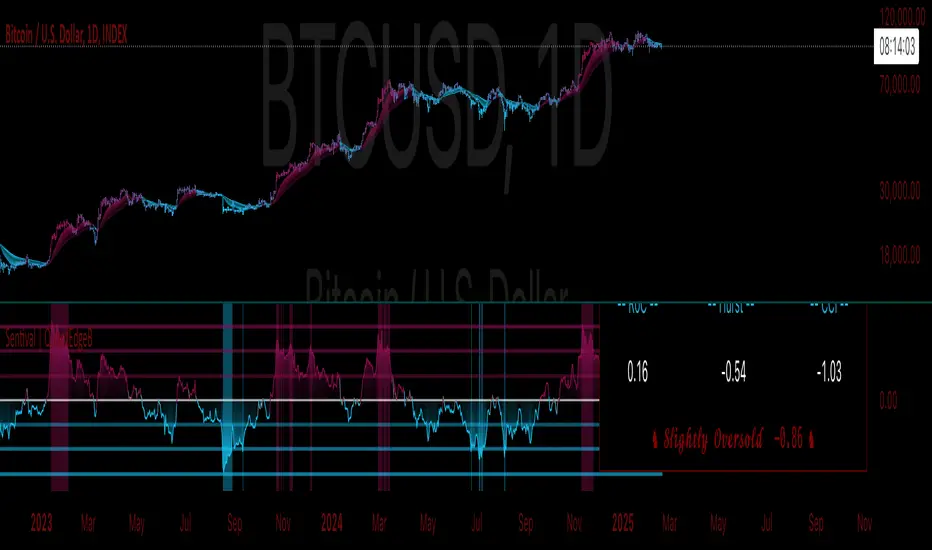
The Sentival Valuation System is a medium-term, multi-factor valuation tool designed to assess market conditions using a combination of momentum, mean reversion, and risk-adjusted metrics. It provides traders and investors with a dynamic score reflecting market valuation, ranging from strongly oversold to strongly overbought conditions.
This system leverages a diverse range of technical indicators, including momentum oscillators, volatility measures, risk ratios, and mean-reversion metrics, providing a holistic view of market conditions.
____
1. Key Features
🛠 Multi-Factor Valuation Model
Sentival aggregates nine different indicators, normalizing and rescaling them into a standardized z-score-based valuation system. The final output represents an average of the selected indicators, allowing for flexible customization based on the user’s preference.
📊 Customizable Indicator Selection
Users can enable or disable any of the nine valuation factors, ensuring the system adapts to different market environments, trading styles, and assets.
🔄 Multi-Timeframe Adaptability
Sentival can be used across different time horizons, making it suitable for short-term mean reversion, medium-term traders, or long-term valuation analysis by simply adjusting the timeframe and indicator settings. This flexibility allows traders to adapt Sentival to various market conditions and trading objectives.
🎨 Intuitive Dashboard & Color Coding
- Dynamic Heatmap & Dashboard: Displays valuation strength across multiple factors.
- Gradient-Based Overbought/Oversold Signals: Clear color-coded signals for easy interpretation.
- Background Highlighting: Optional oversold/overbought background zones.
🏆 Statistical & Risk-Based Insights
- Standardized Rescaling & Z-Score Analysis to prevent bias from individual indicators.
- Risk-Adjusted Metrics such as Sharpe, Sortino, and Omega Ratios help assess the overall market risk appetite.
- Trend Following Mode (TF Display): Users can enable the "Trend Following" option to display the trend direction, helping to align valuation signals with the broader market trend.
____
2. How It Works
1️⃣ Normalization & Rescaling: Each selected indicator is transformed into a standardized scale to ensure fair weighting and prevent distortions from extreme values.
2️⃣ Multi-Indicator Aggregation: The system averages multiple valuation signals into a single z-score, providing a clear overbought/oversold reading rather than relying on a single metric.
3️⃣ Dynamic Trend Filtering: Users can enable Trend Following Mode (TF Display) to overlay directional trend confirmation, helping align valuation signals with momentum.
____
4. Sentival Valuation Score & Interpretation
🔹 Sentival Score Ranges
- 📉 Strongly Oversold (-2 and below) → Market is extremely undervalued; potential reversal.
- 📉 Moderately Oversold (-1.5 to -2) → Discounted market conditions, buying interest may emerge.
- 📉 Slightly Oversold (-0.5 to -1.5) → Possible accumulation phase.
- ⚖ Fair Value (-0.5 to +0.5) → Market trading at equilibrium.
- 📈 Slightly Overbought (+0.5 to +1.5) → Initial signs of market strength.
- 📈 Moderately Overbought (+1.5 to +2) → Market heating up, caution warranted, selling interest may emerge.
- 📈 Strongly Overbought (+2 and above) → Extreme valuation, increased risk of correction.
This classification helps traders gauge overall market sentiment and make better allocation decisions.
Note: Past valuations and buy/sell signals generated by Sentival do not guarantee future performance. Market conditions can change, and proper risk management should always be applied.
____
5. Use Cases & Applications
🔹 📊 Market Rotation & Asset Allocation
- Used as a valuation model to determine if a market or asset is undervalued or overvalued.
- Rotational strategies can benefit from the valuation score by switching exposure between assets.
🔹 📈 Medium-Term Trend Identification
- Detects overbought and oversold conditions while filtering out short-term noise.
- Can be combined with other trend-following indicators for confluence-based strategies.
🔹 🔄 Mean Reversion & Momentum Trading
- Provides statistical validation for momentum breakouts or mean reversion signals.
- Useful for long-short trading strategies, determining optimal entry & exit points.
____
Conclusion
Sentival is a powerful universal valuation system for traders and investors seeking a data-driven, multi-factor approach to market valuation. With its combination of momentum, trend, risk-adjusted, and mean-reversion indicators, it provides a robust, adaptable, and statistically sound framework for making informed market decisions.
🔹 Who Should Use Sentival?
✅ Swing Traders & Medium-Term Investors looking for structured valuation metrics.
✅ Quantitative & Systematic Traders incorporating multi-factor models.
✅ Portfolio Managers optimizing exposure to different market regimes.
🔹 Disclaimer: Past performance is not indicative of future results. No trading strategy can guarantee success in financial markets.
🔹 Strategic Advice: Always backtest, optimize, and align parameters with your trading objectives and risk tolerance before live trading.
An Adaptive Multi-Factor Indicator for Market Valuation & Trend Strength
____
Overview
The Sentival Valuation System is a medium-term, multi-factor valuation tool designed to assess market conditions using a combination of momentum, mean reversion, and risk-adjusted metrics. It provides traders and investors with a dynamic score reflecting market valuation, ranging from strongly oversold to strongly overbought conditions.
This system leverages a diverse range of technical indicators, including momentum oscillators, volatility measures, risk ratios, and mean-reversion metrics, providing a holistic view of market conditions.
____
1. Key Features
🛠 Multi-Factor Valuation Model
Sentival aggregates nine different indicators, normalizing and rescaling them into a standardized z-score-based valuation system. The final output represents an average of the selected indicators, allowing for flexible customization based on the user’s preference.
📊 Customizable Indicator Selection
Users can enable or disable any of the nine valuation factors, ensuring the system adapts to different market environments, trading styles, and assets.
🔄 Multi-Timeframe Adaptability
Sentival can be used across different time horizons, making it suitable for short-term mean reversion, medium-term traders, or long-term valuation analysis by simply adjusting the timeframe and indicator settings. This flexibility allows traders to adapt Sentival to various market conditions and trading objectives.
🎨 Intuitive Dashboard & Color Coding
- Dynamic Heatmap & Dashboard: Displays valuation strength across multiple factors.
- Gradient-Based Overbought/Oversold Signals: Clear color-coded signals for easy interpretation.
- Background Highlighting: Optional oversold/overbought background zones.
🏆 Statistical & Risk-Based Insights
- Standardized Rescaling & Z-Score Analysis to prevent bias from individual indicators.
- Risk-Adjusted Metrics such as Sharpe, Sortino, and Omega Ratios help assess the overall market risk appetite.
- Trend Following Mode (TF Display): Users can enable the "Trend Following" option to display the trend direction, helping to align valuation signals with the broader market trend.
____
2. How It Works
1️⃣ Normalization & Rescaling: Each selected indicator is transformed into a standardized scale to ensure fair weighting and prevent distortions from extreme values.
2️⃣ Multi-Indicator Aggregation: The system averages multiple valuation signals into a single z-score, providing a clear overbought/oversold reading rather than relying on a single metric.
3️⃣ Dynamic Trend Filtering: Users can enable Trend Following Mode (TF Display) to overlay directional trend confirmation, helping align valuation signals with momentum.
____
4. Sentival Valuation Score & Interpretation
🔹 Sentival Score Ranges
- 📉 Strongly Oversold (-2 and below) → Market is extremely undervalued; potential reversal.
- 📉 Moderately Oversold (-1.5 to -2) → Discounted market conditions, buying interest may emerge.
- 📉 Slightly Oversold (-0.5 to -1.5) → Possible accumulation phase.
- ⚖ Fair Value (-0.5 to +0.5) → Market trading at equilibrium.
- 📈 Slightly Overbought (+0.5 to +1.5) → Initial signs of market strength.
- 📈 Moderately Overbought (+1.5 to +2) → Market heating up, caution warranted, selling interest may emerge.
- 📈 Strongly Overbought (+2 and above) → Extreme valuation, increased risk of correction.
This classification helps traders gauge overall market sentiment and make better allocation decisions.
Note: Past valuations and buy/sell signals generated by Sentival do not guarantee future performance. Market conditions can change, and proper risk management should always be applied.
____
5. Use Cases & Applications
🔹 📊 Market Rotation & Asset Allocation
- Used as a valuation model to determine if a market or asset is undervalued or overvalued.
- Rotational strategies can benefit from the valuation score by switching exposure between assets.
🔹 📈 Medium-Term Trend Identification
- Detects overbought and oversold conditions while filtering out short-term noise.
- Can be combined with other trend-following indicators for confluence-based strategies.
🔹 🔄 Mean Reversion & Momentum Trading
- Provides statistical validation for momentum breakouts or mean reversion signals.
- Useful for long-short trading strategies, determining optimal entry & exit points.
____
Conclusion
Sentival is a powerful universal valuation system for traders and investors seeking a data-driven, multi-factor approach to market valuation. With its combination of momentum, trend, risk-adjusted, and mean-reversion indicators, it provides a robust, adaptable, and statistically sound framework for making informed market decisions.
🔹 Who Should Use Sentival?
✅ Swing Traders & Medium-Term Investors looking for structured valuation metrics.
✅ Quantitative & Systematic Traders incorporating multi-factor models.
✅ Portfolio Managers optimizing exposure to different market regimes.
🔹 Disclaimer: Past performance is not indicative of future results. No trading strategy can guarantee success in financial markets.
🔹 Strategic Advice: Always backtest, optimize, and align parameters with your trading objectives and risk tolerance before live trading.
Informacje o Wersji
Spelling mistake fixedInformacje o Wersji
Deep Dive: How Sentival Works & Why It MattersSentival is a multi-factor trend and momentum analysis system, designed to track market cycle shifts using a combination of volatility, momentum, risk assessment, and valuation mechanisms. Instead of focusing on one dimension of the market, Sentival integrates multiple methodologies to cross-validate signals and reduce noise. Each indicator in Sentival plays a specific role, ensuring confirmation across different market conditions.
How Each Component Works Together
1️⃣ Chande Momentum Oscillator (CMO)
• A momentum-based measure that determines whether price action is dominated by upward or downward forces.
• Works well in combination with volatility measures to confirm whether a move is sustainable.
2️⃣ Disparity Index
• Measures the distance between price and its moving average, acting as an overextension filter.
• Ensures that trend-following signals are not driven by short-term spikes but sustained trends.
3️⃣ Bollinger Bands % (BB%)
• A volatility measure that indicates how far price is from the statistical mean.
• Helps identify trend exhaustion points where price moves become unstable.
4️⃣ Relative Strength Index (RSI)
• A trend confirmation layer, ensuring that momentum strength aligns with price movement.
• Adds an additional check to prevent false breakouts.
5️⃣ Rate of Change (RoC)
• Captures the speed of price movement, ensuring that the market has enough momentum for trend continuation.
• Works well with risk indicators to filter weaker moves.
6️⃣ Price Z-Score
• A statistical tool to measure how far price is from its long-term equilibrium.
• Helps prevent entering overstretched trends too late.
7️⃣ Risk Ratios (Sharpe, Sortino, Omega)
• This is the risk-adjusted performance component, ensuring that trends have a healthy risk-reward balance.
• Helps determine when a trend has structurally strong backing rather than speculative movement.
8️⃣ Hurst Cycle Analysis
• Measures the persistence of trends by analyzing price fractals.
• Ensures that the market regime is either trending or mean-reverting, improving trade confidence.
9️⃣ Commodity Channel Index (CCI)
• Helps identify strong trend conditions, adding another layer of momentum confirmation.
• Works well with other oscillators to prevent misreading counter-trends.
🔗 Why These Components Work Well Together
• Momentum + Volatility + Risk → Instead of relying on a single category, Sentival merges multiple dimensions of market behavior into a cohesive signal.
• Filters Out False Signals → Combining momentum oscillators, volatility measures, and risk-adjusted metrics ensures high-confidence entries.
• Adaptability Across Market Regimes → Whether the market is trending, consolidating, or volatile, the system adjusts dynamically.
• Cross-Validation for Trend Strength → If multiple components align, it increases certainty that a trend is real and sustainable.
🚀 Final Thoughts
Sentival it’s a hybrid trend validation model that integrates momentum, volatility, and risk into a single, structured signal.
👉 Ideal for traders looking to identify strong, sustainable trends while filtering out weaker, unreliable signals in various market conditions.
Skrypt chroniony
Ten skrypt został opublikowany jako zamknięty kod źródłowy. Można z tego korzystać swobodnie i bez żadnych ograniczeń — więcej informacji znajduje się tutaj.
🔹 Get access to our premium tools:
whop.com/quantedgeb/ 💎
🔹 Unlock our free toolbox:
tradinglibrary.carrd.co/ 🛠️
Disclaimer: All resources and indicators provided are for educational purposes only
whop.com/quantedgeb/ 💎
🔹 Unlock our free toolbox:
tradinglibrary.carrd.co/ 🛠️
Disclaimer: All resources and indicators provided are for educational purposes only
Wyłączenie odpowiedzialności
Informacje i publikacje nie stanowią i nie powinny być traktowane jako porady finansowe, inwestycyjne, tradingowe ani jakiekolwiek inne rekomendacje dostarczane lub zatwierdzone przez TradingView. Więcej informacji znajduje się w Warunkach użytkowania.