ds Revenue, Margins, Earnings Trends
WHAT IT DOES:
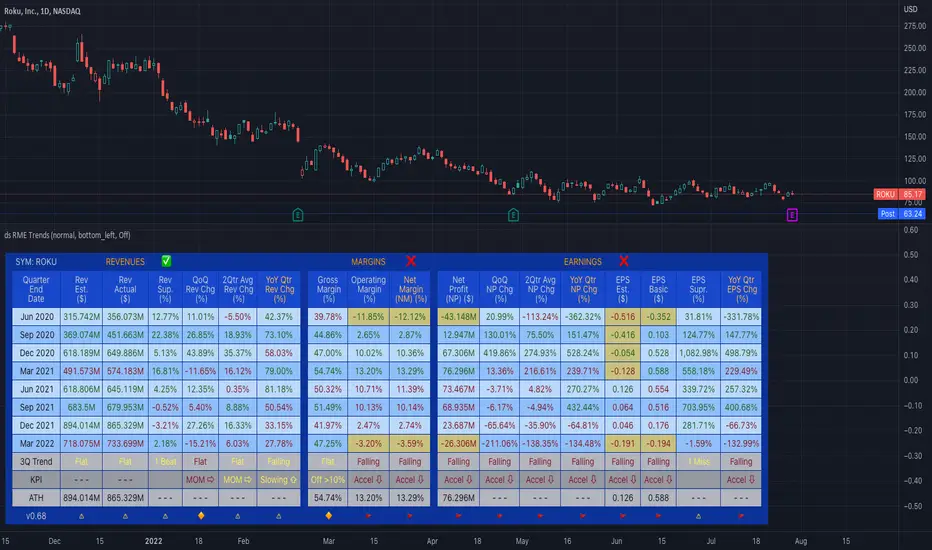
Based on the principle that fundamental trends support technical price trends this indicator intends to help swing and position trading students evaluate the income statement by exposing recent trends in the revenue, margins, and earnings looking at eight quarters of data. It requires three quarters to determine a trend therefore there is a heavy focus on the last three quarters of data. Tools and indicators should be used to "tell something useful" in this case it is specifically is revenue, margins, and earnings expanding, contracting, or flat? Is this movement accelerating or decelerating? Lastly some logic is used to interpret at glance whether this stock warrants a closer look into the fundamentals and technicals of this particular company.
HOW TO:
This is a brief description on how to use this tool
1. TOP ROW: This shows the symbol and then provides a summation indicator (Green Checkmark, Yellow caution triangle, Red X) for each section (Revenue, Margins, Earnings). At a glance shows strength/weakness/concerns.
2. TABLE: You will see 8 quarters of data assuming it is available broken into sections for Revenue, Margins, and Earnings.
3. COLUMNS: The text color red does not denote a negative number and the text color green does not denote a positive number. Rather in the column of data where it is displayed, the green text helps visually show a bullish trend when each value is greater than the prior value and the red text helps visually show a bearish trend when each value is less than the prior value. Yellow background in columns highlights values which should not normally be negative numbers.
4. 3Q TREND ROW: This row analyzes the last three quarters of data in the column to determine if the trend is rising, falling, or flat.
5. 3Q ROCK ROW: This row analyzes the last three quarters of data to determine if the trend is accelerating up, accelerating down, or momentum (MOM) is sideways.
6. BOTTOM ROW INDICATORS: Based on whether the numbers are negative or positive and the trend, This row shows one of the following results:
6a. Green Checkmark is considered acceptable performance.
6b. Yellow Caution Triangle indicates a closer inspection of this columns data is warranted.
6c. Orange Diamond is more serious than the Caution but not as bad as a Red Flag. Extra caution is required here.
6d. Red Flag indicates a warning that undesirable performance characteristics are associated with the data in this column.
- added script version on bottom left of table
- REVENUES TOP ROW: green checkmark revenues condition when all looks reasonable and YoY ROC is flat but >= 20%
- MARGINS TOP ROW: green checkmark margin condition when margins are flat but at acceptable levels (gm_flat, om_flat, nm_flat and most recent quarters margins are gm >= 50%, om >=30%, nm >=25%)
Skrypt tylko na zaproszenie
Tylko użytkownicy zatwierdzeni przez autora mogą uzyskać dostęp do tego skryptu. Musisz złożyć prośbę i uzyskać zgodę na jego użycie. Zazwyczaj jest ona udzielana po dokonaniu płatności. Aby uzyskać więcej informacji, postępuj zgodnie z instrukcjami autora poniżej lub skontaktuj się bezpośrednio z darrels.
TradingView NIE zaleca płacenia za skrypt ani jego używania, jeśli nie masz pełnego zaufania do jego autora i nie rozumiesz, jak działa. Możesz także znaleźć darmowe, open-source'owe alternatywy w naszej sekcji skryptów społecznościowych.
Instrukcje autora
Wyłączenie odpowiedzialności
Skrypt tylko na zaproszenie
Tylko użytkownicy zatwierdzeni przez autora mogą uzyskać dostęp do tego skryptu. Musisz złożyć prośbę i uzyskać zgodę na jego użycie. Zazwyczaj jest ona udzielana po dokonaniu płatności. Aby uzyskać więcej informacji, postępuj zgodnie z instrukcjami autora poniżej lub skontaktuj się bezpośrednio z darrels.
TradingView NIE zaleca płacenia za skrypt ani jego używania, jeśli nie masz pełnego zaufania do jego autora i nie rozumiesz, jak działa. Możesz także znaleźć darmowe, open-source'owe alternatywy w naszej sekcji skryptów społecznościowych.