PROTECTED SOURCE SCRIPT
Crypto Neo - Blockchain Momentum (BTC Settings)
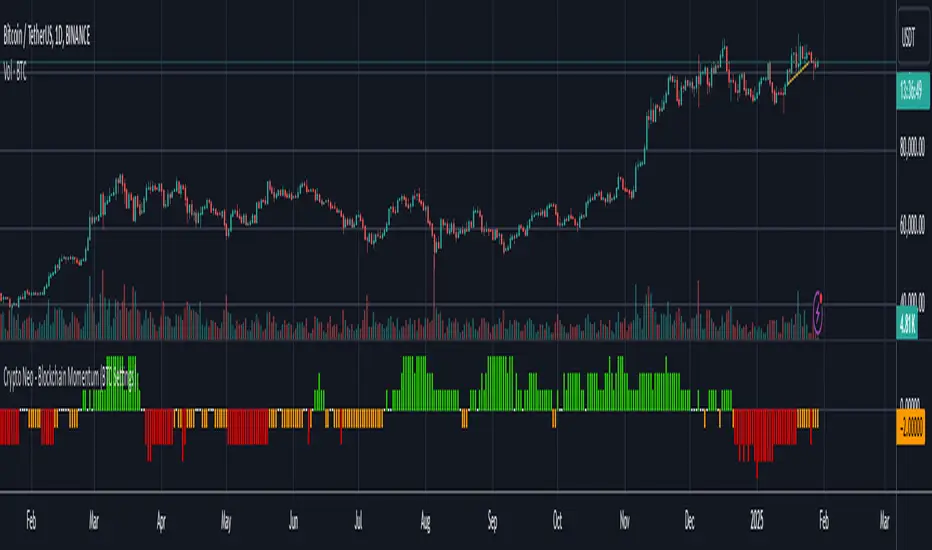
The Crypto Neo - Blockchain Momentum indicator analyzes Bitcoin’s on-chain activity to gauge bullish or bearish trends. It combines multiple on-chain metrics and applies different moving average strategies to assess Bitcoin’s momentum.
This indicator is designed to track key blockchain data sources, such as:
It processes these inputs using various Moving Average (MA) types, including SMA, EMA, DMA, to generate a Bullish Momentum Score, which is visually displayed on the chart.
How to Use:
Important Notes
* This indicator does not generate trading signals but helps interpret blockchain trends for informed decision-making.
* Since it relies on daily on-chain data, it is best used on the 1D timeframe for accurate readings.
* Real-time calculations may vary slightly due to different bar update behaviors.
This indicator is very useful to confirm market turns early. Here are a few an example setups:
1. Back in 2019 on chain metrics started trending up after the market had dumped signaling a very good opportunity to buy.

2. During the 2021 bull market. When the market was forming a top, the on chain metrics started trending down indicating a risk to the downside.

This indicator is designed to track key blockchain data sources, such as:
- Hash Rate
- Active Addresses
- Transactions per Second
- New Addresses
- Trader Behavior
- Long-Term Holders (Cruisers)
- Money Flow In/Out
- Large Transactions Count
It processes these inputs using various Moving Average (MA) types, including SMA, EMA, DMA, to generate a Bullish Momentum Score, which is visually displayed on the chart.
How to Use:
- Select MA Type – Choose between SMA, EMA, MIXMA, or DMA to determine how moving averages are applied.
- Set MA Lengths – Adjust MA1 Length and MA2 Length to define short-term vs. long-term trend comparison.
- Customize Data Sources – Select different on-chain metrics for the indicator to analyze.
- Interpret the Bullish Momentum Score:
🟢 Green (Strong Bullish Momentum) – Bullish on-chain signals dominate.
🟡 Yellow (Moderate Bullish Momentum) – Weak bullish trend forming.
⚪ White (Neutral) – No clear trend.
🟠 Orange (Moderate Bearish Momentum) – Weak bearish signals emerging.
🔴 Red (Strong Bearish Momentum) – Bearish on-chain signals dominate.
Important Notes
* This indicator does not generate trading signals but helps interpret blockchain trends for informed decision-making.
* Since it relies on daily on-chain data, it is best used on the 1D timeframe for accurate readings.
* Real-time calculations may vary slightly due to different bar update behaviors.
This indicator is very useful to confirm market turns early. Here are a few an example setups:
1. Back in 2019 on chain metrics started trending up after the market had dumped signaling a very good opportunity to buy.
2. During the 2021 bull market. When the market was forming a top, the on chain metrics started trending down indicating a risk to the downside.
Skrypt chroniony
Ten skrypt został opublikowany jako zamknięty kod źródłowy. Można z tego korzystać swobodnie i bez żadnych ograniczeń — więcej informacji znajduje się tutaj.
Crypto Neo
📈 Algo Strategies | Market Signals
🔍 Data-Driven Edge for Traders
⚡ Developing high-performance trading systems
📢 Telegram 👉 t.me/cryptoNeo0x
📈 Algo Strategies | Market Signals
🔍 Data-Driven Edge for Traders
⚡ Developing high-performance trading systems
📢 Telegram 👉 t.me/cryptoNeo0x
Wyłączenie odpowiedzialności
Informacje i publikacje nie stanowią i nie powinny być traktowane jako porady finansowe, inwestycyjne, tradingowe ani jakiekolwiek inne rekomendacje dostarczane lub zatwierdzone przez TradingView. Więcej informacji znajduje się w Warunkach użytkowania.