CVD Line + EMA
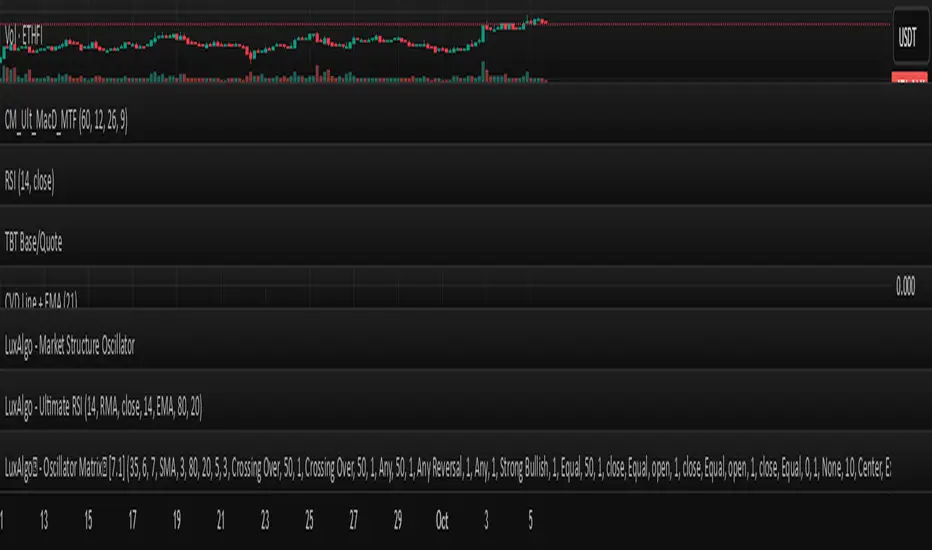
Settings allow users to customize the EMA period to suit different timeframes or trading strategies. The script is intended for educational purposes and is released under the Mozilla Public License 2.0. For best results, use in conjunction with other analysis and risk management tools.
Skrypt tylko na zaproszenie
Tylko użytkownicy zatwierdzeni przez autora mogą uzyskać dostęp do tego skryptu. Musisz złożyć prośbę i uzyskać zgodę na jego użycie. Zazwyczaj jest ona udzielana po dokonaniu płatności. Aby uzyskać więcej informacji, postępuj zgodnie z instrukcjami autora poniżej lub skontaktuj się bezpośrednio z MFH_BM.
TradingView NIE zaleca płacenia za skrypt ani jego używania, jeśli nie masz pełnego zaufania do jego autora i nie rozumiesz, jak działa. Możesz także znaleźć darmowe, open-source'owe alternatywy w naszej sekcji skryptów społecznościowych.
Instrukcje autora
Wyłączenie odpowiedzialności
Skrypt tylko na zaproszenie
Tylko użytkownicy zatwierdzeni przez autora mogą uzyskać dostęp do tego skryptu. Musisz złożyć prośbę i uzyskać zgodę na jego użycie. Zazwyczaj jest ona udzielana po dokonaniu płatności. Aby uzyskać więcej informacji, postępuj zgodnie z instrukcjami autora poniżej lub skontaktuj się bezpośrednio z MFH_BM.
TradingView NIE zaleca płacenia za skrypt ani jego używania, jeśli nie masz pełnego zaufania do jego autora i nie rozumiesz, jak działa. Możesz także znaleźć darmowe, open-source'owe alternatywy w naszej sekcji skryptów społecznościowych.