PROTECTED SOURCE SCRIPT
3D Relative Strength Index
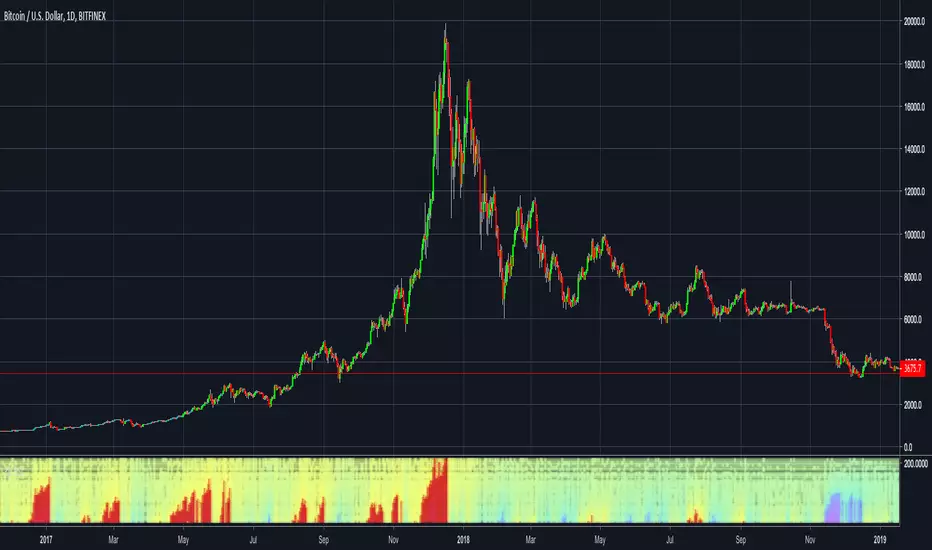
This indicator in form of a heatmap shows the longest periods of RSI values above 70 and under 30.
Red spots mean RSI is above 70 and blue ones RSI is under 30.
Red spots mean RSI is above 70 and blue ones RSI is under 30.
Skrypt chroniony
Ten skrypt został opublikowany jako zamknięty kod źródłowy. Można z tego korzystać swobodnie i bez żadnych ograniczeń — więcej informacji znajduje się tutaj.
Wyłączenie odpowiedzialności
Informacje i publikacje nie stanowią i nie powinny być traktowane jako porady finansowe, inwestycyjne, tradingowe ani jakiekolwiek inne rekomendacje dostarczane lub zatwierdzone przez TradingView. Więcej informacji znajduje się w Warunkach użytkowania.