PROTECTED SOURCE SCRIPT
Zaktualizowano h/l raid @joshuuu
This indicator shows, when important liquidity pools have been taken out.
Which liquidity pools are important and how should I use them?
The day can be divided into different session. asia, london and new york session, those sessions can be narrowed down even further into killzones, taught by ict.
The times for those killzones are:
Asia - 2000-0000 ny time
London - 0200-0500 ny time
ny am - 0830-1100 ny time
nypm - 13.30-1600 ny time
Highs/Lows that have been created within those killzones (sessions with highest volume) should hold some liquidity.
That's why this indicator displays arrows with different colors to highlight once those highs/lows get taken out.
Additionally, the indicator also shows raids (liquidity grabs) of the previous daily, previous weekly and previous monthly high/low.
All colors are adaptable.
How do I use that indicator for my trading.
Once those important liquidity pools are taken out, we often see a reversal in the marketplace. One can wait for a raid and then watch for a potential market structure shift into the opposite direction to anticipate a reversal.
Note:
It is possible to create alerts for those kind of raids.
Examples:
ES:

Price takes out Asia High (red triangle) and London High (blue triangle). Price then forms a market structure shift (lower low after a series of higher lows) and creates a fair value gap while doing so.
That would be a valid setup. Again, all these are concepts by TheInnerCircleTrader.
EU:

On this EurUsd Chart, we can see, how the triangles (liquidity grabs) can be an early indication for potential reversals.
Asia high and london high has been taken out. market structure shift (light bulb) and then a fairvalue gap.
Which liquidity pools are important and how should I use them?
The day can be divided into different session. asia, london and new york session, those sessions can be narrowed down even further into killzones, taught by ict.
The times for those killzones are:
Asia - 2000-0000 ny time
London - 0200-0500 ny time
ny am - 0830-1100 ny time
nypm - 13.30-1600 ny time
Highs/Lows that have been created within those killzones (sessions with highest volume) should hold some liquidity.
That's why this indicator displays arrows with different colors to highlight once those highs/lows get taken out.
Additionally, the indicator also shows raids (liquidity grabs) of the previous daily, previous weekly and previous monthly high/low.
All colors are adaptable.
How do I use that indicator for my trading.
Once those important liquidity pools are taken out, we often see a reversal in the marketplace. One can wait for a raid and then watch for a potential market structure shift into the opposite direction to anticipate a reversal.
Note:
It is possible to create alerts for those kind of raids.
Examples:
ES:
Price takes out Asia High (red triangle) and London High (blue triangle). Price then forms a market structure shift (lower low after a series of higher lows) and creates a fair value gap while doing so.
That would be a valid setup. Again, all these are concepts by TheInnerCircleTrader.
EU:
On this EurUsd Chart, we can see, how the triangles (liquidity grabs) can be an early indication for potential reversals.
Asia high and london high has been taken out. market structure shift (light bulb) and then a fairvalue gap.
Informacje o Wersji
changed nykz to nyam and nypmInformacje o Wersji
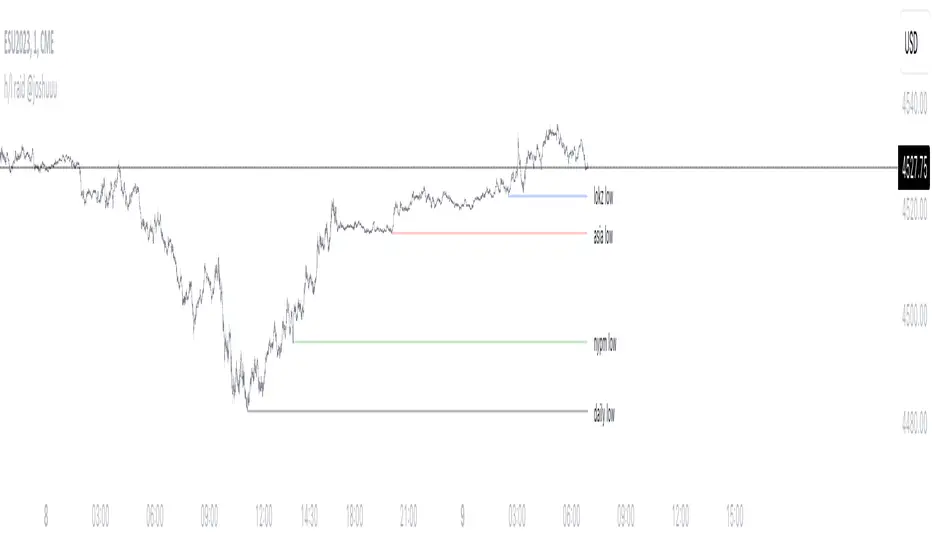
added the option to show lines of the liquidity poolsInformacje o Wersji
-option to enable/disable shapes-option to enable/disable lines
-option to set the label size
-option to set the label location
Informacje o Wersji
fixed weekly/monthly colorSkrypt chroniony
Ten skrypt został opublikowany jako zamknięty kod źródłowy. Można z tego korzystać swobodnie i bez żadnych ograniczeń — więcej informacji znajduje się tutaj.
Wyłączenie odpowiedzialności
Informacje i publikacje nie stanowią i nie powinny być traktowane jako porady finansowe, inwestycyjne, tradingowe ani jakiekolwiek inne rekomendacje dostarczane lub zatwierdzone przez TradingView. Więcej informacji znajduje się w Warunkach użytkowania.
Skrypt chroniony
Ten skrypt został opublikowany jako zamknięty kod źródłowy. Można z tego korzystać swobodnie i bez żadnych ograniczeń — więcej informacji znajduje się tutaj.
Wyłączenie odpowiedzialności
Informacje i publikacje nie stanowią i nie powinny być traktowane jako porady finansowe, inwestycyjne, tradingowe ani jakiekolwiek inne rekomendacje dostarczane lub zatwierdzone przez TradingView. Więcej informacji znajduje się w Warunkach użytkowania.