PROTECTED SOURCE SCRIPT
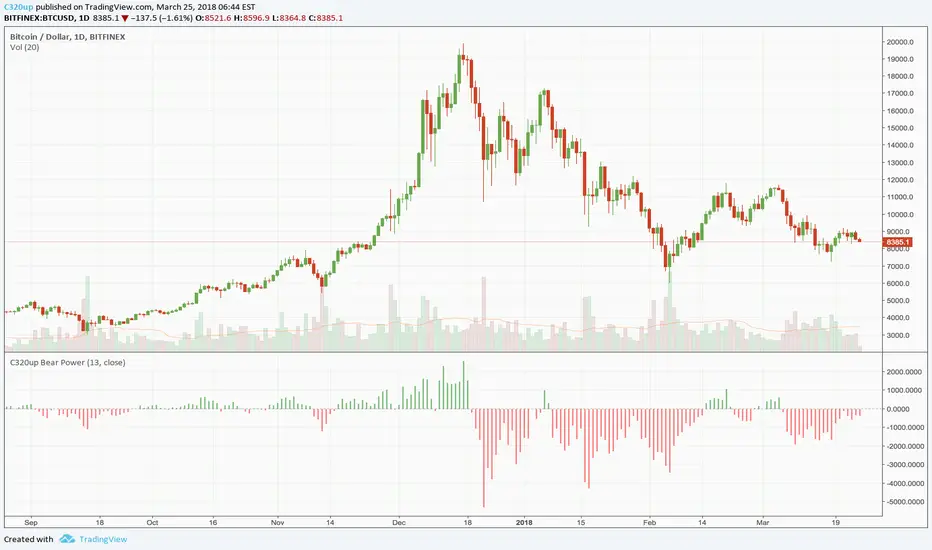
C320up Bear Power

C320up Bear Power
“The Bears Power oscillator was developed by Alexander Elder. It measures the difference between the lowest price and a 13-day Exponential Moving Average (EMA), plotted as a histogram. If the Bears Power indicator is below zero, it means sellers were able to drive price below the EMA. If the Bears Power indicator is above zero, it means buyers were able to keep the lowest price above the EMA. Bears Power is a fully unbounded oscillator with a base value of 0 and has no lower or upper limit. The indicator is often used in combination with other signals.” ~ TradingView
You can customise the colours of this indicator or change from histogram to area, line, etc., or a combination of these.
The default colours are Green (Bulls) for above zero, and Red (Bears) for below zero.
This indicator is not to be confused with Elder’s Force Index, which uses SMA and Volume.
Skrypt chroniony
Ten skrypt został opublikowany jako zamknięty kod źródłowy. Można z tego korzystać swobodnie i bez żadnych ograniczeń — więcej informacji znajduje się tutaj.
Wyłączenie odpowiedzialności
Informacje i publikacje nie stanowią i nie powinny być traktowane jako porady finansowe, inwestycyjne, tradingowe ani jakiekolwiek inne rekomendacje dostarczane lub zatwierdzone przez TradingView. Więcej informacji znajduje się w Warunkach użytkowania.