PROTECTED SOURCE SCRIPT
Pivot Connect
Pivot Connect –
a condensed and educational version
Objective
Automatically draws extended horizontal lines at the pivots (relevant highs and lows) of three timeframes:
The current chart (1 min, 5 min, 1 h… whatever you're looking at)
Weekly (W)
4-hour (240 min)
These lines are considered "protected levels": resistances (highs) or supports (lows).
The script also detects when the price breaks only the wick break to change the color/style of the line and warn that the level may have become invalid.
What is a pivot here?
ta.pivothigh / ta.pivotlow calculate a local high/low that has at least n bars on either side.
The pivotStrength parameter (default 12) is that n.
Therefore, a pivot high requires 12 candles to the left and 12 to the right lower than itself.
Lines drawn:
Highs and lows of the current timeframe (red and green)
Weekly highs and lows (blue and orange) if useWeekly = true
4-hour highs and lows (fuchsia and aqua) if use4H = true
Each line extends to the right by "extendLines" bars (default 100).
Wick break
This is reviewed bar by bar:
For a High level: if the high breaks above the line but the close remains below → it is considered a false break (wick break) and the line changes to purple and dashed style.
For a Low level: if the low breaks above the line but the close remains above → same warning.
The wickBreakBars (5) parameter is not used in the current logic; it was probably intended for future validation.
Cleaning Old Lines
Every 100 bars, lines with a right end older than 500 bars are removed to avoid memory overload (max_lines_count = 500).
Quick Customization
Colors and styles for each category.
Show or hide each line group (showHighs, showLows, useWeekly, use4H).
Thickness, solid/dash/dotted style.
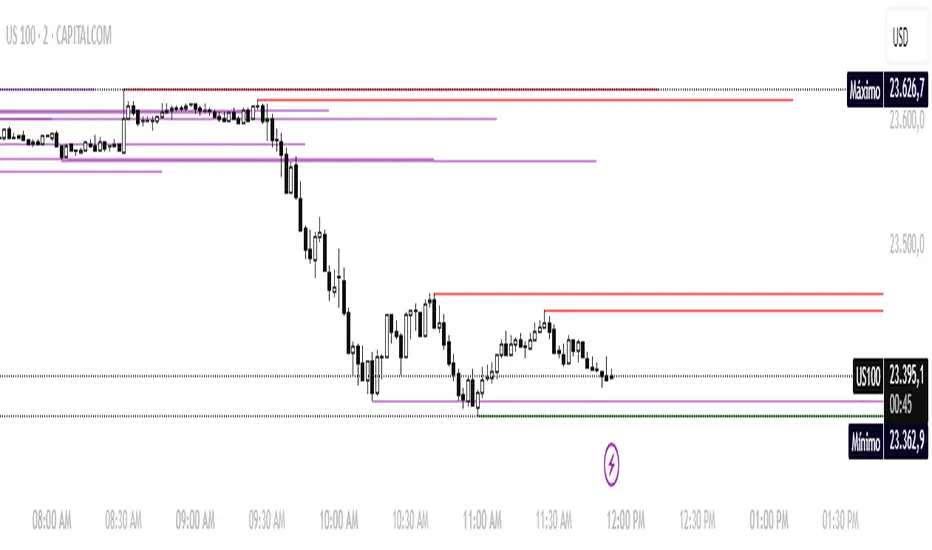
Example of on-screen reading
Horizontal red line: resistance of the timeframe itself.
Horizontal blue line: important weekly high.
If a line changes to dashed purple: the price pierced it with the wick but did not close above it (at highs) – possible rejection.
This gives you a visual map of multi-timeframe support and resistance levels with quick alerts for "suspicious" breakouts.
a condensed and educational version
Objective
Automatically draws extended horizontal lines at the pivots (relevant highs and lows) of three timeframes:
The current chart (1 min, 5 min, 1 h… whatever you're looking at)
Weekly (W)
4-hour (240 min)
These lines are considered "protected levels": resistances (highs) or supports (lows).
The script also detects when the price breaks only the wick break to change the color/style of the line and warn that the level may have become invalid.
What is a pivot here?
ta.pivothigh / ta.pivotlow calculate a local high/low that has at least n bars on either side.
The pivotStrength parameter (default 12) is that n.
Therefore, a pivot high requires 12 candles to the left and 12 to the right lower than itself.
Lines drawn:
Highs and lows of the current timeframe (red and green)
Weekly highs and lows (blue and orange) if useWeekly = true
4-hour highs and lows (fuchsia and aqua) if use4H = true
Each line extends to the right by "extendLines" bars (default 100).
Wick break
This is reviewed bar by bar:
For a High level: if the high breaks above the line but the close remains below → it is considered a false break (wick break) and the line changes to purple and dashed style.
For a Low level: if the low breaks above the line but the close remains above → same warning.
The wickBreakBars (5) parameter is not used in the current logic; it was probably intended for future validation.
Cleaning Old Lines
Every 100 bars, lines with a right end older than 500 bars are removed to avoid memory overload (max_lines_count = 500).
Quick Customization
Colors and styles for each category.
Show or hide each line group (showHighs, showLows, useWeekly, use4H).
Thickness, solid/dash/dotted style.
Example of on-screen reading
Horizontal red line: resistance of the timeframe itself.
Horizontal blue line: important weekly high.
If a line changes to dashed purple: the price pierced it with the wick but did not close above it (at highs) – possible rejection.
This gives you a visual map of multi-timeframe support and resistance levels with quick alerts for "suspicious" breakouts.
Skrypt chroniony
Ten skrypt został opublikowany jako zamknięty kod źródłowy. Można z tego korzystać swobodnie i bez żadnych ograniczeń — więcej informacji znajduje się tutaj.
Te enseño a perder dignamente.. Luego te digo el porque... Paciencia
Wyłączenie odpowiedzialności
Informacje i publikacje nie stanowią i nie powinny być traktowane jako porady finansowe, inwestycyjne, tradingowe ani jakiekolwiek inne rekomendacje dostarczane lub zatwierdzone przez TradingView. Więcej informacji znajduje się w Warunkach użytkowania.