OPEN-SOURCE SCRIPT
Zaktualizowano BTC Power of Law x Central Bank Liquidity
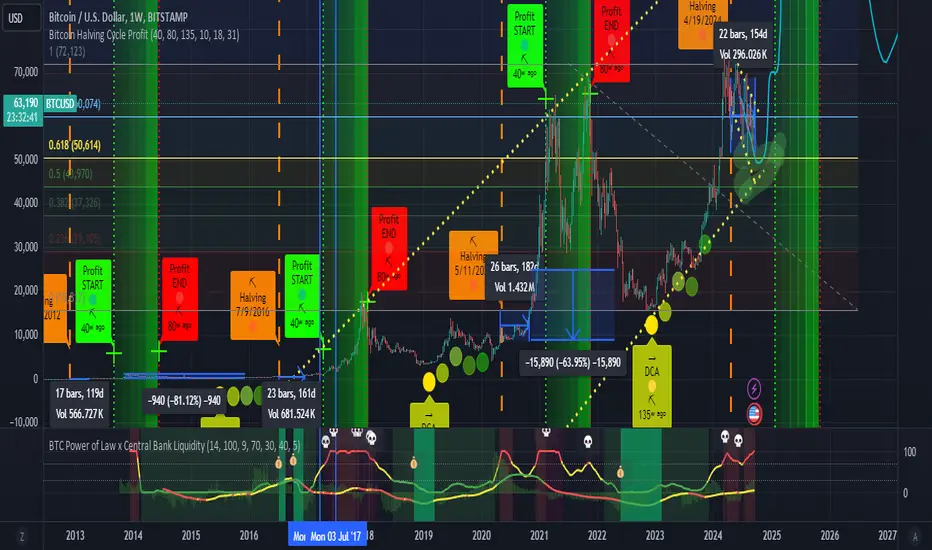
This indicator combines Bitcoin's long-term growth model (Power Law) with global central bank liquidity to help identify potential buy and sell signals.
How it works:
Power Law Oscillator: This part of the indicator tracks how far Bitcoin's current price is from its expected long-term growth, based on an exponential model. It helps you see when Bitcoin may be overbought (too expensive) or oversold (cheap) compared to its historical trend.
Central Bank Liquidity: This measures the amount of money injected into the financial system by major central banks (like the Fed or ECB). When more money is printed, asset prices, including Bitcoin, tend to rise. When liquidity dries up, prices often fall.
By combining these two factors, the indicator gives you a more accurate view of Bitcoin's price trends.
How to interpret:
Green Line: Bitcoin is undervalued compared to its long-term growth, and the liquidity environment is supportive. This is typically a buy signal.
Yellow Line: Bitcoin is trading near its expected value, or there's uncertainty due to mixed liquidity conditions. This is a hold signal.
Red Line: Bitcoin is overvalued, or liquidity is tightening. This is a potential sell signal.
Zones:
The background will turn green when Bitcoin is in a buy zone and red when it's in a sell zone, giving you easy-to-read visual cues.
Informacje o Wersji
Now with central bank money supply histogramInformacje o Wersji
Added some emoji for better visualizationInformacje o Wersji
Fixed bug with emojisInformacje o Wersji
Clearer high prob buy zonesSkrypt open-source
W zgodzie z duchem TradingView twórca tego skryptu udostępnił go jako open-source, aby użytkownicy mogli przejrzeć i zweryfikować jego działanie. Ukłony dla autora. Korzystanie jest bezpłatne, jednak ponowna publikacja kodu podlega naszym Zasadom serwisu.
Wyłączenie odpowiedzialności
Informacje i publikacje nie stanowią i nie powinny być traktowane jako porady finansowe, inwestycyjne, tradingowe ani jakiekolwiek inne rekomendacje dostarczane lub zatwierdzone przez TradingView. Więcej informacji znajduje się w Warunkach użytkowania.
Skrypt open-source
W zgodzie z duchem TradingView twórca tego skryptu udostępnił go jako open-source, aby użytkownicy mogli przejrzeć i zweryfikować jego działanie. Ukłony dla autora. Korzystanie jest bezpłatne, jednak ponowna publikacja kodu podlega naszym Zasadom serwisu.
Wyłączenie odpowiedzialności
Informacje i publikacje nie stanowią i nie powinny być traktowane jako porady finansowe, inwestycyjne, tradingowe ani jakiekolwiek inne rekomendacje dostarczane lub zatwierdzone przez TradingView. Więcej informacji znajduje się w Warunkach użytkowania.