PROTECTED SOURCE SCRIPT
Correlation Tracker - Joe v1
Correlation Tracker – Joe v1
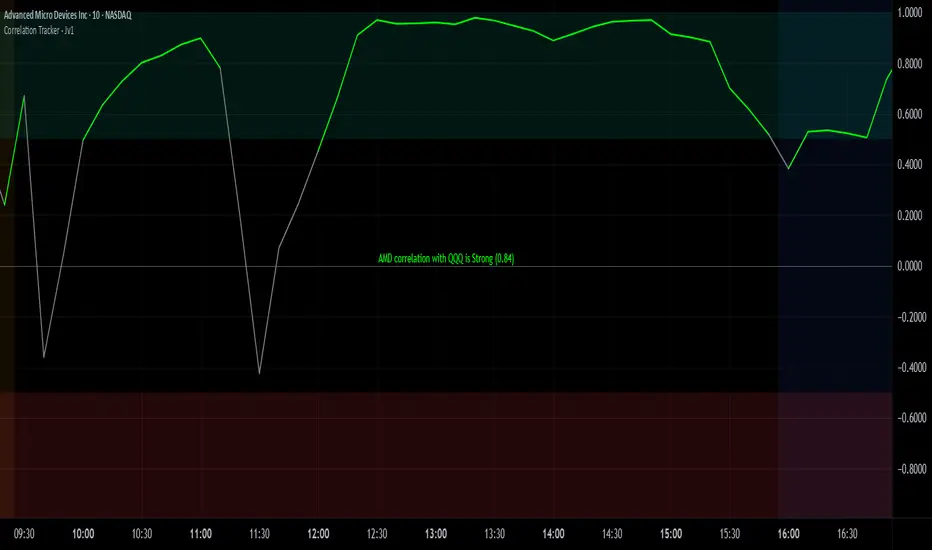
This indicator calculates the correlation between a selected ticker and an index over a user-defined period. It visualizes correlation with color-coded lines, thresholds, and a descriptive rating, helping traders quickly gauge the strength and direction of correlation.
________________________________________
Options and What They Do
General Settings
• Symbol: Select the ticker you want to analyze.
• Use Chart Symbol: If enabled, the script will use the symbol of the current chart instead of a manually selected symbol.
• Index: Choose the reference index or asset to compare the correlation against. Default is NASDAQ:QQQ.
• Length: Sets the number of periods used to calculate correlation via a moving average. Shorter lengths respond faster; longer lengths smooth correlation.
Correlation Rating Settings
• Show Correlation Rating: Display a textual description of correlation strength (e.g., Ultra Strong, Moderate, Weak).
• Position: Choose where the correlation rating table will appear on the chart (Top/Bottom, Left/Center/Right).
Correlation Line Settings
• Positive Color: Line color when correlation is above the positive threshold. Default: green.
• Negative Color: Line color when correlation is below the negative threshold. Default: red.
• Neutral Color: Line color when correlation is between thresholds. Default: gray.
Correlation Thresholds
• Positive – From: Minimum correlation value considered positive. Default: 0.5 (range 0–0.9).
• Positive Color BG: Background color fill for positive correlation range.
• Negative – From: Maximum correlation value considered negative. Default: -0.5 (range -0.9–0).
• Negative Color BG: Background color fill for negative correlation range.
________________________________________
How It Works
1. Calculates correlation between the selected ticker and the index using logarithmic returns.
2. Plots the correlation line with colors based on thresholds: positive (green), negative (red), neutral (gray).
3. Displays a correlation rating table showing strength (Ultra Weak → Ultra Strong) and absolute correlation on a 0–1 scale.
4. Allows customization of visual appearance, thresholds, and position of rating for clarity on any chart.
Skrypt chroniony
Ten skrypt został opublikowany jako zamknięty kod źródłowy. Można z tego korzystać swobodnie i bez żadnych ograniczeń — więcej informacji znajduje się tutaj.
Wyłączenie odpowiedzialności
Informacje i publikacje nie stanowią i nie powinny być traktowane jako porady finansowe, inwestycyjne, tradingowe ani jakiekolwiek inne rekomendacje dostarczane lub zatwierdzone przez TradingView. Więcej informacji znajduje się w Warunkach użytkowania.