PROTECTED SOURCE SCRIPT
matrix momentum package
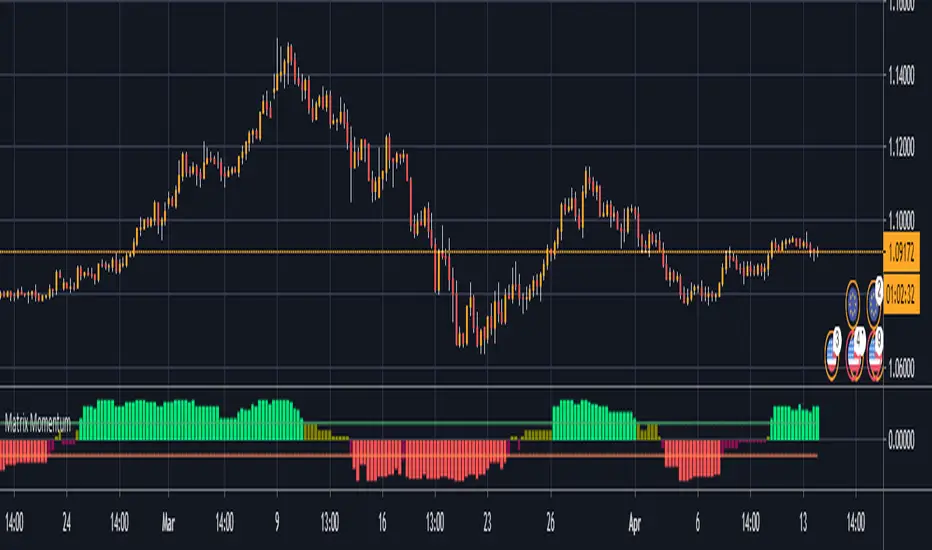
This indicator gives a score to the momentum of a market in a percentage term based on a combination of measurements, this can be used on any time frame, on any instrument to identify if the current trend has enough momentum to see it carry on further this will help eliminate fomo and also help you to identify reversals in the chart at the right time so you can eliminate exposure to a market about to reverse, there is 4 levels to this indicator you have a strong bullish trend denote by green bars the weaker bullish trend denoted by the olive coloured bars, a weak bearish trend which is given in maroon bars and a strong bearish trend which gives red bars you will also note the 2 horizontal boundary lines these are not overbought and oversold bounds like in most indicators but actually indicate whether there is sufficient momentum in the market as the idea is that in strong momentum you want it to be above or below this line to give you confidence there is momentum available to ride
Skrypt chroniony
Ten skrypt został opublikowany jako zamknięty kod źródłowy. Można z tego korzystać swobodnie i bez żadnych ograniczeń — więcej informacji znajduje się tutaj.
Wyłączenie odpowiedzialności
Informacje i publikacje nie stanowią i nie powinny być traktowane jako porady finansowe, inwestycyjne, tradingowe ani jakiekolwiek inne rekomendacje dostarczane lub zatwierdzone przez TradingView. Więcej informacji znajduje się w Warunkach użytkowania.